|
|
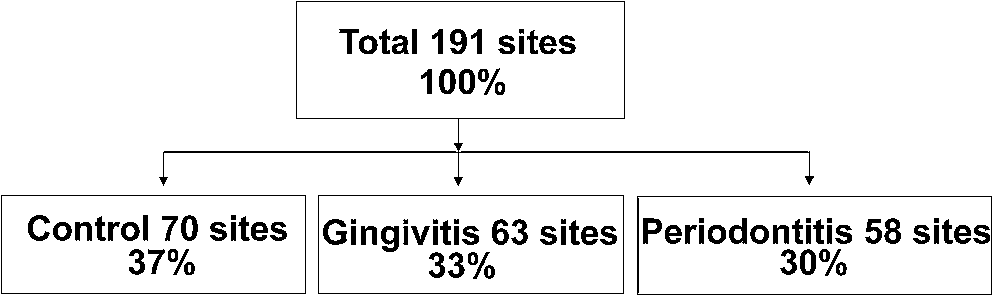
1.IntroductionPeriodontitis is a multifactorial inflammatory disease involving both soft and hard tissues surrounding the teeth that leads to progressive destruction of the periodontal ligament and alveolar bone resulting in clinical features such as pocket formation, gingival recession, or mobility. It is an endemic infectious disease affecting the tissues surrounding the teeth, which results in significant debilitation for about half of the affected persons.1 Periodontal diseases begin as gingivitis and progress slowly towards periodontitis. Gingivitis is the presence of gingival inflammation without the loss of connective tissue attachment, whereas periodontitis is the inflammation of the periodontium characterized by pathological detachment of collagen fibers from cementum with the junctional epithelium migrated apically. Inflammatory events associated with connective tissue attachment loss also lead to the resorption of coronal portions of tooth supporting the alveolar bone.2 Recent studies have revealed the influence of periodontitis on increased risk of vascular diseases, diabetes mellitus, lung diseases, and preterm delivery.3–5 The gold standard for diagnosis of periodontitis is the clinical level of periodontal attachment. The parameters used in routine clinical practice to evaluate the status of periodontal disease are periodontal probing depth and bleeding on probing. Nevertheless, probe penetration is affected by the inflammatory status of periodontal tissue. The poor reliability and reproducibility associated with the measurement of clinical attachment level (CAL) to monitor the progression of periodontal destruction and to evaluate the effect of periodontal treatment limit the practical value of periodontal probing, despite its popular use.6 Another method often used to determine the extent of periodontal destruction is radiographic examination, which shows the amount of alveolar bone remaining. As radiographs reveal the consequence of past pathological experience, destruction and bone damage are observed only after 30% to 50% of the mineral has been lost. Therefore, the main drawback of this traditional diagnostic procedure is that it cannot reliably distinguish between disease-active and disease-inactive sites.7 This leads to inaccuracies in the diagnosis as well as the prognosis of periodontal diseases. Therefore, for decades there has been an ongoing search for clinically acceptable methods for the accurate diagnosis of periodontal disease. Parameters such as blood concentration, oxygenation, and blood flow in gingival tissues have been explored for evaluating the level of gingival inflammation.8–11 Some of these techniques relied on laser Doppler flowmetry for assessing the blood flow and tissue reflectance spectroscopy for determining the changes in blood concentration and oxygenation. The principle behind diffuse reflectance (DR) spectroscopy is that the evaluation of blood concentration and oxygenation in tissues relies on the spectral absorption differences of oxygenated and deoxygenated hemoglobin.12 To determine the condition of a tissue and to diagnose periodontal disease, clinicians use visual perception of tissue color apart from clinical examination. The eye can only judge the appearance of color but cannot interpret the underlying reasons for this color change. Therefore, visual perception is easily deceived, resulting in subjective judgment. Since human vision lacks the ability to interpret the wavelength dependence of color, techniques for measuring light at high wavelength resolution are necessary to identify tissue chromophores with good specificity and sensitivity. Noninvasive diagnostic methods that do not use ionizing radiation are of particular interest for routine use in the diagnosis and monitoring of periodontitis as well as for predicting disease progression. Optical spectroscopy is evolving as a potential diagnostic tool for the monitoring of oral infections. This is due to the fact that the spectra can be captured instantly and no consumables, such as antibodies, substrates, or molecular probes, are required to be purchased or developed; once the equipment is in place, it is inexpensive to operate.13 In addition, this technique uses low-energy radiation and is entirely noninvasive, without the need for tissue removal, and does not impose any discomfort to the patient during the procedure. Furthermore, this method provides a completely different assessment of periodontal inflammation in real time, and, if clinically validated, it could either replace traditional clinical examinations for the diagnosis of periodontitis or at least serve as attractive complementary diagnostic tool. In DR spectroscopy the light entering the tissue undergoes a combination of multiple elastic scattering and absorption before getting transmitted through the sample material. Spectral features of the diffusely reflected and backscattered component of incident light provide information about tissue absorbers and scatterers. Oxygenated hemoglobin absorption produces strong absorption dips at 545 and 575 nm in the DR spectra of oral mucosa that vary with the grade of tissue malignancy. Subhash et al.14 proposed that absorption intensity ratio R545/R575 of oxygenated hemoglobin in tissues could be used for classification of different grades of oral cancer while studying the DR spectral features of surgically excised tissues. Later, in a clinical study Mallia et al.15 applied this DR ratio technique for in situ detection and discrimination of oral premalignant and cancerous lesions of the oral cavity. Further studies using DR spectral intensity ratio R545/R575 have convincingly proved that this technique not only detects oral premalignant and cancerous lesions with high sensitivity and specificity but also discriminates precancerous lesions of the tongue and lip that are difficult to diagnose from tissue autofluorescence.16,17 Hanioka and colleagues extensively studied the Hb index (hemoglobin concentration), oxygenated hemoglobin (oxy Hb) index, and oxygen saturation (apparent ) in human gingiva.10,11,18 Their studies clearly demonstrated that the Hb index, oxy Hb index, and deoxy Hb index in moderately inflamed gingiva were significantly higher than those in clinically healthy gingiva.18 Sites having periodontitis were not included in this study. Later, Liu et al.13 reported that optical spectroscopy can simultaneously determine multiple inflammatory indices directly in the periodontal tissues in vivo and that visible-infrared spectroscopy has the potential to be developed into a diagnostic and prognostic test for periodontitis. They used a modified Beer-Lambert model to determine the relative contribution of deoxy Hb, oxy Hb, and to the overall spectrum. Multispectral imaging studies of gingival inflammation carried out at the absorption crossovers observed between oxy Hb and deoxy Hb (at 615 and 460 nm) by Zakian et al.19 using the DR image intensity ratio R615/R460 have demonstrated that this ratio can be used for detection and monitoring of periodontal disease. The advantage of using a ratio technique is that it is simpler and can be used to quantify and map the erythema spatial distribution in the whole periodontal region. This gives the physician an opportunity to get an idea of the disease’s spread and its severity in the gingiva instantaneously and supports its application as a complimentary diagnostic tool in clinical environments. In this clinical study, we record the in vivo DR spectra of white-light illuminated gingiva with a fiber-optic point-monitoring probe connected to a miniature spectrometer. The change in concentration of oxy Hb with inflammation was utilized for disease classification. Different DR spectral intensity ratios such as R615/R460, R620/R545, and R620/R575 were compared with the gold standard to find their suitability to discriminate periodontitis and gingivitis from healthy gingiva, and the results are statistically analyzed and presented. 2.Materials and Methods2.1.Clinical ProtocolThe study population consisted of 30 volunteers with healthy gingiva, 37 patients with gingivitis, and 23 patients with periodontitis. The study protocol was approved by the Institutional Ethical Committee of Government Dental College (GDC), Thiruvananthapuram (Approval No. IEC/C/42-A/2011/DCT/dated 18-01-2011). The study was carried out at the outpatient clinic of GDC and informed, written consent was obtained from each participant prior to enrollment. A diagram showing participant flow is given in Fig. 1. Patient recruitment and recording of clinical parameters were done by a periodontist. Healthy sites were defined as those with pocket depth and no bleeding on probing (BOP), and gingivitis sites were those with and BOP. Periodontitis sites were those with severe involvement having , clinical attachment loss , and a gingival index (GI) (Loe and Silness) score of 2.1 to 3.0, which indicates severe inflammation, making these sites clinically distinct. Intraoral periapical (IOPA) radiographs were also taken to confirm alveolar bone loss as bone loss can occur as a result of the extension of inflammation from gingiva to underlying tissues. Healthy volunteers included in the study were in the age group of 20 to 35 years and maintained good oral hygiene. Patients between 30 and 65 years of age with gingivitis and periodontitis were categorized based on the classification by the American Academy of Periodontology. This study was conducted during March and April, 2011. Exclusion criteria followed were:
Stringent selection criteria were followed throughout this study to overcome the limitations of conventional diagnosis methods. Healthy sites used in this study for comparison were from completely healthy volunteers, and healthy sites of patients were not considered. The gingivitis sites in severe periodontitis patients were omitted as well. Severe periodontitis sites were only taken for obtaining periodontitis spectra so as to reduce overlap, and DR measurements were taken from papillary gingiva since periodontal breakdown is known to begin from the col, which is nonkeratinized. Measurement of reflectance spectra was always performed before clinical assessment of disease stage as clinical examinations may disturb the sites, causing bleeding and thereby interfering with the DR measurements. A convenience sampling method was used with a sampling size of at least 50 in each group so that Gaussian assumptions can be satisfied during the statistical analysis. 2.2.InstrumentationA schematic representation of the portable DR spectroscopic system (DRSS) used in this clinical study is shown in Fig. 2, with the cross-sectional view of the probe tip given as inset. A tungsten halogen lamp (model LS1-LL, Ocean Optics, Dundlin, Florida) was used as the white-light source to illuminate the gingival tissue through the 200-µm-diameter fiber of a specially designed stainless steel hand piece with a diameter of 1 mm at its tip. The scattered light from the tissue was collected using another fiber of 400 µm diameter positioned at a distance of 260 µm from the illumination fiber. The DR light emanating from the fiber tip was coupled to the entrance slit of a miniature fiber-optic spectrometer (model USB 2000 FL VIS-NIR, Ocean Optics, Dunedin, Florida), which was connected to the USB port of a laptop computer. This spectrometer was fitted with a 500-nm blazed, 600-lines/mm grating and a 2048-element linear silicon CCD array for recording of spectra in the 360 to 1000 nm wavelength range with 7 nm resolution. In order to maximize the collection of scattered light from tissue, a black PVC sleeve was inserted at the probe tip, which maintained an optimum distance between the tissue and probe tip. This black sleeve also prevented the room light from entering into the detection system and, being disposable, provided extra hygiene. Furthermore, the small footprint of the probe tip helped in identification of the different levels of erythema and location of the diseased area with precision. 2.3.Data AcquisitionAfter placing the PVC sleeve of the probe tip in contact with the gingiva, the DR spectra were recorded using the OOI Base32 software of Ocean Optics, Inc., configured to record the spectra, averaged for 40 scans, with a boxcar width of 10 nm and an integration time of 100 ms. DR spectral data were categorized as normal/healthy (recorded from 70 sites in healthy volunteers), gingivitis (from 63 sites in patients), and periodontitis (from 58 sites in patients). Fifteen sets of spectral measurements were taken from each site, and the mean spectral data was used for analysis. The hand piece was sterilized everyday and before use on a new patient. 2.4.Spectral Data AnalysisIn order to determine the extent of periodontal destruction in each patient, PD, CAL, and GI were measured and calibrated by a trained examiner across the study population. The DR spectra of gingival sites were normalized to the peak intensity at 620 nm in order to identify spectral regions of maximum variance during tissue transformation. Intensity ratios from spectral regions of interest (SROI) thus identified were compared with the periodontal parameters to determine the diagnostic accuracies for discrimination of gingivitis and periodontitis from healthy gingiva. ANOVA was performed using Origin 7 software to comprehend whether the means of DR spectral intensity ratios show significant differences between the groups. 3.Results3.1.Spectral FeaturesThe averaged DR spectrum in the 400 to 750 nm region normalized to the maximum intensity at 620 nm (Fig. 3) shows marked differences between healthy/normal, gingivitis, and periodontitis sites. The oxygenated hemoglobin absorption dips at 545 and 575 nm are prominent in the DR spectra of periodontitis and not in the spectra of healthy gingiva. The ratio values of R620/R575, R620/R545, and R615/R460 show an increasing trend from healthy to periodontitis (Table 1). Fig. 3Averaged normalized DR intensity spectra of healthy, gingivitis, and periodontitis tissues. Error bar gives the standard deviation of spectral intensities at 545 and 575 nm. Each spectrum is the average of healthy, gingivitis, and periodontitis sites. 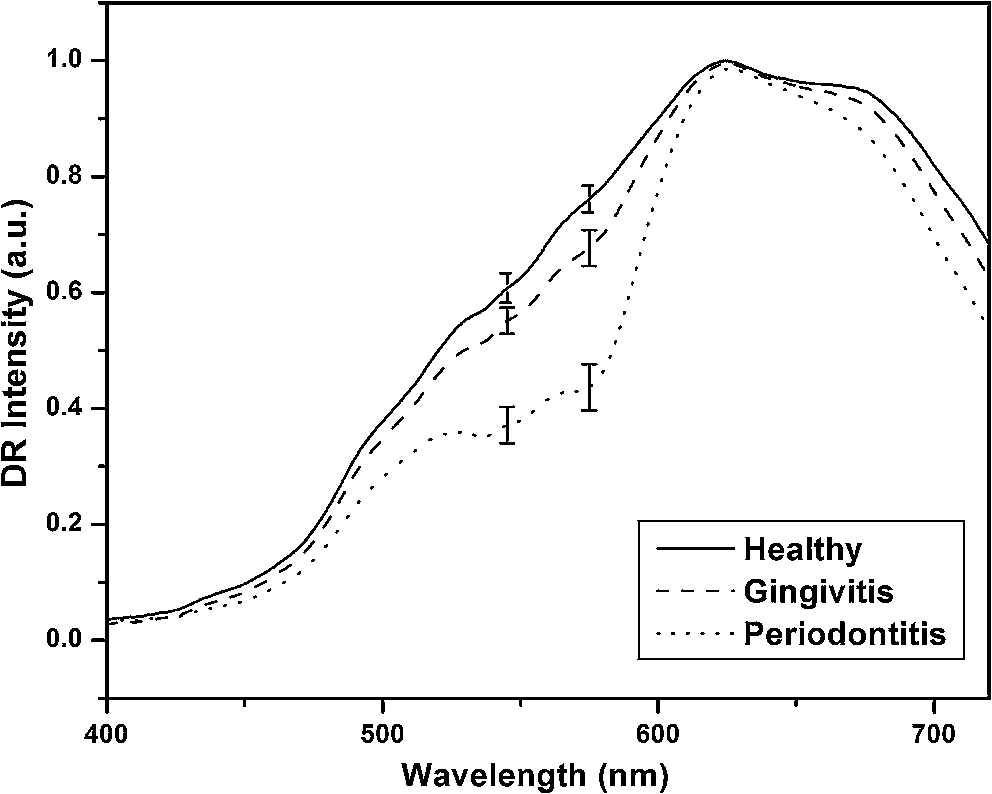 Table 1Averaged DR intensity ratios (R620/R575, R620/R545, and R615/R460) for different grades of gingival inflammation.
3.2.Scatterplot AnalysisMarked differences observed in the normalized spectra between diseased and normal tissues are mainly associated with oxygenated hemoglobin absorption. The DR intensity ratios with respect to the intensity maximum at 620 nm and the intensity at 575 nm (R620/R575) were calculated, and the scatterplot is given in Fig. 4. Similarly the scatterplot of the ratio R620/R545 is given in Fig. 5. The absorption coefficient crossovers of oxygenated hemoglobin and deoxygenated hemoglobin (isobestic points) at 460 and 615 nm, where the absorption is invariant to changes in the ratio of two chromophores, were employed to discriminate the diseased and healthy gingival tissues. The scatterplot for the DR ratio R615/R460 is not shown. The cutoff lines are drawn in the scatterplot diagrams at the mean value of the data points of the two classifying groups. The cutoff lines drawn at 1.378 and 1.850 in the scatterplot of R620/R575 (Fig. 4) discriminate the tissue groups healthy-gingivitis and gingivitis-periodontitis, respectively, whereas the cutoff lines at 1.727 and 2.302, respectively, discriminate the same groups in the scatterplot of the R620/R545 ratio (Fig. 5). The sensitivity and specificity obtained from the scatter plots for the three ratios R620/R575, R620/R545, and R615/R460 are given in Table 2. Fig. 4Scatterplot of DR spectral intensity ratio R620/R575; (a) gingivitis-periodontitis (G–P) and (b) healthy-gingivitis (H–G). 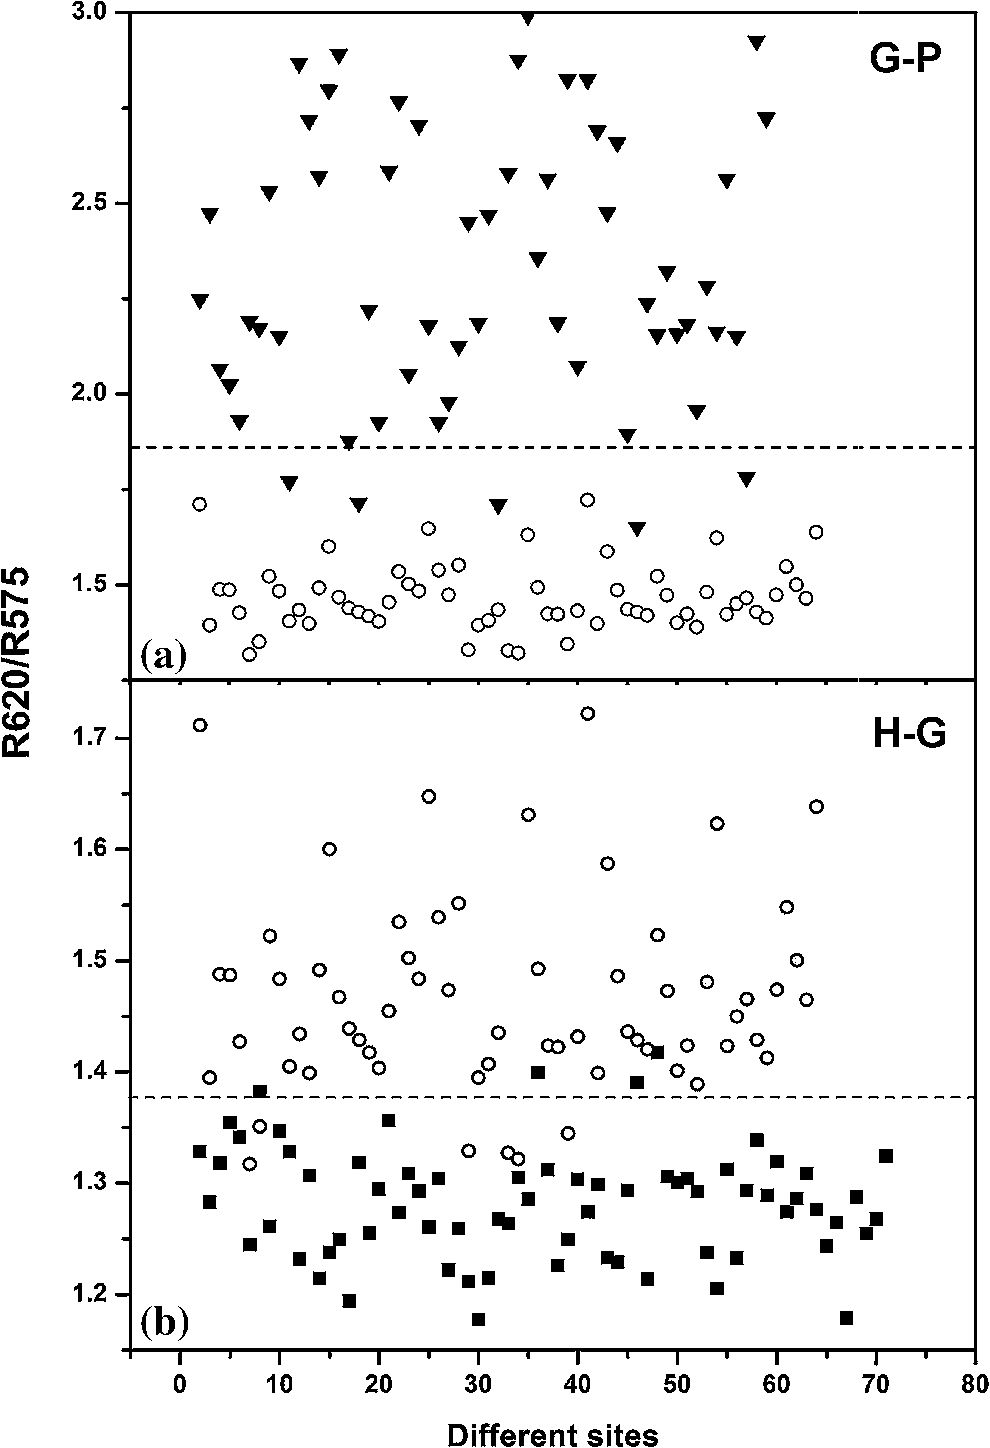 Fig. 5Scatterplot of DR spectral intensity ratio R620/R545; (a) gingivitis-periodontitis (G–P) and (b) healthy-gingivitis (H–G).  Table 2Diagnostic accuracies (sensitivity and specificity) obtained from the scatterplot of intensity ratios R620/R575, R620/R545, and R615/R460.
Sensitivity (Se)=TP/(TP+FN); Specificity (Sp)=TN/(TN+FP) In Fig. 4(b), 6 out of the 63 gingivitis cases were misclassified as healthy, giving a sensitivity of 90%, and out of 70 healthy cases, 4 cases were misclassified as gingivitis, with a specificity of 94%. Also in Fig. 4(a), 5 periodontitis cases were misclassified as gingivitis, giving a sensitivity of 91%, and no gingivitis cases were misclassified as periodontitis (100% specificity). The scatterplot of the R620/R545 ratio (Fig. 5) shows that out of the 63 cases of gingivitis, 16 were classified as healthy (sensitivity of 75%), and out of 70 healthy cases, 12 were classified as gingivitis (specificity of 83%). In the case of discrimination between gingivitis and periodontitis, 11 out of 58 periodontitis cases were classified as gingivitis, with a sensitivity of 81%, and no gingivitis cases got classified as periodontitis (specificity of 100%). In the case of the R615/R460 ratio (figure not shown) 16 cases of healthy tissues were misclassified as gingivitis, and 23 gingivitis cases were misclassified as healthy, leading to a lower sensitivity of 64% and a specificity of 77%. Using this DR ratio 8 gingivitis cases were misclassified as periodontitis, and 21 periodontitis cases were misclassified as gingivitis, which further reduces the sensitivity to 64% and specificity to 87%. 3.3.Hb Concentration and Oxygen SaturationIn order to test the variation in relative concentrations of Hb, oxy Hb, and apparent , DR spectra were recorded from papillary gingiva in clinically healthy, gingivitis, and periodontitis sites of a few sets of patients. The , Hb, and apparent concentrations in these cases were calculated by the method described by Hanioka et al.18 and are plotted in Figs. 6(a)–6(c). Relative concentrations of Hb and show an increasing trend whereas apparent , signifying oxygen saturation in tissues, shows a decreasing trend with the inflammatory status of tissue. 4.Discussions4.1.Spectral FeaturesThe mean DR spectrum shown in Fig. 3 for periodontitis represents severe periodontitis cases. This spectrum shows prominent dips at 545 and 575 nm due to the increased oxygenated hemoglobin absorption in periodontitis tissues as compared to gingivitis and healthy/normal tissues. This could be attributed to changes in functional parameters, such as blood concentration, oxygenation, and blood flow, during disease progression. Previous studies have shown that blood concentration and blood flow in gingiva increase and tissue oxygen saturation reduces during gingival inflammation.8,9 In a study of hemoglobin concentration and oxygen saturation of clinically healthy and inflamed gingiva in humans, Hanioka et al.18 reported an increase in Hb concentration, concentration, and deoxy Hb concentration and a decrease in apparent (Table 3). The increase of Hb concentration in inflamed gingiva shown in Fig. 6(a) mainly reflects increased blood volume in tissues, resulting from the opening of nonfunctioning vessels and formation of new vascular parts with gingival inflammation.20 The increase in oxy Hb concentration shown in Fig. 6(b) suggests that the oxygen supply to inflamed gingiva increases in order to meet metabolic demand, and the decrease in apparent shown in Fig. 6(c) reflects tissue hypoxia.18 However, Zili et al.21 reported a decrease in concentration of oxy Hb with increase in inflammation. In the earlier studies conducted by Liu et al.13 it was reported that oxy Hb concentration increases in gingivitis sites as compared to healthy tissue and decreases in periodontitis sites. This discrepancy can be observed in the case of total hemoglobin concentration as well. This could have been due to the recording of healthy spectra from apparently healthy sites contralateral, or nearest to contralateral, of the diseased site (probably leading to lack of independence of multiple sites within the same patient) and using probe tips of larger diameter. Table 3Contradictory clinical and spectral impressions from DR measurements along with the site-specific clinical parameters of patients.
The healthy site in a periodontitis patient has a different cytokine profile with respect to healthy sites in healthy volunteers. Since inflammation is known to start from the papillary region, where interdental col is nonkeratinized and more susceptible to periodontal breakdown, our measurements were taken from the papillary gingiva. The DR spectra of healthy sites show comparatively smaller absorption dips due to oxygenated and deoxygenated hemoglobin and also differ from other anatomical sites of the oral cavity. Hanioka et al.18 reported a variance in the Hb index between gingiva and alveolar mucosa in healthy subjects. In our study, the DR spectrum of healthy volunteers showed minimal absorption due to oxygenated hemoglobin. Moreover, with our small-diameter (1-mm) probe tip we were able to record the spectrum precisely from regions of erythema. In another study, it was shown that gingival tissues in the healthy population, like interdental papilla and gingiva, have higher oxygenation content but lower total hemoglobin concentration than alveolar mucosa.8,22 In a longitudinal study with dogs, Baab and Oberg23 reported that gingival blood flow increases slightly with inflammation, but significant decrease on resolution of inflammation was not noticed. During a cross-sectional study on humans, Kervonbundit et al.8 reported considerably larger blood flow for cases with moderate gingivitis than for healthy cases. Liu et al.13 demonstrated that a near-IR optical spectroscopy system can be used to acquire spectra from periodontal tissues, and the data extracted was found to provide detailed, site-specific information on multiple aspects of periodontal inflammation. Both Liu et al. and Hanioka et al.13,18 found that tissue oxygen saturation was significantly decreased in both gingivitis and periodontitis sites as compared to control sites. These studies correlate well with our findings (Table 3). The capability of spectroscopy to identify early signs of inflammation leading to tissue breakdown is well understood.24 In a few clinically healthy sites, spectral changes and variations towards the diseased nature were noticed. This could possibly be due to the presence of subclinical inflammation present in clinically healthy sites. DR spectroscopy has the ability to detect erythema noninvasively when gingivitis is present in any part of the gingiva. The results obtained in this study show the capability of DR ratios to detect underlying inflammation even in the case of severe periodontitis patients having plaque-induced inflammation. 4.2.Tissue ClassificationIn this study it was possible to distinguish healthy gingiva, gingivitis, and periodontitis, based on their position in the scatterplot, by correlating with the clinical diagnosis based on the probing PD, CAL, and GI score (Figs. 4 and 5). Analysis of DR intensity ratio R615/R460 using the scatterplot diagram have shown a sensitivity of 64% and specificity of 77% for discriminating healthy tissues from gingivitis, whereas for distinguishing gingivitis from periodontitis a sensitivity of 64% and specificity of 87% was observed. Recently, Zakian et al.19 carried out spectral imaging of gingival inflammation at 615 and 460 nm wavelengths, which represent the spectral absorption crossovers between oxygenated and deoxygenated hemoglobin, and used the spectral reflectance image ratio R615/R460 to demarcate regions of inflammation. The diseased subjects in their study were healthy volunteers who were induced gingivitis by cessation of oral hygiene for two weeks. ANOVA shows a significance level with -value while comparing the means of the R620/R575 and R620/R545 ratios for discrimination between healthy and gingival cases, and healthy and periodontitis cases, as compared to the significance level of obtained for the R615/R460 ratio (Table 1). Spectral analysis using the scatterplot ratio R620/R545 (Fig. 5) has shown a sensitivity of 75% and specificity of 83% for the discrimination of healthy tissues from gingivitis and a sensitivity of 81% and specificity of 100% for the discrimination between gingivitis and periodontitis. In comparison, the R620/R575 ratio (Fig. 4) has shown an improved sensitivity of 90% and specificity of 94% for discrimination between healthy and gingivitis tissues and a sensitivity of 91% and a specificity of 100% for discrimination between gingivitis and periodontitis tissues. The increase in sensitivity and selectivity observed in this study can be attributed to the stringent selection criteria followed, in particular the use of a healthy volunteer data set for comparison with inflamed tissues. However, the levels of various mediators of inflammation present in apparently healthy sites of diseased individuals could possibly differ from healthy volunteer sites. For the same reason, gingivitis cases localized in cases of generalized periodontitis and vice versa were omitted. This was also required in order to avoid misclassification. The study results show that the extent of underlying inflammation that may not be visible clinically could be detected using DR spectroscopy, leading to discrimination of gingivitis from periodontitis with higher sensitivity and specificity. Moreover, in comparison with the probe tip diameters of 2 mm and 5.18 mm used, respectively by Hanioka and Liu,13,18 our probe tip was of 1 mm in diameter, which to a large extent eliminated any chance of diseased sites overlapping with healthy sites (Table 3). Sometimes erythema affects very small areas, and sites even a few millimeters away could also show a completely different level of erythema. Therefore, with our smaller diameter probe tip we were able to locate the diseased area more accurately as compared to earlier reports. Currently, the diagnosis of periodontitis is primarily based on clinical observations, radiographs, and microbiological findings that are considered to complement each other; together, they help to define the extent and severity of periodontitis. Periodontitis being a multifactorial disease, its manifestation and progression are also influenced by a variety of other risk factors, such as genetic, systemic, social, and behavioral factors. After clinical observation to determine GI based on visual perception of tissue color, the most widely used mode of periodontal examination is periodontal probing that helps to determine critical clinical parameters, such as BOP, PD, and CAL, of periodontal tissue. Nevertheless, there are some unavoidable limitations due to the difficulty in precisely duplicating the insertion force, probe placement, and angulation. Further, the extent of the probe penetration is influenced by the inflammatory status of the tissue. When healthy tissues are examined, the probe tip stops coronally at the apical termination of the junctional epithelium, but at inflamed sites the probe tip usually passes apically to this point. In such cases, inflammation affects the measurement of probing depth in a manner unrelated to the attachment level. Besides, the poor reliability and reproducibility associated with measuring CAL to monitor the progression of periodontal destruction and to evaluate the effect of periodontal treatment limit the practical value of periodontal probing. Table 4 shows specific cases wherein the spectral impression obtained using DR has failed to correlate with standard clinical procedures followed in this study. Therefore, the deviation of spectral impression from clinical parameters could be attributed to the drawback of this conventional diagnostic method. It may also be pointed out that these methods do not have sufficient reliably to identify susceptible individuals or distinguish between disease-active and -inactive sites. Table 4Comparison of study criteria, materials, and DR spectral characteristics.
5.ConclusionIn this study we have demonstrated the applicability of spectral intensity ratio R620/R575 for the quantification and discrimination of disease (gingivitis and periodontitis) from healthy cases by recording the DR spectra from papillary gingiva. An individual’s risk for periodontal disease could be linked to gingival inflammation in response to plaque accumulation. The immune-inflammatory response that develops in the gingival and periodontal tissues in response to the chronic presence of plaque bacteria results in the destruction of structural components of the periodontium, leading to clinical signs of periodontitis. Therefore, by measuring the erythema it is possible to evaluate the presence of plaque accumulation in subgingival pockets.25 Earlier studies demonstrated that DR spectroscopy can be utilized to discern the properties of light absorbed by skin chromophores and help diagnose the degree of erythema. It has been found that cutaneous erythema correlates well with the relative concentration of oxygenated hemoglobin.26 Even though these findings were reported for the skin, gingival tissue has a similar structure. The external layer is the epithelium, and there is an underlying layer and connective tissue where most of the microvasculature is embedded.27 Although Hanioka et al.,18 Zakian et al.,19 and Liu et al.13 have carried out studies to diagnose periodontitis and gingivitis using DR spectroscopic techniques, this is the first report on the use of DR intensity ratios involving the oxygenated hemoglobin absorption peaks for discrimination between healthy and diseased gingiva. Our findings demonstrate the feasibility of using DR spectroscopy for quantitatively classifying and distinguishing healthy gingiva from diseased gingiva in a clinical environment from the spectral ratio R620/R575. The study results show that the exact extent of underlying inflammation, which may not be clinically visible, could be detected using DR spectral features. We believe that these investigations could pave the way for development of noninvasive methods for periodontal disease screening and monitoring. Further measurements are envisaged using multispectral imaging in a larger population to explore the applicability of ratio technique for noninvasive screening of periodontitis and to improve the diagnostic accuracies for discrimination of gingival inflammation. Longitudinal studies are needed to prove the usefulness of this proposed technique for prediction of disease risk and future disease progression in periodontitis. AcknowledgmentsAll the authors are thankful to the Ethics Committee of GDC, Trivandrum, for their valuable suggestions and to the patients and volunteers who took part in this clinical study. One of the authors (CSP) is thankful to the Director of CESS for his research fellowship. This work forms part of an Indo-Bulgarian project of the Department of Science & Technology, Governmentt of India, and is partially funded under the CESS Plan-260 project. ReferencesL. J. BrownH. Loe,
“Prevalence, extent, severity and progression of periodontal disease,”
Periodontol. 2000, 2 57
–71
(1993). http://dx.doi.org/10.1111/j.1600-0757.1993.tb00220.x Google Scholar
G. C. Armitage,
“Clinical evaluation of periodontal diseases,”
Periodontol. 2000, 7 39
–53
(1995). http://dx.doi.org/10.1111/j.1600-0757.1995.tb00035.x Google Scholar
Y. H. Chunet al.,
“Biological foundation of periodontitis as a potential risk factor for atherosclerosis,”
J. Perio. Res., 40 87
–95
(2005). http://dx.doi.org/10.1111/j.1600-0765.2004.00771.x JPDRAY 0022-3484 Google Scholar
Y. T. TangG. W. TaylorF. Scannapieco,
“Periodontal health and systemic disorders,”
J. Can. Dent. Assoc., 68 188
–192
(2002). JCDAAS 0008-3372 Google Scholar
N. M. MoutsopoulosP. N. Madianos,
“Low grade inflammation in chronic infectious diseases paradigm of periodontal infections,”
Ann NY Acad Sci., 1088 251
–264
(2006). http://dx.doi.org/doi: 10.1196/annals.1366.032 Google Scholar
D. M. AeppliJ. R. BoenC. L. Bandt,
“Measuring and interpreting increases in probing depth and attachment loss,”
J. Periodontol., 56
(5), 262
–264
(1985). JOPRAJ 0022-3492 Google Scholar
G. Greenstein,
“Commentary on periodontal diagnostic testing,”
J. Periodontol., 66 531
–535
(1995). JOPRAJ 0022-3492 Google Scholar
V. Kerdvongbunditet al.,
“Blood flow and human periodontal status,”
Odontology, 90 52
–56
(2002). http://dx.doi.org/10.1007/s102660200008 Google Scholar
V. Kerdvongbunditet al.,
“Microcirculation and micromorphology of healthy and inflamed gingivae,”
Odontology, 91
(1), 19
–25
(2003). http://dx.doi.org/10.1007/s10266-003-0024-z Google Scholar
T. Haniokaet al.,
“Haemoglobin concentration and oxygen saturation in dog gingiva with experimentally induced periodontitis,”
Arch. Oral Bio., 34 657
–663
(1989). http://dx.doi.org/10.1016/0003-9969(89)90021-6 AOBIAR 0003-9969 Google Scholar
T. HaniokaS. ShizukuishiA. Tsunemitsu,
“Changes in hemoglobin concentration and oxygen saturation in human gingiva with decreasing inflammation,”
J. Periodontol., 62
(6), 366
–369
(1991). JCCBDT 0340-076X Google Scholar
S. Prahl,
“Optical absorption of hemoglobin data compilation,”
(1999) http://omlc.ogi.edu/spectra/hemoglobin/index.html Google Scholar
K. Z. Liuet al.,
“In vivo determination of multiple indices of periodontal inflammation by optical spectroscopy,”
J. Perio. Res., 44 117
–124
(2009). http://dx.doi.org/10.1111/j.1600-0765.2008.01112.x JPDRAY 0022-3484 Google Scholar
N. Subhashet al.,
“Oral cancer detection using diffuse reflectance spectral ratio R540/R575 of oxygenated hemoglobin bands,”
J. Biomed. Opt., 11 014018 1
–014018 6
(2006). http://dx.doi.org/10.1117/1.2165184 JBOPFO 1083-3668 Google Scholar
R. J. Malliaet al.,
“Oxygenated hemoglobin diffuse reflectance ratio for invivo detection of oral pre-cancer,”
J. Biomed. Opt., 13 041306 1
–10
(2008). http://dx.doi.org/10.1117/1.2952007 JBOPFO 1083-3668 Google Scholar
R. J. Malliaet al.,
“Diffuse reflection spectroscopy: an alternative to autofluorescence spectroscopy in tongue cancer detection,”
App. Spectrosc., 64 409
–418
(2010). http://dx.doi.org/10.1366/000370210791114347 APSPA4 0003-7028 Google Scholar
J. L. Jayanthiet al.,
“Diffuse reflectance spectroscopy: diagnostic accuracy of a non-invasive screening technique for early detection of malignant changes in the oral cavity,”
BMJ Open, 1
(e000071), 1
–7
(2011). http://dx.doi.org/10.1136/bmjopen-2011-000071 Google Scholar
T. HaniokaS. ShizukuishiA. Tsunemitsu,
“Haemoglobin concentration and oxygen saturation of clinically healthy and inflamed gingiva in human subjects,”
J. Periodont. Res., 25 93
–98
(1990). http://dx.doi.org/10.1111/j.1600-0765.1990.tb00898.x JPDRAY 0022-3484 Google Scholar
C. Zakianet al.,
“Invivo quantification of gingival inflammation using spectral imaging,”
J. Biomed. Opt., 13 054045 1
–054045 9
(2008). http://dx.doi.org/10.1117/1.2982536 JBOPFO 1083-3668 Google Scholar
J. Egelberg,
“The blood vessels of the dento-gingival junction,”
J. Perio. Res., 1 163
–179
(1966). http://dx.doi.org/10.1111/j.1600-0765.1966.tb01857.x JPDRAY 0022-3484 Google Scholar
G. Ziliet al.,
“Assessment of local hemodynamics in periodontal inflammation using optical spectroscopy,”
J. Periodontol., 82 1161
–1168
(2011). JOPRAJ 0022-3492 Google Scholar
D. A. BaabP. A. ObergG. A. Holloway,
“Gingival blood flow measured with a laser Doppler flow meter,”
J. Perio. Res., 21 73
–85
(1986). http://dx.doi.org/10.1111/j.1600-0765.1986.tb01440.x JPDRAY 0022-3484 Google Scholar
D. A. BaabP. A. Oberg,
“Laser Doppler measurement of gingival blood flow in dogs with increasing and decreasing inflammation,”
Arch. Oral Biol., 32 551
–555
(1987). http://dx.doi.org/10.1016/0003-9969(87)90063-X AOBIAR 0003-9969 Google Scholar
X. Xianget al.,
“An update on novel non-invasive approaches for periodontal diagnosis,”
J. Perio., 81 186
–198
(2010). http://dx.doi.org/10.1902/jop.2009.090419 JOPRAJ 0022-3492 Google Scholar
B. L. PihlstromB. S. MichalowiczN. W. Johnson,
“Periodontal disease,”
Lancet, 366 1809
–1820
(2005). http://dx.doi.org/10.1016/S0140-6736(05)67728-8 LANCAO 0140-6736 Google Scholar
N. Kolliaset al.,
“A single parameter, oxygenated hemoglobin, can be used to quantify experimental irritant-induced inflammation,”
J. Invest. Dermatol., 104 421
–424
(1995). http://dx.doi.org/10.1111/1523-1747.ep12666001 JIDEAE 0022-202X Google Scholar
A. Nanci, Ten Cate’s Oral Histology: Development, Structure, and Function, 6th ed.Mosby, Missouri
(2003). Google Scholar
|
|||||||||||||||||||||||||||||||||||||||||||||||||||||||||||||||||||||||||||||||||||||||||||||||||||||||||||||||||||||||||||||||||||||||||||||||||||||||||||||||||||||||||||||||||