|
|
1.IntroductionVital tooth bleaching has been accepted as a conservative and effective treatment for discolored teeth since Haywood et al. first introduced the nightguard vital bleaching technique (NGVB) in 1989.1 Currently, three fundamental approaches, at-home bleaching, in-office bleaching, and over-the-counter (OTC) bleaching,1,2 are available in clinical application. However, at-home bleaching, in which discolored teeth are in contact with low levels of peroxide-based agents via custom-fabricated mouth guards overnight, is still the most popular technique recommended by dentists.3–5 Despite the excellent whitening efficacy of home bleaching, concern still remains about the safety of this technique, especially the potential adverse effect of the bleaching agent on the enamel structure. Some studies have reported changes in chemical composition,6,7 alteration of surface morphology,8,9 decrease of hardness,10,11 and reduction of fracture toughness (FT)10,12 in bleached enamel. In contrast, other studies found little alteration in bleached enamel.13–16 These inconsistent results are probably related to the designs of different studies. Most of the studies concerning home bleaching used in vitro models, which could partially interpret the bleaching effects. However, they still had some limitations, such as the absence of natural saliva and acquired pellicle. These in vitro limitations didn’t reflect real clinical situations.17,18 For this reason, it is essential to use in vivo or in situ models to evaluate the effects of bleaching agents in a more realistic oral environment. Besides a proper study model, different analytical techniques may lead to different conclusions even if the same study protocol is used. In one of our previous studies, we used transmission Fourier transform infrared (FTIR) and attenuated total reflection infrared (ATR-IR) spectroscopy to investigate the effects of bleaching solution on the structure of human dentin.19 It was interesting to note that ATR-IR exceeded traditional FTIR in detecting mineral variations in dentin after bleaching treatments. That might be due to the different measuring methods of these two techniques. ATR-IR spectroscopy permits repeated analyses of the specimen surface in the same place, thus ensuring high comparability between spectra before and after treatment.19,20 In contrast, for conventional FTIR, the sample needs to be scraped off and ground into fine powder. The small surface changes may have been masked by the less-affected subsurface region.19 Similar to ATR-IR, Raman spectroscopy has also been demonstrated to be a very sensitive tool to study the changes of enamel composition noninvasively. Both of these vibration spectroscopic techniques have the ability to analyze chemical composition at a molecular level.21 Furthermore, laser-induced fluorescence (LIF), which was usually regarded as the interference of Raman scattering, can be measured by the Raman spectrometer and may provide important information for dental assessment.20,22,23 Usually, the alteration of the chemical composition of enamel is accompanied by changes in surface morphology and mechanical properties. Therefore, techniques in these fields are also valuable since they could not only corroborate the results obtained by the vibration spectroscopy techniques but also could provide complementary information. For instance, atomic force microscopy (AFM) could conduct a noninvasive three-dimensional analysis of structure morphology and roughness of the surface at nanoscale. Microhardness and FT measurements have both physical significance and clinical relevance. The purpose of the present study was to investigate the effects of three differently concentrated at-home bleaching agents on enamel in situ. Raman, ATR-IR, AFM, microhardness, and FT measurements were conducted as complementary techniques to determine the possible variations of structure and mechanical properties in enamel. 2.Materials and Methods2.1.Ethical Aspects and VolunteersThe protocol for this study was reviewed and approved by the Ethics Committee of the School and Hospital of Stomatology, Wuhan University, China. Five undergraduate dental students (three males and two females, from 20 to 22 years old), who fulfilled the inclusion criteria (absence of dental caries and/or periodontal disease, normal saliva flow, and willingness to perform bleaching treatment on the research schedule) without violating the exclusion criteria (restorations and prostheses in the mouth, use of orthodontic appliances, dentin sensitivity, and smoking), were enrolled in the study after signing an informed consent form as volunteers. 2.2.Tooth SelectionA total of 30 freshly extracted orthodontic premolars were obtained. All were examined under magnification to detect enamel cracks or fractures, caries, stains, and other defects. The teeth were cleaned thoroughly and stored in 0.2% thymol solution at 4°C until use. 2.3.Materials PreparationThe roots of stored teeth were separated from their crowns at the cemento-enamel junction using a low-speed diamond saw (Isomet, Buehler Ltd., Lake Bluff, IL) under water cooling. Two dental slabs () were obtained from the middle third of the buccal surface of each tooth and subjected to steam sterilization. Each dental slab was fixed in a polyvinyl chloride (PVC) matrix with colorless translucent acrylic resin matrix, keeping the enamel surface unsealed for bleaching treatments. To ensure the precision of all measurements, unsealed surfaces for the enamel specimens were prepared so they were uniform, flat, and clean. The specimens were serially polished with 600-, 1,000-, 1,500-, and 2,000-silicon carbide (SiC) abrasive papers and with 1-μm and 0.5-μm diamond polishing suspensions on cloths under constant water irrigation. Finally, all specimens were immersed in distilled water (DW) and then ultrasonicated for five minutes to remove residual particles and the smear layer. The three at-home bleaching agents used in the current study were Opalescence PF 10% carbamide peroxide (CP), Opalescence PF 15% CP, and Opalescence PF 20% CP (Ultradent Products, South Jordan, UT). The pH value of each bleaching agent was measured with a digital pH electrode (EASYFERM Plus 225, Switzerland) in triplicate (Table 1). Table 1At-home bleaching agents used in the current study.
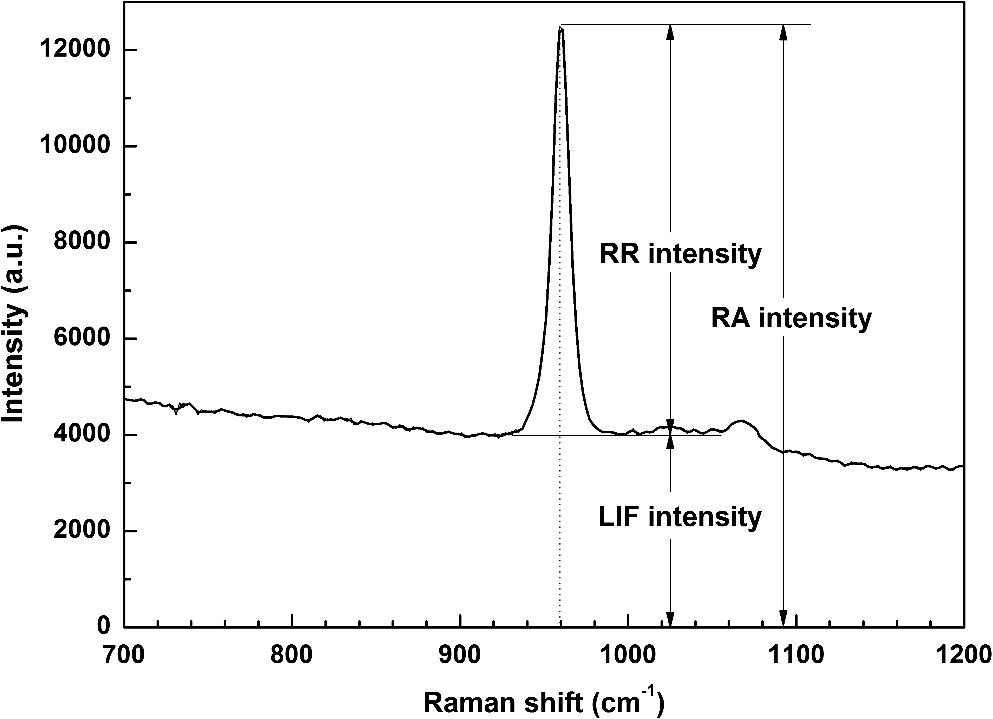
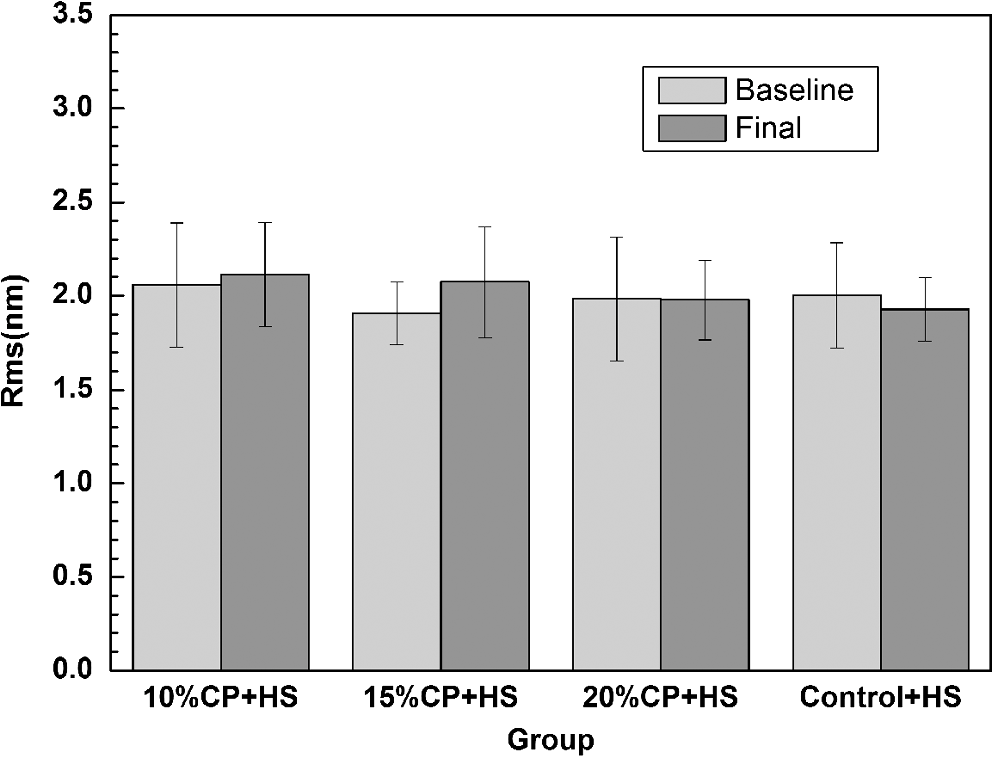
For each volunteer, a full-arch maxillary impression was obtained and a stone cast mold was made based on the impression. A 0.035-inch thick soft bleaching tray (Soft-Tray Sheets, Ultradent Products Inc., South Jordan, UT) was fabricated on the cast using a vacuum tray-forming machine (Ultraform, Ultradent Products Inc., South Jordan, UT) and then modified with a palatal extension. 2.4.Baseline Measurements2.4.1.Raman spectroscopy detectionThree marks for each specimen were made on the acrylic resin matrix for the location of Raman detection. Baseline Raman scattering/fluorescence spectra were recorded by a micro-Raman spectrometer (-Raman Portable Raman Spectrometer, B&W Tek Inc., Newark, DE) equipped with a semiconductor laser diode at a 785-nm wavelength. A focused laser spot of approximately 95 µm in size through a fiber-optic based system was shone on the surfaces of the enamel. Each spectrum was made an average of five times in the following conditions: range, 7000 ms integration time, and room temperature. Spectral data were visualized on a computer and processed using BWSpec 3.26 spectroscopic software (B&W Tek). Raman absolute (RA) intensity, Raman relative (RR) intensity, and LIF intensity at were defined and calculated from the Raman spectra (Fig. 1) according to a previous investigation.22 RA intensity is the intensity of the Raman peak at before the spectrum is baselined, and RR intensity is the intensity of the same peak after the spectrum baselined between 990 and . The LIF intensity is equal to RA intensity minus RR intensity. 2.4.2.ATR-IR spectroscopy detectionBaseline ATR-IR spectra were acquired with a Thermo Nicolet 5700 spectrometer (Nicolet, Madison, WI) and a smart OMNI-specimen accessory with diamond as an internal reflection element. For each sample, one mark was made in the middle of an acrylic resin surface, which was opposite the polished enamel, by means of a high-speed handpiece with a fine bur. The specimens were then put onto the face of the diamond crystal of the smart OMNI-specimen accessory with the marks side up. They were carefully adjusted so that the pointed tip of the standard pressure tower would be pressed onto the center of the mark. This procedure made sure that the specimens were measured at the same place at the different points in time. Spectra were acquired in the range from 675 to at resolution, with 128 scans co-added. Each specimen was measured in triplicate at each time point. 2.4.3.AFM detectionA total of 10 specimens from each group were selected for surface morphology and surface roughness detection with Shimadzu SPM-9500J3 (Shimadzu Corp., Japan) using a contact mode. Fields of view at scan size were obtained, and for each image, root mean square (rms) roughness was determined by SPM-Offline 2.30 (Shimadzu Corp.). 2.4.4.Microhardness measurementVickers indentation microhardness baseline values were performed using a microhardness tester (HXD-1000TMC/LCD, Taiming, Inc., Shanghai, China). Three indentations were made on each specimen with 100 g for 15 sec. The surface area of flattened enamel was sufficient for each indentation without interfering with each other (Fig. 2). 2.4.5.Fracture toughness measurementVickers indentations with a load of 9.8 N were performed to assess baseline FT values (Fig. 2).24 The diagonal length and crack length were recorded with the light microscope of the microhardness tester at a 400-fold magnification within 5 secafter the mechanical test. For each indentation, a circle enclosing all associated cracks (both edge and side cracks) was drawn. The radius of the circle, developed from the center of the indentation, was taken as the maximum crack length value of the corresponding indentation (Fig. 3). Fig. 3Light micrograph of a Vickers indentation with crack formation on enamel. The circle encloses all the cracks generated during the indentation. The radius of this circle is used as a crack length of measure .  The hardness values of indentations with a load of 9.8 N were determined according to the following expression:25 where: , half the diagonal of the indentation (m), and .The corresponding FT was then computed using the following formula:26 where: , Young’s modulus (GPa), , , and from the center of the indentation impression.The Young’s modulus of human enamel was taken to be 84.1 GPa.27 2.5.Bleaching ProcedureAfter baseline measurements, specimens were divided randomly into four groups, according to the bleaching agents (): group 10% , group 15% , group 20% , and group . Then specimens were removed from the acrylic resin matrix with probes and fixed on the palatal extensions of the modified bleaching trays with a light-curing restorative material (3M ESPE, St. Paul, MN). For each volunteer, 12 specimens were arrayed in three columns: the first, second, and third specimens in each column were used as experimental specimens and the fourth ones referred to the control specimens (Fig. 4). When the bleaching treatment started, all specimens on the modified bleaching trays were washed under DW for 30 sec and dried by compressed air for 5 sec. Then the first, second, and third specimens in each column were painted with 10% CP, 15% CP, and 20% CP, respectively. The fourth ones were not painted, but just kept wet with DW. To simulate the routine nightguard bleaching process, all the trays were placed in a humid atmosphere at 37°C incubator for 8 hours. Subsequently, bleaching agents were removed carefully by a soft toothbrush under running DW and then placed into the oral cavities of the volunteers for 16 hours within the same day. The total cycling sequences were conducted 14 times. 2.6.Final MeasurementsAfter a 14-day treatment, the samples were replaced in the PVC matrix. Raman spectroscopy, ATR-IR spectroscopy, AFM, microhardness, and FT were performed as final measurements. The experimental design was summarized in Fig. 5. Profile data for Raman and ATR-IR spectra were then imported into Origin 7.0 software (Origin-Lab Corporation, Northampton, MA) for analysis. For the Raman results, RR intensity and LIF intensity values were transformed into percentage values where the baseline values were set at 100% and the values that have been changed afterward were calculated as a percentage of the baseline. The quantitative analysis of ATR-IR results was made by measuring the area of the spectra between the selected wavelengths and calculating the carbonate: mineral ratio (the ratio of the integrated areas of carbonate contour to the phosphate , contour). 2.7.Statistical AnalysisStatistical analyses were performed by SPSS 16.0 for Windows with a significance level of 0.05. Parameters in the current study were expressed as means±S.D. Variations for baseline and final values in each group were analyzed by analysis of variance (ANOVA). One-way ANOVA was used for the comparison of data among groups, and post hoc pairwise comparisons were obtained with an additional Tukey analysis. 3.Results3.1.Raman AnalysisThe main features of Raman scattering spectra of enamel showed accordance with previous investigations (Fig. 6).20 The strongest peak at was attributed to . The bands at and were assigned to , 610 and to , and to , respectively. The typical peak at arose from . The LIF of enamel appeared as a featureless background in the Raman spectra. Fig. 6Representative Raman/fluorescence spectra of enamel in different groups. (a) group 10% ; (b) group 15% ; (c) group 20% ; (d) group .  For the percentage of RR intensity, no significant difference was found between the baseline and final values in each group (; see Fig. 6). In addition, one-way ANOVA revealed no significant intergroup differences (). The percentage of LIF intensity declined dramatically in the three bleached groups (), whereas it remained quite stable in the control group (; see Fig. 6). Moreover, one-way ANOVA and Tukey’s multiple comparison tests illustrated that the percentage of LIF intensity in all bleached groups decreased significantly compared to that of (). No significant differences were found among groups with different CP concentrations (). 3.2.ATR-IR AnalysisThe typical feature of ATR-IR spectra of enamel was well consistent with previous studies (Fig. 7).28 The band between 885 and represented , , and the band between 810 and gave information about . Fig. 7Representative ATR-IR spectra of enamel in different groups. (a) group 10% ; (b) group 15% ; (c) group 20% ; (d) group .  It was found that the integrated areas of , , and and the ratio of these two bands altered little in all groups (). Meanwhile, one-way ANOVA illustrated no intergroup significant difference of the ratio (). 3.3.AFM AnalysisThe characteristic AFM images were displayed in Fig. 8. No special alteration was found on the enamel surface in each group. These enamel surfaces appeared relatively flat, with some irregular patterns and shallow grooves resulting from the various polishing treatments. Figure 9 shows rms values before and after the bleaching treatment in each group. No decreasing tendency was found in each group (), and no intergroup significant difference was found among the four groups (). 3.4.Microhardness TestFigure 10 shows the mean and standard deviations for enamel Vickers microhardness at the load of 100 g before and after the bleaching treatment in each group. The comparison between baseline and final values did not reveal a decreasing trend in all groups (). In addition, no significant differences were found among the four groups (). 3.5.FT TestFigure 11 shows the mean and standard deviations for FT before and after the bleaching treatment in each group. The results revealed statistically significant differences between the baseline and final values in group 10%, group 15% , and group 20% (, , and , respectively). No significant difference was found in the control group (). Moreover, Tukey’s multiple comparison tests illustrated that the decrease of FT in group 10% , group 15% , and group 20% were significantly higher than that in group (, , and , respectively), while there was no significant variation among groups with different CP concentrations (). 4.DiscussionDental enamel is the highly brittle and the hardest biological tissue in the human body.29,30 Massive hydroxyapatite crystals compose the main part of enamel, and organic proteins between crystals serve as the framework matrix in a highly controlled fashion.31 Alterations of this exquisite structure during the bleaching process might affect the final bulk property of enamel. The present study showed that no significant change of RR intensity was observed in each group, indicating a rarely changed phosphate group in enamel. Since the concentration of the phosphate group is proportional to the mineral content of enamel,20,32,33 RR intensity values suggested that bleaching treatment induced little enamel demineralization. In accordance with Raman results, ATR-IR spectra displayed no significant discrepancy of the integrated area ratio (, and ) in bleached groups. Moreover, according to the AFM images, surface morphology and surface roughness displayed no apparent alteration after bleaching treatments. These AFM observations at nanoscale coupled with Raman and ATR-IR spectra at the molecular level revealed little change in the mineral content of enamel after bleaching treatments in situ. However, these results were inconsistent with previous studies.6,34–37 It might be due to different pH values and the compositions of bleaching agents, as well as the in situ storage. Different CP bleaching agents were utilized in the present study. Unlike highly concentrated hydrogen peroxide (HP), CP doesn’t need a low pH to stay stable. CP could disassociate into HP and urea during tooth bleaching. HP is the active whitening component, and urea further degrades into ammonia and carbon dioxide. This action could increase the pH, thus reducing the risk that tooth structure would demineralize under low pH.38 In addition, based on several previous findings, the fluoride and potassium nitrate contained in the utilized bleaching agents could also contribute to the stability of the mineral content of enamel.39–41 Apart from bleaching agents, the in situ dynamic interaction of saliva-enamel is also a factor of concern. The presence of natural saliva not only simulated the real oral environment but also provided greater potential for minimizing enamel demineralization than a conventional in vitro model would. It was proved that an in situ formed salivary pellicle would protect the underlying enamel surface against mineral loss to a certain extent.42–44 In addition, bicarbonate and phosphate buffering systems and urea could hinder the decline of pH values, and enough mineral ions in natural saliva could play an important role in the remineralization process.45–48 LIF is one of the most striking features when using Raman scattering to examine enamel. Traditionally, fluorescence was regarded as a nuisance of Raman scattering.20,21,49,50 Nevertheless, with the improvement of knowledge, fluorescence has provided valuable information in many fields. Based on recent studies, LIF could detect carious lesions and dental erosion.51–53 Furthermore, it’s highly possible that the LIF of sound enamel could provide useful information about the organic components of enamel.54 In the field of tooth bleaching, researchers also noticed changes in LIF.20,22,55 As shown in the present study, LIF intensity decreased dramatically in all bleached groups. This result was in accordance with our previous studies20,22 and further proved that the matter, which initiates the occurrence of LIF, changed greatly during the bleaching treatment. Compared with previous studies, the present one fully avoided the variation of inorganic components during bleaching. Therefore, LIF might still provide information about organic components. Although the exact mechanism hasn’t yet been fully resolved, general knowledge of the chemical nature of the bleaching agents could help explain this speculation. All the recently introduced at-home bleaching products contained some form of HP as the active whitening component. The chemistry of this agent is based primarily upon its ability to generate free radicals. Since the radicals lack one electron, they would interact with organic colored molecules in enamel to achieve stability. As the free radical reaction is not specific, other enamel organic matrices would be affected as well. As a result, the changes of these organic materials induced the decrease of LIF intensity. Another interesting finding was the small amount of alteration of microhardness but the significant decline of FT in bleached specimens. It was known that microhardness was related to the loss or gain of mineral in the dental structure,2,56,57 and the explanation about this parameter was similar to the mineral content of enamel discussed in the above sections. FT describes an ability of the material to resist the propagation of an existing crack under a particular state of stress.58 The reduction of FT after treatment illustrated that at-home bleaching made enamel more prone to crack formation. In other words, bleached enamel became more brittle. This phenomenon indicated that some structural changes occurred, at least on the surface layer of enamel, with a bleaching time of 14 days. As mentioned above, the utilized bleaching agents did not cause demineralization in enamel. For this reason, we assumed that the change of FT still might bear a relation to the changes of organic components. Since the organic matrix serves as the “glue” between hydroxyapatite crystals,59 organic matrix oxidation during bleaching might reduce the crack-resistance ability of enamel and then result in the decrease of FT. This assumption was supported by Baldassarri et al.60 and Seghi et al., 12 who found that FT could be influenced significantly by the organic matrix in enamel. It is worth noting that enamel surfaces were polished and flattened for the precision of all measurements in the present study. This procedure probably removed the superficial structure of enamel; namely, aprismatic enamel. However, it is believed that this procedure would not influence the results very much. This is because even if an aprismatic surface enamel layer exists, it would not be able to prevent the penetration of bleaching agents.61 Thus, the present results still have clinical significance for post-bleaching treatments. One limitation of this study was that all the final measurements were conducted directly after the routine 14-day bleaching treatment. It is not clear whether the declined FT or LIF values could recover after the bleaching treatment or whether a prolonged bleaching treatment in situ would induce extra changes in the structure of enamel. Moreover, the exact origin of LIF in enamel is still unclear. For these reasons, further in-depth investigations are needed to understand the enamel structure and the mechanism of tooth bleaching. 5.ConclusionWithin the limitation of the present study, the following conclusions can be drawn: Under in situ conditions, the demineralization effects of three differently concentrated at-home bleaching agents on enamel were minimal. However, the decrease of LIF and FT in enamel seems to be inevitable and needs further investigations. AcknowledgmentsThis work was supported by the Natural Science Foundation of China (No. 81070853, No. 81071190), the Youth Chenguang Project of Science and Technology of Wuhan City (No. 200950431186), the Fundamental Research Funds for the central universities (No. 41030030), and the Self-Research Program for Doctoral Candidates of Wuhan University. All authors would like to thank Dr. Marco Antonio Lopez Heredia, Department of Experimental and Orofacial Medicine, Philipps University, Marburg, Germany, for his critical reading and kind editing of the manuscript. ReferencesV. B. HaywoodH. O. Heymann,
“Nightguard vital bleaching,”
Quintessence Int., 20
(3), 173
–176
(1989). 0033-6572 Google Scholar
A. Joiner,
“Review of the effects of peroxide on enamel and dentine properties,”
J. Dent., 35
(12), 889
–896
(2007). http://dx.doi.org/10.1016/j.jdent.2007.09.008 JDENAB 0300-5712 Google Scholar
V. B. Haywood,
“History, safety, and effectiveness of current bleaching techniques and applications of the nightguard vital bleaching technique,”
Quintessence Int., 23
(7), 471
–488
(1992). 0033-6572 Google Scholar
A. Joiner,
“The bleaching of teeth: a review of the literature,”
J. Dent., 34
(7), 412
–419
(2006). http://dx.doi.org/10.1016/j.jdent.2006.02.002 JDENAB 0300-5712 Google Scholar
R. T. BastingA. L. Rodrigues Jr.M. C. Serra,
“The effect of 10% carbamide peroxide bleaching material on microhardness of sound and demineralized enamel and dentin in situ,”
Oper. Dent., 26
(6), 531
–539
(2001). Google Scholar
H. CimilliC. H. Pameijer,
“Effect of carbamide peroxide bleaching agents on the physical properties and chemical composition of enamel,”
Am. J. Dent., 14
(2), 63
–66
(2001). AJDEES Google Scholar
M. S. McCrackenV. B. Haywood,
“Demineralization effects of 10 percent carbamide peroxide,”
J. Dent., 24
(6), 395
–398
(1996). http://dx.doi.org/10.1016/0300-5712(95)00113-1 JDENAB 0300-5712 Google Scholar
C. Hegeduset al.,
“An atomic force microscopy study on the effect of bleaching agents on enamel surface,”
J. Dent., 27
(7), 509
–515
(1999). http://dx.doi.org/10.1016/S0300-5712(99)00006-8 JDENAB 0300-5712 Google Scholar
C. M. FlaitzM. J. Hicks,
“Effects of carbamide peroxide whitening agents on enamel surfaces and caries-like lesion formation: an SEM and polarized light microscopic in vitro study,”
ASDC. J. Dent. Child., 63
(4), 249
–256
(1996). JDCHAH 0022-0353 Google Scholar
T. Attinet al.,
“Influence of different bleaching systems on fracture toughness and hardness of enamel,”
Oper. Dent., 29
(2), 188
–195
(2004). Google Scholar
J. A. Rodrígueset al.,
“Effects of 10% carbamide peroxide bleaching materials on enamel microhardness,”
Am. J. Dent., 14
(2), 67
–71
(2001). AJDEES Google Scholar
R. R. SeghiI. Denry,
“Effects of external bleaching on indentation and abrasion characteristics of human enamel in vitro,”
J. Dent. Res., 71
(6), 1340
–1344
(1992). http://dx.doi.org/10.1177/00220345920710061201 JDREAF 0022-0345 Google Scholar
G. C. Lopeset al.,
“Effect of bleaching agents on the hardness and morphology of enamel,”
J. Esthet. Restor. Dent., 14
(1), 24
–30
(2002). http://dx.doi.org/10.1111/j.1708-8240.2002.tb00144.x 1496-4155 Google Scholar
A. Berga CaballeroL. Forner NavarroJ. Amengual Lorenzo,
“In vivo evaluation of the effects of 10% carbamide peroxide and 3.5% hydrogen peroxide on the enamel surface,”
Med. Oral Patol. Oral Cir. Bucal., 12
(5), E404
–407
(2007). Google Scholar
V. B. Haywoodet al.,
“Nightguard vital bleaching: effects on enamel surface texture and diffusion,”
Quintessence Int., 21
(10), 801
–804
(1990). 0033-6572 Google Scholar
E. Maiaet al.,
“The influence of two home-applied bleaching agents on enamel microhardness: an in situ study,”
J. Dent., 36
(1), 2
–7
(2008). http://dx.doi.org/10.1016/j.jdent.2007.09.011 JDENAB 0300-5712 Google Scholar
H. Yuet al.,
“Effects of bleaching gels on the surface microhardness of tooth-colored restorative materials in situ,”
J. Dent., 36
(4), 261
–267
(2008). http://dx.doi.org/10.1016/j.jdent.2008.01.008 JDENAB 0300-5712 Google Scholar
M. F. de A Silvaet al.,
“Effect of whitening gels on the surface roughness of restorative materials in situ,”
Dent. Mater., 22
(10), 919
–924
(2006). http://dx.doi.org/10.1016/j.dental.2005.11.029 DEMAEP 0109-5641 Google Scholar
T. Jianget al.,
“Effects of hydrogen peroxide on human dentin structure,”
J. Dent. Res., 86
(11), 1040
–1045
(2007). http://dx.doi.org/10.1177/154405910708601104 JDREAF 0022-0345 Google Scholar
T. Jianget al.,
“Investigation of the effects of 30% hydrogen peroxide on human tooth enamel by Raman scattering and laser-induced fluorescence,”
J. Biomed. Opt., 13
(1), 014019
(2008). http://dx.doi.org/10.1117/1.2870114 JBOPFO 1083-3668 Google Scholar
A. CardenM. D. Morris,
“Application of vibrational spectroscopy to the study of mineralized tissues (review),”
J. Biomed. Opt., 5
(3), 259
–268
(2000). http://dx.doi.org/10.1117/1.429994 JBOPFO 1083-3668 Google Scholar
L. Sunet al.,
“Surface alteration of human tooth enamel subjected to acidic and neutral 30% hydrogen peroxide,”
J. Dent., 39
(10), 686
–692
(2011). http://dx.doi.org/10.1016/j.jdent.2011.07.011 JDENAB 0300-5712 Google Scholar
B. T. AmaechiS. M. Higham,
“Quantitative light-induced fluorescence: a potential tool for general dental assessment,”
J. Biomed. Opt., 7
(1), 7
–13
(2002). http://dx.doi.org/10.1117/1.1427044 JBOPFO 1083-3668 Google Scholar
T. Attinet al.,
“Influence of different bleaching systems on fracture toughness and hardness of enamel,”
Oper. Dent., 29
(2), 188
–195
(2004). Google Scholar
B. R. LawnD. B. Marshall,
“Hardness, toughness, and brittleness: an indentation analysis,”
J. Am. Ceram. Soc., 62
(7–8), 347
–350
(1979). http://dx.doi.org/10.1111/jace.1979.62.issue-7-8 JACTAW 0002-7820 Google Scholar
G. R. Anstiset al.,
“A critical evaluation of indentation techniques for measuring fracture toughness: I, direct crack measurements,”
J. Am. Ceram. Soc., 64
(9), 533
–538
(1981). http://dx.doi.org/10.1111/jace.1981.64.issue-9 JACTAW 0002-7820 Google Scholar
R. G. CraigF. A. PeytonD. W. Johnson,
“Compressive properties of enamel, dental cements, and gold,”
J. Dent. Res., 40
(5), 936
–945
(1961). http://dx.doi.org/10.1177/00220345610400051901 JDREAF 0022-0345 Google Scholar
T. Bisteyet al.,
“In vitro FT-IR study of the effects of hydrogen peroxide on superficial tooth enamel,”
J. Dent., 35
(4), 325
–330
(2007). http://dx.doi.org/10.1016/j.jdent.2006.10.004 JDENAB 0300-5712 Google Scholar
H. Chaiet al.,
“Remarkable resilience of teeth,”
Proc. Natl. Acad. Sci. USA, 106
(18), 7289
–7293
(2009). http://dx.doi.org/10.1073/pnas.0902466106 1091-6490 Google Scholar
M. L. PaineM. L. Snead,
“Protein interactions during assembly of the enamel organic extracellular matrix,”
J. Bone Miner. Res., 12
(2), 221
–227
(1997). http://dx.doi.org/10.1359/jbmr.1997.12.2.221 JBMREJ 0884-0431 Google Scholar
P. ZiouposK. D. Rogers,
“Complementary physical and mechanical techniques to characterise tooth: a bone-like tissue,”
J. Bionic. Engineering, 3
(1), 19
–31
(2006). http://dx.doi.org/10.1016/S1672-6529(06)60003-6 1672-6529 Google Scholar
F. Gilchristet al.,
“The use of micro-Raman spectroscopy to differentiate between sound and eroded primary enamel,”
Int. J. Paediatr. Dent., 17
(4), 274
–280
(2007). http://dx.doi.org/10.1111/ipd.2007.17.issue-4 0960-7439 Google Scholar
C. Hanniget al.,
“Erosive effects of different acids on bovine enamel: release of calcium and phosphate in vitro,”
Arch. Oral Biol., 50
(6), 541
–552
(2005). http://dx.doi.org/10.1016/j.archoralbio.2004.11.002 AOBIAR 0003-9969 Google Scholar
S. K. Al-SalehiD. J. WoodP. V. Hatton,
“The effect of 24 h non-stop hydrogen peroxide concentration on bovine enamel and dentine mineral content and microhardness,”
J. Dent., 35
(11), 845
–850
(2007). http://dx.doi.org/10.1016/j.jdent.2007.08.001 JDENAB 0300-5712 Google Scholar
C. Zantneret al.,
“Surface microhardness of enamel after different home bleaching procedures,”
Dent. Mater., 23
(2), 243
–250
(2007). http://dx.doi.org/10.1016/j.dental.2006.06.044 DEMAEP 0109-5641 Google Scholar
H. Shannonet al.,
“Characterization of enamel exposed to 10% carbamide peroxide bleaching agents,”
Quintessence Int., 24
(1), 39
–44
(1993). 0033-6572 Google Scholar
A. Smidtet al.,
“Effect of bleaching agents on microhardness and surface morphology of tooth enamel,”
Am. J. Dent., 11
(1), 83
–85
(1998). AJDEES Google Scholar
R. H. Leonard Jr.et al.,
“Change in pH of plaque and 10% carbamide peroxide solution during nightguard vital bleaching treatment,”
Quintessence Int., 25
(12), 819
–823
(1994). 0033-6572 Google Scholar
T. Attinet al.,
“Effect of fluoride treatment on remineralization of bleached enamel,”
J. Oral Rehabil., 24
(4), 282
–286
(1997). http://dx.doi.org/10.1046/j.1365-2842.1997.d01-291.x JORHBY 0305-182X Google Scholar
T. Attinet al.,
“Potential of fluoridated carbamide peroxide gels to support post-bleaching enamel re-hardening,”
J. Dent., 35
(9), 755
–759
(2007). http://dx.doi.org/10.1016/j.jdent.2007.06.005 JDENAB 0300-5712 Google Scholar
R. T. BastingA. L. Rodrigues Jr.M. C. Serra,
“The effects of seven carbamide peroxide bleaching agents on enamel microhardness over time,”
J. Am. Dent. Assoc., 134
(10), 1335
–1342
(2003). JADSAY Google Scholar
M. HannigM. Balz,
“Influence of in vivo formed salivary pellicle on enamel erosion,”
Caries Res., 33
(5), 372
–379
(1999). http://dx.doi.org/10.1159/000016536 CAREBK 0008-6568 Google Scholar
M. HannigM. Balz,
“Protective properties of salivary pellicles from two different intraoral sites on enamel erosion,”
Caries Res., 35
(2), 142
–148
(2001). http://dx.doi.org/10.1159/000047446 CAREBK 0008-6568 Google Scholar
M. Hanniget al.,
“Protective effect of the in situ formed short-term salivary pellicle,”
Arch. Oral Biol., 49
(11), 903
–910
(2004). http://dx.doi.org/10.1016/j.archoralbio.2004.05.008 AOBIAR 0003-9969 Google Scholar
L. M. JustinoD. R. TamesF. F. Demarco,
“In situ and in vitro effects of bleaching with carbamide peroxide on human enamel,”
Oper. Dent., 29
(2), 219
–225
(2004). Google Scholar
J. F. Helmet al.,
“Acid neutralizing capacity of human saliva,”
Gastroenterology, 83
(1 Pt 1), 69
–74
(1982). GASTAB 0016-5085 Google Scholar
R. H. Leonard Jr.C. D. BentleyV. B. Haywood,
“Salivary pH changes during 10% carbamide peroxide bleaching,”
Quintessence Int., 25
(8), 547
–550
(1994). 0033-6572 Google Scholar
S. P. HumphreyR. T. Williamson,
“A review of saliva: normal composition, flow, and function,”
J. Prosthet. Dent., 85
(2), 162
–169
(2001). http://dx.doi.org/10.1067/mpr.2001.113778 JPDEAT 0022-3913 Google Scholar
H. TsudaJ. Arends,
“Raman spectroscopy in dental research: a short review of recent studies,”
Adv. Dent. Res., 11
(4), 539
–547
(1997). http://dx.doi.org/10.1177/08959374970110042301 0895-9374 Google Scholar
J. A. Timlinet al.,
“Spatial distribution of phosphate species in mature and newly generated mammalian bone by hyperspectral Raman imaging,”
J. Biomed. Opt., 4
(1), 28
–34
(1999). http://dx.doi.org/10.1117/1.429918 JBOPFO 1083-3668 Google Scholar
J. A. Rodrigueset al.,
“Light-emitting diode and laser fluorescence-based devices in detecting occlusal caries,”
J. Biomed. Opt., 16
(10), 107003
(2011). http://dx.doi.org/10.1117/1.3631796 JBOPFO 1083-3668 Google Scholar
S. S. Thomaset al.,
“Investigation of in vitro dental erosion by optical techniques,”
Lasers. Med. Sci., 23
(3), 319
–329
(2008). http://dx.doi.org/10.1007/s10103-007-0489-z LMSCEZ 1435-604X Google Scholar
S. S. Thomaset al.,
“Clinical trial for detection of dental caries using laser-induced fluorescence ratio reference standard,”
J. Biomed. Opt., 15
(2), 027001
(2010). http://dx.doi.org/10.1117/1.3365945 JBOPFO 1083-3668 Google Scholar
P. Fattibeneet al.,
“A comparative EPR, infrared, and Raman study of natural and deproteinated tooth enamel and dentin,”
Phys. Med. Biol., 50
(6), 1095
–1108
(2005). http://dx.doi.org/10.1088/0031-9155/50/6/004 PHMBA7 0031-9155 Google Scholar
H. Duschneret al.,
“Effects of hydrogen peroxide bleaching strips on tooth surface color, surface microhardness, surface and subsurface ultrastructure, and microchemical (Raman spectroscopic) composition,”
J. Clin. Dent., 17
(3), 72
–78
(2006). JCLDED Google Scholar
J. D. Featherstoneet al.,
“Comparison of artificial caries-like lesions by quantitative microradiography and microhardness profiles,”
Caries Res., 17
(5), 385
–391
(1983). http://dx.doi.org/10.1159/000260692 CAREBK 0008-6568 Google Scholar
J. ArendsJ. J. ten Bosch,
“Demineralization and remineralization evaluation techniques,”
J. Dent. Res., 71 924
–928
(1992). JDREAF 0022-0345 Google Scholar
S. Parket al.,
“On the brittleness of enamel and selected dental materials,”
Dent. Mater., 24
(11), 1477
–1485
(2008). http://dx.doi.org/10.1016/j.dental.2008.03.007 DEMAEP 0109-5641 Google Scholar
T. Jianget al.,
“Beneficial effects of hydroxyapatite on enamel subjected to 30% hydrogen peroxide,”
J. Dent., 36
(11), 907
–914
(2008). http://dx.doi.org/10.1016/j.jdent.2008.07.005 JDENAB 0300-5712 Google Scholar
M. BaldassarriH. C. MargolisE. Beniash,
“Compositional determinants of mechanical properties of enamel,”
J. Dent. Res., 87
(7), 645
–649
(2008). http://dx.doi.org/10.1177/154405910808700711 JDREAF 0022-0345 Google Scholar
W. ThitinanthapanP. SatamanontN. Vongsavan,
“In vitro penetration of the pulp chamber by three brands of carbamide peroxide,”
J. Esthet. Dent., 11
(5), 259
–264
(1999). http://dx.doi.org/10.1111/j.1708-8240.1999.tb00407.x 1496-4155 Google Scholar
|