|
|
1.IntroductionCurrent commonly used caries detection methods in the United States include visual inspection, tactile use of the explorer, and radiographs. Studies in Europe have shown that the explorer is only correct less than 50% of the time.1 Radiographs are good for interproximal caries, but ineffective in detecting occlusal caries before it is well into the dentin due to the amount of sound tissue attenuating the beam.2 By the time an occlusal caries lesion is detectable radiographically, it is too large to be remineralized. If carious lesions are detected early enough, intervention methods, such as fluoride application, sealants, preventive resin restorations, laser treatment, and antibacterial therapy, can be applied to reverse the caries process.2 To successfully apply Caries Management by Risk Assessment (CAMBRA)3–9 the correct diagnosis of the demineralization status (caries level) of the tooth is required. In its early stage, caries detection and diagnosis remain difficult. Visual inspection can be subjective based on clinician experience and training. Standardized visual inspection systems should be adopted to avoid inconsistencies amongst diagnoses from different dentists. The International Caries Detection and Assessment System (ICDAS) provides a standardized method of lesion detection and assessment, leading to caries diagnosis.10 Longitudinal monitoring of lesions has been difficult due to the lack of appropriate diagnostic techniques, i.e., techniques with high sensitivity and specificity that accurately reflect the slow lesion progression. The aim is to arrest or reverse the disease process and to intervene before operative restorative dentistry is needed. All methods for detection and quantification of dental caries require certain conditions: they have to meet all safety regulations; detect early shallow lesions; differentiate between shallow and deep lesions; give a low proportion of false positive readings; present data in a quantitative form so that activity can be monitored; be precise so that measurements can be repeated by several operators; be cost-effective and user-friendly. There are several novel early caries detection methods of which some are commercially available. Fiber-optic transillumination (FOTI) is a technique that uses light transmission through the tooth11–13 and has been available on the market for more than 40 years. A recently marketed method based upon the same principles as FOTI is the digitized DIFOTI method. The images can be stored for later retrieval and comparative examination. Only limited research has so far been performed.14–16 Fluorescence is a property of some manmade and natural materials that absorb energy at certain wavelengths and emit light at longer wavelengths. Several caries detection methods engage fluorescence. When a caries lesion in enamel and dentin is illuminated with, for instance, red laser light (655 nm), organic molecules that have penetrated porous regions of the tooth, especially metabolites from oral bacteria, will create an infrared (IR) fluorescence. The enamel is essentially transparent to red light. The IR fluorescence is believed to originate from porphyrins and related compounds from oral bacteria.17–20 In case of the DIAGNOdent tool (KaVo) the emitted light is channeled through the handpiece to a detector and presented to the operator as a digital number. A higher number indicates more fluorescence and by inference a more extensive lesion below the surface. The system has shown good performance and reproducibility for detection and quantification of occlusal and smooth surface carious lesions in in vitro studies,17,21,22 but with somewhat more contradictory results in vivo, both in the primary and permanent dentition.23–29 It has also been tried for longitudinal monitoring of the caries process and for assessing the outcome of preventive interventions.30 The phenomenon of tooth auto fluorescence has long since been suggested to be useful as a tool for the detection of dental caries.31 An increased porosity due to a subsurface enamel lesion, occupied by water, scatters the light either as it enters the tooth or as the fluorescence is emitted, resulting in a loss of its natural fluorescence. Consequently the demineralized area appears opaque. The strong light scattering in the lesion leads to shorter light path than in sound enamel, and the fluorescence becomes weaker. The quantitative light-induced fluorescence (QLF) method that recently came on the market (Inspektor™ Pro) in several countries can readily detect lesions to a depth of approximately 500 µm on smooth and occlusal enamel surfaces. The QLF method has been tested in several in vitro,32–34 in situ,35 and in vivo36–41 studies for smooth surface caries lesions. The possibility of adapting the QLF method for occlusal caries diagnosis is under investigation.42 The Spectra Caries Detection Aid system aids in the detection of caries using fluorescence technology light-emitting diodes (LED) projecting high-energy light onto the tooth surface causing cariogenic bacteria to fluoresce red and healthy enamel green. The SOPROLIFE system is thought to combine the advantages of a visual inspection method (high specificity) with a high-magnification oral camera and a laser fluorescence device (high reproducibility and discrimination). This technique is based on the light-induced fluorescence evaluator, diagnostic and treatment (LIFE DT) concept.43,44 The electronic caries measurement (ECM) technique is centered on the theory that sound dental hard tissue, especially the enamel, shows high electrical resistance or impedance. Demineralized enamel becomes porous, and the pores fill with saliva, water, microorganisms, etc. The more demineralized the tissue, the lower the resistance becomes. Site-specific measurements have been evaluated in a number of in vitro studies45–48 and in vivo studies.49,50 Surface-specific electrical conductance measurements have been investigated under in vitro conditions,51 which showed moderate sensitivity and specificity. Optical coherence tomography (OCT) is a nonionizing imaging technique that can produce cross-section images of biologic tissues such as ocular, intravascular, gastrointestinal, epidermal, soft oral tissues, and teeth.52–56 OCT can produce two- or three-dimensional images of demineralized regions in dental enamel. When a tooth with a carious lesion is illuminated with infrared light at 1310 nm, OCT technology can produce a quantitative image of the subsurface lesion to the full depth of the enamel.57,58 Polarized sensitive OCT (PS-OCT) can be correlated with the degree of demineralization and lesion severity.57,59 A potential utility for the system is monitoring in vivo caries lesion changes. Up to now all available caries diagnostic tools have limitations due to low sensitivity, specificity, or usefulness. The aim of the study presented here was to evaluate the diagnostic capabilities of three successfully marketed caries lesion detection tools—a laser fluorescence tool (DIAGNOdent) and two LED fluorescence tools (Spectra Caries Detection Aid system and SOPROLIFE daylight and blue florescence tool)—in comparison to the ICDAS II system in detection of caries lesions. 2.Materials and Methods2.1.Study Inclusion and Exclusion CriteriaApproval for the study was obtained from the Committee on Human Research at UCSF (IRB approval number: 10-01869). Prior to enrollment of each subject into the study, an independent dental examiner, not otherwise involved in the study, conducted a clinical examination to assess caries status and to determine an appropriate treatment plan (treatment decisions will not be reported in this paper). An intraoral exam, review of intraoral radiographs, medical history, and definitive dental history were also completed. Inclusion criteria to be eligible for the study were a subject age of 13 years and older, having no occlusal restorations and fissure sealants on at least one molar or bicuspid, and having at least one untreated molar or bicuspid surface presenting an ICDAS II score zero to five (one tooth with ICDAS II score six was included). Subjects had to be healthy and willing to sign the “Authorization for Release of Personal Health Information and Use of Personally Unidentified Study Data for Research” form. There were no gender restrictions. Subjects were excluded from the study if they were suffering from systemic diseases, had a significant past or medical history with conditions that may affect oral health (i.e., diabetes, HIV, heart conditions that require antibiotic prophylaxis), or were taking medications that may affect the oral flora (e.g., antibiotic use in the past three months). Subjects who met the selection criteria were asked to provide verbal/written assent/consent themselves and/or their parent/guardian. One hundred subjects were recruited for the study, comprising 58 females and 42 males with an average age of , ranging from 13.0 to 58.3 years. Fifty percent of the subjects were aged 13 to 20, 28% were 21 to 30, and 22% were 31 to 60 years old. Figure 1 demonstrates the age distribution. Fig. 1Age distribution of 100 subjects: 50 subjects were 13 to 20 years old; 28 subjects were 21 to 30 years; 14 subjects were 31 to 40 years; four subjects were 41 to 50 years; and four subjects were 51 to 60 years old.  In the 100 enrolled subjects, 433 posterior teeth were examined, including 90 bicuspids and 343 molars. On each tooth, if a score could be given up to five fissure areas were separately evaluated per tooth, comprising the mesial, central, and distal parts of the fissure as well as lingual and buccal fissure areas. 2.2.Tooth CleaningBefore evaluating the occlusal surfaces, the 433 teeth were cleaned with a sodium-bicarbonate powder-cleaning tool (Air Max air-polisher with ProphyPen; SATELEC, ACTEON Group, Merignac, France) for five to 10 sec per tooth and then carefully rinsed to remove the powder remnants from the fissure with an air-water spray. Cotton roles were placed and the occlusal surface was shortly air-dried (three seconds per tooth) immediately before performing an assessment. 2.3.Caries Lesion AssessmentIn this study five different caries assessments were performed. The applied carious lesion assessment methods and number of scores given per tool were as follows: 2.3.1.Visual examination and assessment using ICDAS II criteriaThe ICDAS II provides a standardized method of lesion detection and assessment, leading to caries diagnosis.10 ICDAS II assigns scores to lesions based on apparent caries status and lesion severity of plaque-free teeth when visualized wet and when air-dried.10 Of particular interest to this study were the coronal primary caries detection criteria. The two examiners (DC, PR) were blinded to each other’s evaluation results. After independently scoring for ICDAS II, the examiners discussed their findings and agreed on one ICDAS II score per different areas of the tooth. A total of 1034 ICDAS II scores were agreed on for all 433 examined teeth. 2.3.2.Bitewing digital radiographsOn 176 available digital bitewing radiographs (Kodak 2200 Intraoral x-ray system, dental x-ray position indicating device, Kodak RVG 6100 Digital Radiography System by Kodak Dental System, Carestream Health, Atlanta, GA; image storage on Dell Optiplex 755, Dell, Round Rock, TX), a total of 519 areas could be evaluated. Evaluated areas on the x-rays were the mesial and distal approximal and the occlusal areas. Noted was no caries, caries up to 50% in enamel in direction to the dentin enamel junction (DEJ), caries deeper than 50% to the DEJ, caries in dentin up to 50% into dentin (halfway to the pulp), and deeper than 50% into dentin. 2.3.3.DIAGNOdent laser fluorescenceThe DIAGNOdent Classic tool (KaVo, Biberach, Germany) emits a red laser light (wavelength 655 nm) and measures the returning fluorescence in the spectral region wavelength. Before assessing a new subject the tool was calibrated according to manufacturer’s instruction. The highest score per evaluated fissure area was noted (scores ranged from zero to 99). About 1041 DIAGNOdent scores were registered from the 433 occlusal surfaces (DC and PR agreed-on scores). 2.3.4.Spectra Caries Detection AidThe Spectra Caries Detection Aid system uses six blue-violet LEDs emitting at 405-nm wavelength to produce fluorescence pictures. The fluorescence from the tooth is collected by a camera system. Depending on the fluorescence intensity, an on-screen color and a number scale are assigned by the system (Spectra Visix score). The displayed colors are green, blue, red, orange, and yellow; the displayed numbers range from 1.0 (blue) to (yellow); the numbers collected in the study ranged from 1 to 3.9; no number given by the system for an examined fissure was scored as zero. A 10-mm distance spacer and the Spectra handpiece disposable camera covers were used (both AIR TECHNIQUES). To collect and store the images and Spectra Visix scores the Visix imaging software was used. A HP 620 Notebook (HP, Palo Alto, CA; Windows 7, Microsoft Redmond, WA) was used to collect the data. A total of 1039 Spectra Visix scores were noted for the 433 occlusal surfaces. 2.3.5.SOPROLIFE light induced fluorescence evaluatorThe SOPROLIFE light induced fluorescence evaluator system operates in daylight and in blue fluorescence mode. In the daylight mode, the system uses four white LEDs; in the fluorescence mode it uses four blue LEDs emitting a wavelength of 450 nm. The handpiece allows for collecting pictures at different distances to a tooth resulting in different magnifications (from lowest to highest magnification: extra-oral, intra-oral, LIFE, macro preset position). In this study the system was used in the LIFE magnification mode with daylight or fluorescence detection mode I—diagnosis aid mode—utilizing the disposable intraoral protection sheets and the intraoral tip. The images were recorded with the SOPRO IMAGING software. A HP 620 Notebook was used to collect the data. At total of 1066 SOPROLIFE daylight mode scores and 1064 SOPROLIFE blue fluorescence mode scores were assigned to the 433 occlusal surfaces. The newly developed scoring system will be explained in the result section. 2.4.Statistical AnalysesThe data were analyzed by multiple statistical methods (One-way ANOVA, Newman-Keuls multiple comparison test, linear regression analysis, area under the receiver operating characteristics (AROC), sensitivity and specificity calculations with regards to cutoff points) to compare results from the laser fluorescence device (DIAGNOdent), the SOPROLIFE daylight and fluorescence mode evaluation, the Spectra Caries Detection Aid system, with the visual inspection method (ICDAS II) and digital bitewing x-rays. The inter-examiner reliability (DC, PR) for the ICDAS II scoring was assessed with a , SE of , 95% confidence interval from 0.851 to 0.917, 571 observations. The strength of agreement is considered to be “very good.”60 The weighted Kappa was calculated at using linear weighting. Assessed this way, the strength of agreement is considered to be “very good.”60 3.ResultsAll results from caries assessment tool will first be presented separately. Then the relationship between ICDAS II scores and all findings will be described in terms of average score of the tool per ICDAS II code, followed by linear regression fits. Last, area under the receiver operating characteristics curves for overall sensitivity of each detection tool and sensitivity and specificity calculations will be presented. 3.1.Evaluated Scores3.1.1.ICDAS II scores distributionOn the occlusal surfaces of the 433 evaluated teeth, 110 areas in pits and fissures were scored as sound (code 0). ICDAS II code 1 was given for 450 spots and code 2 for 314 lesions, presenting a total of 764 precavitated lesions. Early cavitation with first visual enamel breakdown—ICDAS code 3—was diagnosed in 107 cases, more progressed carious lesions with code 4 as well as code 5 were each noted 26 times. (One lesion scored with an ICDAS II code 6 was included into the code 5 group when averages were performed; when not, it was left separately [see figure axis].) Figure 2 shows the distribution of ICDAS II score. 3.1.2.Digital bitewing radiographsOn 176 available bitewings, 519 areas were evaluated; 491 of those 519 evaluated areas showed no radiographically detectable caries. Twelve lesions located in the approximal areas in enamel extended less than 50% to the DEJ, one lesion extended further than 50% to the DEJ. Three lesions reached 50% into dentin (two approximal, two occlusal), and 12 reached deeper than 50% into dentin halfway to the pulp (three approximal lesions, nine occlusal areas). 3.1.3.DIAGNOdent laser fluorescenceOn the occlusal surfaces of the 433 evaluated teeth in 1041 pits and fissure areas, DIAGNOdent evaluations were performed. Measured values ranged from zero to 99. In the majority of cases (424) values between zero and 10 were recorded, followed by 291 measured spots with values between 11 and 20. The remaining 326 measurements covered values between 21 and 99, including 31 areas with a DIAGNOdent value of 99. Figure 3 shows grouping and the detailed distribution of DIAGNOdent scores. 3.1.4.Spectra Caries Detection Aid systemA total of 1039 Spectra Visix scores was noted. A Spectra Visix value of 0 (no value depicted by the Spectra System) was observed 114 times. Values between 1.0 and 1.9 were 739 times displayed, 172 times a value of 2.0 to 2.9 was registered, and 14 times a value between 3.0 and 3.9 was shown with 3.9 as the highest value measured. The Spectra Visix score distribution is depicted in Fig. 4. 3.1.5.SOPROLIFE scores for occlusal fissure areasFrom each evaluated tooth, SOPROLIFE daylight and SOPROLIFE blue fluorescence pictures were picked, evaluated for sharpness, and then a categorization was attempted. SOPROLIFE daylight and SOPROLIFE fluorescence pictures for occlusal fissure areas could both be categorized into six different groups each—code 0 to code 5. The categorization followed appearance criteria of the lesion and was performed independently from the registered ICDAS II code. The categorization was led by the idea that width of a lesion related to the confines of fissures, difference in color, and intensity of the registered color expressions as well as roughness of the enamel structure, break in enamel with first enamel loss, and finally visible dentin would go along with the progression of a caries lesion. Thus precavitated and cavitated lesions and their development levels were categorized. SOPROLIFE daylight mode score description and examplesWhen evaluating occlusal fissure areas in SOPROLIFE daylight mode, code 0 was given for sound enamel with no changes in the fissure area [Figs. 5(a) and 5(b)]. Code 1 was selected if the center of the fissure showed whitish or slightly yellowish change in the enamel. In code 1 change is limited to part or all the base of the pit and fissure system [Figs. 6(a)–6(c)]. For a code 2 the whitish change extends the base of the pit and fissure system and comes up the slopes (walls) of the fissure system toward the cusps. The change is wider than the confines of the fissure and can be seen in part of or all the pit and fissure system. No enamel breakdown is visible [Figs. 7(a)–7(c)]. Code 3 describes fissures with rough and slightly open areas depicting a beginning slight enamel breakdown. Changes are confined to the fissure and do not need to come up the slopes. There are no visual signs of dentin involvement [Figs. 8(a)–8(c)]. In code 4 the caries process is not confined to the fissure width anymore and presents itself much wider than the fissure; the due to caries changed areas have a “mother-of-pearl” glossy appearance [Figs. 9(a)–9(c)]. If there is obvious enamel breakdown with visible dentin code 5 was given [Figs. 10(a)–10(c)]. Table 1 summarizes the observed changes and the corresponding codes for the SOPROLIFE daylight mode. Fig. 6(a), (b), and (c) SOPROLIFE daylight code 1; center of the fissure showing whitish, slightly yellowish change in enamel, limited to part or all of the base of the pit and fissure system (see blue arrows).  Fig. 7(a), (b), and (c) SOPROLIFE daylight code 2; whitish change comes up the slopes (walls) toward the cusps; the change is wider than the confines of the fissure, seen in part or all the pit and fissure system, no enamel breakdown is visible (blue arrows mark the changes coming up the slopes). 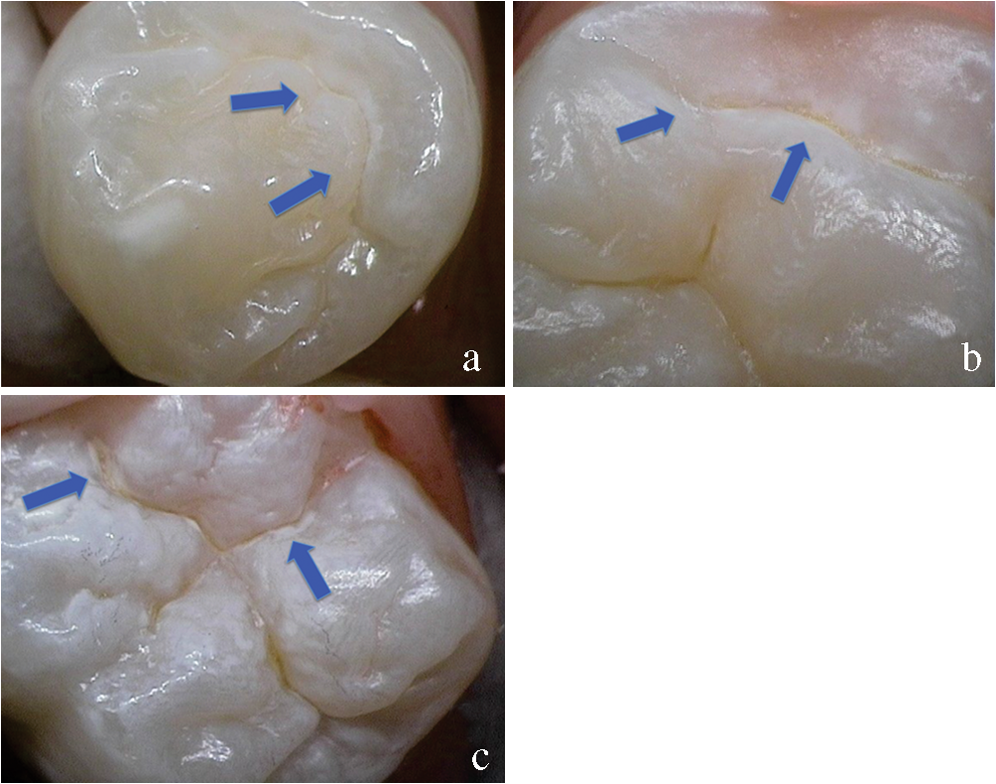 Fig. 8(a), (b), and (c) SOPROLIFE daylight code 3; fissure enamel is rough and slightly open with beginning slight enamel breakdown; changes are confined to the fissure and do not need to come up the slopes, no visual signs of dentin involvement (blue arrow marks slight enamel loss). 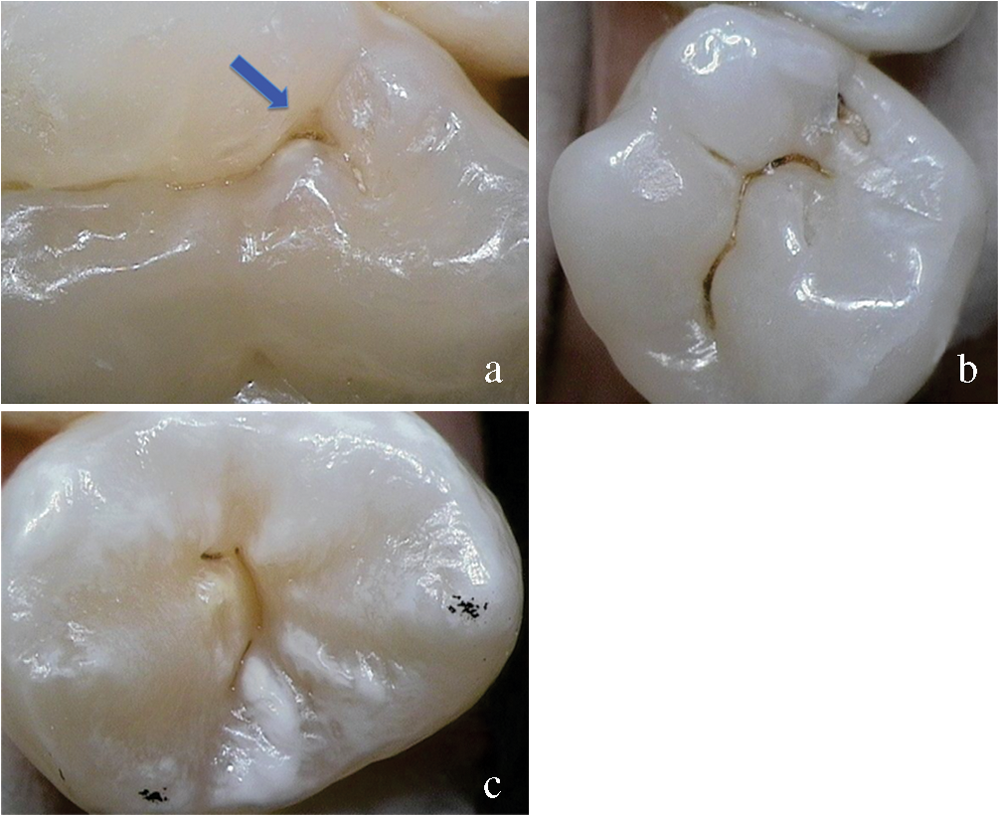 Fig. 9(a), (b), and (c) SOPROLIFE daylight code 4; caries process is not confined to the fissure width; presents itself much wider than the fissure; changed area has a “mother-of-pearl” glossy appearance.  Fig. 10(a), (b), and (c) SOPROLIFE daylight code 5; enamel breakdown with visible open dentin (arrows mark open dentin).  Table 1SOPROLIFE daylight codes for coronal caries.
SOPROLIFE blue fluorescence mode score description and examplesWhen evaluating occlusal fissure areas in SOPROLIFE blue fluorescence mode, code 0 was given when the fissure appears shiny green, the enamel appears sound, and there are no visible changes [Fig. 11(a)]. Rarely a graphite-pencil-colored thin shine/line can be observed [Fig. 11(b)]. Code 1 was selected if a tiny, thin red shimmer in the pits and fissure system is observed, which can slightly come up the slopes (walls) of the fissure system. No red dots are visible [Figs. 12(a) and 12(b)]. At code 2, in addition to the tiny, thin red shimmer in pits and fissures possibly coming up the slopes, darker red spots confined to the fissure are visible [Figs. 13(a) and 13(b)]. For code 3 dark red spots have extended as lines into the fissure areas but are still confined to the fissures. A slight beginning roughness of the more lined red areas can be visible [Figs. 14(a) and 14(b)]. If the dark red (or red-orange) extends wider than the confines of the fissures, a code 4 was given [Figs. 15(a) and 15(b)]. Surface roughness occurs, possibly grey and/or rough grey zone are visible [Figs. 15(c) and 15(d)]. Code 5 was selected if obvious openings of enamel were seen with visible dentin [Figs. 16(a) and 16(b)]. Table 2 summarizes the observed changes and the corresponding scores for the SOPROLIFE blue fluorescence mode. Fig. 11(a) and (b) SOPROLIFE blue fluorescence code 0; no visible change in enamel (rarely a graphite pencil colored thin shine can be observed—blue arrow mark)  Fig. 12(a) and (b) SOPROLIFE blue fluorescence code 1; tiny, thin red shimmer in the pits and fissure system can come up the slopes, no red dots visible; arrows mark tiny, thin red shimmer.  Fig. 13(a) and (b) SOPROLIFE blue fluorescence code 2; in addition to tiny, thin red shimmer in pits and fissures possibly coming up the slopes darker red spots confined to the fissure are visible; no surface roughness; arrows mark dark red spots. 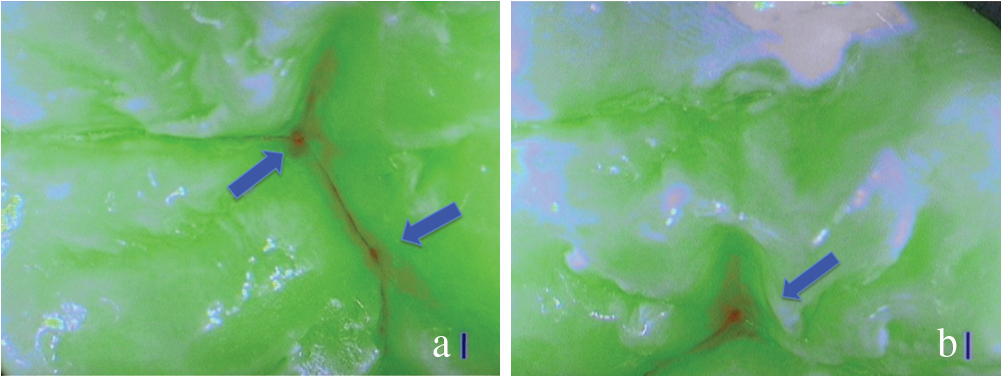 Fig. 14(a) and (b) SOPROLIFE blue fluorescence code 3; dark red extended areas confined to the fissures; slight beginning roughness possible.  Fig. 15(a), (b), (c), and (d) SOPROLIFE blue fluorescence code 4; dark red or orange areas wider than fissures; surface roughness occurs, possibly grey or rough grey zone visible; arrows mark surface roughness. 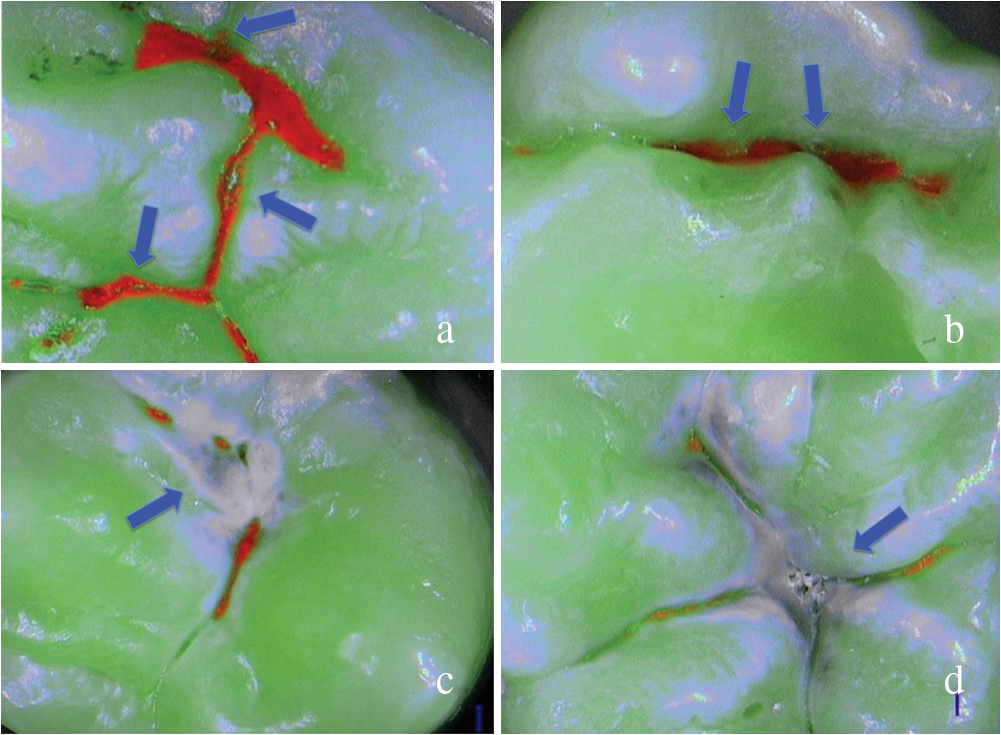 Fig. 16(a) and (b) SOPROLIFE blue fluorescence code 5; obvious wide openings with visible dentin (arrows).  Table 2SOPROLIFE blue fluorescence codes for coronal caries.
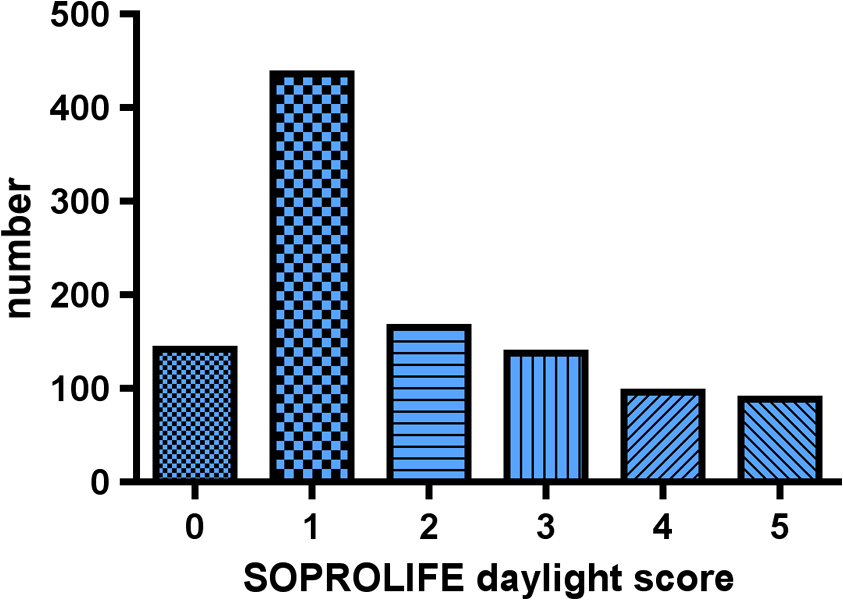
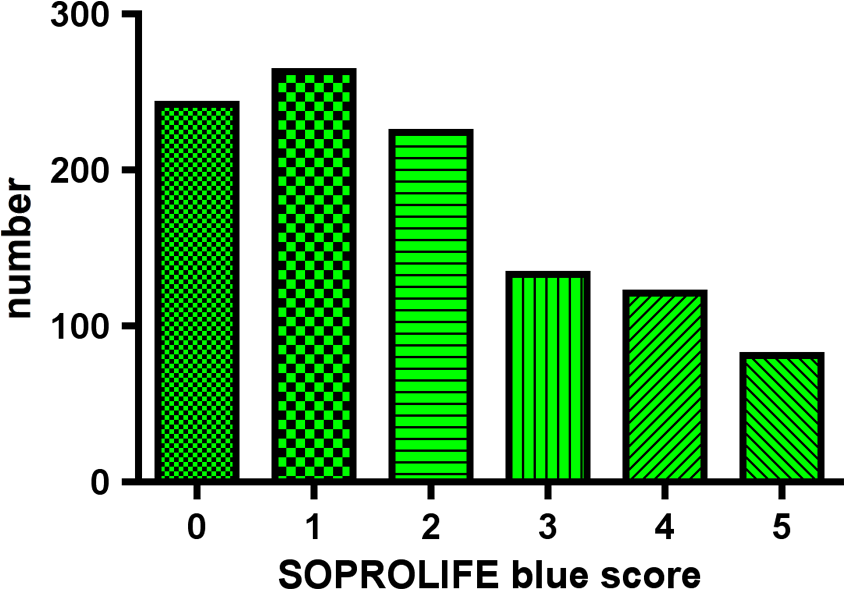
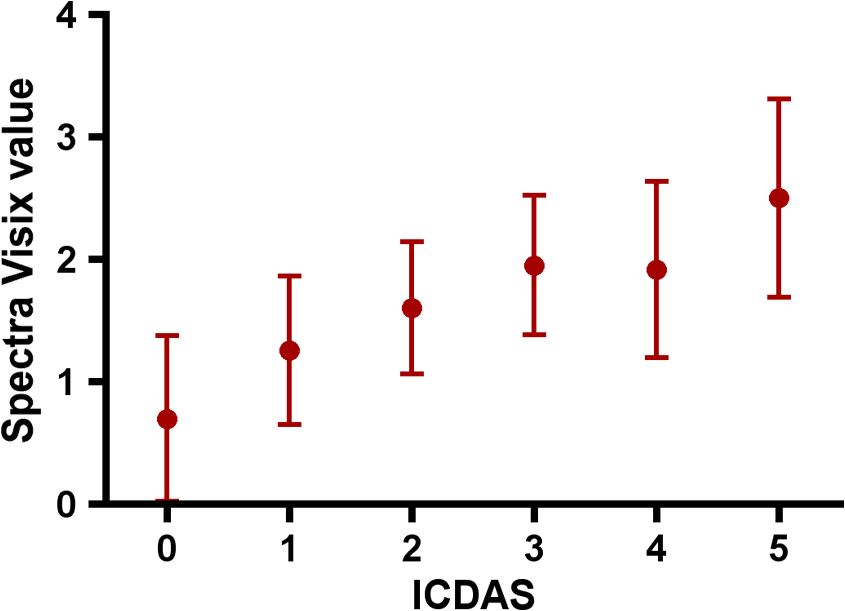
Results SOPROLIFE daylight mode1066 SOPROLIFE daylight mode scores were assigned to the occlusal surfaces of the 433 study teeth using the newly developed scoring system. The SOPROLIFE daylight scores were assigned evaluating the stored SOPROLIFE pictures from each subject on a MacBookPro 17-inch-screen laptop. 142 pits and fissure areas were scored as score zero, 436 as score 1, 165 as score 2, 138 as score 3, 96 as score 4, and 89 as score 5 (Fig. 17). Results SOPROLIFE blue fluorescence mode1064 SOPROLIFE fluorescence mode scores were assigned to the occlusal surfaces of the study teeth with the newly developed scoring system. The SOPROLIFE blue fluorescence pictures were also scored on a MacBookPro 17-inch screen. As depicted by Fig. 18, 242 times score zero was given, 263 times score 1 was assigned, 224 times score 2, 133 times score 3, 121 times score 4, and 81 times score 5 was given by the two independent examiners. 3.2.Relationship Between ICDAS II and Other Caries Assessment ScoresThe following calculations and graphs demonstrate the score distribution of the different caries assessment tools in relation to the ICDAS II score. 3.2.1.Relationship between ICDAS II and DIAGNOdent valuesFigure 19 shows the average registered DIAGNOdent values per each ICDAS II score. ICDAS II scores 0 for “sound” receives an average DIAGNOdent value of (); scores one and two—precavitated lesions—showed DIAGNOdent values of and , respectively. Cavitated lesions—ICDAS II score three and five—demonstrated average DIAGNOdent values of and , respectively. ICDAS II code 4 shows with , a similar average value as code 3. The one-way ANOVA test with Newman-Keuls Multiple Comparison Test revealed that all average DIAGNOdent values for ICDAS II 0, 1, 2, 3, and 5 were statistically significant different from each other with a value of . Only the average DIAGNOdent values comparing ICDAS II score 3 to 4 were not statistically significant different. 3.2.2.ICDAS II and Caries Detection Aid system Spectra Visix valuesFigure 20 demonstrates the distribution of the average Spectra Visix values per ICDAS II score. ICDAS II score 0 shows an average Spectra Visix value of (). ICDAS II score 1 and 2 demonstrate average Spectra Visix values of and , respectively. Occlusal surfaces with an ICDAS II score 4 show average values of , and ICDAS II score 5 pits and fissures demonstrate a Spectra Visix value of . Spectra Visix average values are significantly different from each other for ICDAS II score 0, 1, 3, and 5 with , and for score 2 and 4 with . Spectra Visix scores for ICDAS II score 3 do not statistically significant differ from those given for ICDAS II score 4. 3.2.3.Relationship between ICDAS II and SOPROLIFE daylight scoresFigure 21 demonstrates the different ICDAS II scores and the corresponding distribution of the assigned SOPROLIFE daylight scores. For surfaces, which were scored with ICDAS II code 0—“sound”—a SOPROLIFE daylight average score of () was given. For precavitated lesions—ICDAS II code 1 and 2—a SOPROLIFE daylight average score of and , respectively, was given. More severe caries lesions (cavitated) received significant higher scores. An ICDAS II score 3—first visible breakdown of enamel—received a SOPROLIFE daylight score and a carious lesion with visible dentin exposure was scored with an average SOPROLIFE daylight score. The one-way ANOVA test with Newman-Keuls multiple comparison test revealed that all mean SOPROLIFE daylight scores for ICDAS 0, 1, 2, 3, and 5 were statistically significant different from each other with a value of . The average SOPROLIFE daylight score for ICDAS II score 4 () was not significantly different from the average for ICDAS score 3 but still significantly different from the average given for ICDAS II score 5 (). 3.2.4.Relationship between ICDAS II and SOPROLIFE blue fluorescence scoresFigure 22 demonstrates the different ICDAS II scores and the corresponding distribution of the assigned SOPROLIFE blue fluorescence scores. The distribution patterns are very close to the above-described patterns for the average SOPROLIFE daylight scores. The average SOPROLIFE blue fluorescence scores differed minimally or not at all from the SOPROLIFE daylight average scores for the different ICDAS II score groups. An ICDAS II score 0 received an average SOPROLIFE blue fluorescence score of ()—slightly lower than the SOPROLIFE daylight score (lower by 0.13). For precavitated lesions—ICDAS II score 1 and 2—the SOPROLIFE blue fluorescence scores of and , respectively, were given. The average SOPROLIFE blue fluorescence score for ICDAS II score 3 lesions was . Caries lesions with visible dentin exposure (ICDAS II score 5) were scored with an average score. Again, the one-way ANOVA test with Newman-Keuls Multiple Comparison Test revealed that all mean SOPROLIFE blue fluorescence scores for ICDAS 0, 1, 2, 3, and 5 were statistically significant different from each other with a value of . Similar to the SOPROLIFE daylight scores the average SOPROLIFE blue fluorescence score for ICDAS II score 4 () was not significantly different from the average for ICDAS score 3 but still significantly different from the average given for ICDAS II score 5 (). 3.3.Linear Regression Fits for Caries Assessment Tools in Relation to ICDAS II ScoresTo evaluate for each assessment method the discrimination between two different scores of a system, regression curves were calculated for each caries assessment tool. The following graph (Fig. 23) combines the linear regression fit for all four assessment tools—DIAGNOdent, SOPROLIFE daylight and blue fluorescence, and Spectra Caries Detection Aid—in relation to the ICDAS scores in one plot. In order to produce this overview, data had to be normalized to achieve a -axis value range between 0 and 5 (DIAGNOdent values were adjusted with a factor of ; the other values were not adjusted). Fig. 23Linear regression fit for SOPROLIFE daylight and blue fluorescence, DIAGNOdent and Spectra Visix values in respect to ICDAS II scores, all data are normalized. 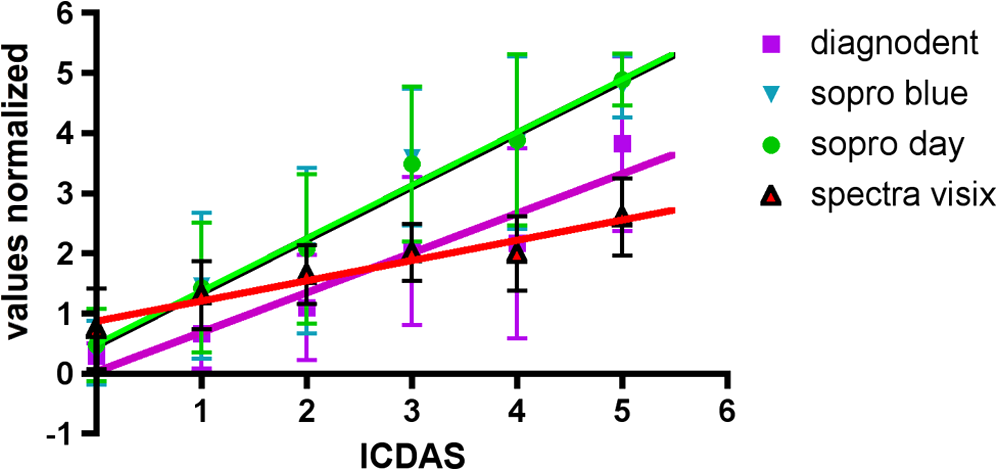 The slopes of the regression lines for all tools are significantly nonzero (SOPROLIFE daylight and blue fluorescence , DIAGNOdent , Spectra Caries Detection Aid ). The slopes of the regression lines are the highest/steepest for both SOPROLIFE assessment methods, followed by DIAGNOdent and Spectra Caries Detection Aid. The slopes of the regression lines are 0.8809 for SOPROLIFE daylight () and SOPROLIFE blue fluorescence (), 0.6600 () for DIAGNOdent, and 0.3357 () for Spectra Caries Detection Aid. The goodness of fit for SOPROLIFE daylight was , for SOPROLIFE blue fluorescence 0.9763, for DIAGNOdent 0.9238 and for Spectra Visix 0.9501. 3.4.Area Under the Receiver Operating Characteristics CurvesTo quantify the overall ability of the different applied caries detection tools to discriminate between those individuals with the disease and those without the disease, we have looked at different ICDAS scores and grouping of ICDAS scores to evaluate the area under the receiver operating characteristics curves (AROC) for DIAGNOdent, SOPROLIFE blue fluorescence, and Spectra Caries Detection Aid. In the past, caries lesions have typically only been defined as “cavity,” thus our basic approach was to sum all ICDAS values corresponding to no or precavitated lesions together as “healthy” and compare them to the remaining “disease” scores. Thus in the following calculations the values for the different detection tools related to the ICDAS II codes 0, 1, and 2 are placed into one group to represent healthy conditions. Values defined by ICDAS code 3 (first visible enamel breakdown) and higher will be grouped together to represent carious lesions. In a second approach, values derived only from ICDAS II code 0 locations were compared to all other values. Furthermore, values originated from ICDAS II scores 0 and 1 were summed together in one group as healthy. None of those additional approaches delivered superior results over placing values from ICDAS code 0, 1, and 2 locations into one group. Thus we will only present ROC curves for values originated from summing ICDAS II score 0, 1, and 2 together in one group (ICDAS 0-1-2). The area under the ROC curve was interpreted by using the following classification:61 0.60 to ; 0.75 to ; 0.90 to ; and 0.97 to . The highest area under the ROC curve value, thus the highest overall ability to discriminate between “carious” and “noncarious,” is achieved for the SOPROLIFE blue fluorescence tool with (SE), and a 95% confidence interval of 0.8580 to 0.9128 and a value (Fig. 24). This is followed by the SOPROLIFE daylight assessment with an area under the curve value of . Fig. 24AROC curve for SOPROLIFE blue fluorescence is (SE), 0.8580 to 0.9128 (95% confidence interval) with a value .  For the DIAGNOdent tool, the area under the ROC curve was slightly smaller with (Fig. 25). The Spectra Visix receives the smallest area under the ROC curve with (Fig. 26). Table 3 shows additionally confidence intervals and values for all diagnostic methods. Fig. 25AROC curve for the DIAGNOdent is 0.8700 (SE), 0.8423 to 0.8976 (95% confidence interval), with a value .  Fig. 26AROC curve for Spectra Visix is (SE), 0.7806 to 0.8566 (95% confidence interval) with a value .  Table 3Area under the ROC curve for SOPROLIFE, DIAGNOdent, and Spectra Caries Detection Aid.
Using the grouping of ICDAS II code 0-1-2 as “healthy” results in the highest area under the ROC value for the all four diagnostic methods. All methods received an area under the curve value, which is regarded as a “good” overall sensitivity of the diagnostic method.61 3.5.Sensitivity and Specificity of Caries Assessment Tools at Different ICDAS Cutoff PointsIn a next step, sensitivity and specificity of all four caries detection systems were calculated. As cutoff point, the corresponding value for ICDAS grouping of score 0, 1, and 2 together as healthy and noncavitated lesions was chosen (Figs. 27Fig. 28–29). Table 4 shows in addition to the average scores () for each diagnostic method for the grouping of code 1, 2, and 3 together as overview the average values for ICDAS code 1, 2, and 3, separately. If the value for grouping ICDAS code 0, 1, and 2 is chosen as cutoff point for the sensitivity calculation, the average value for DIAGNOdent is 15.5 with a corresponding sensitivity of 87% and a specificity of 66%. With the same ICDAS cutoff, Spectra Caries Detection Aid at its corresponding cutoff value of 1.3 achieves a sensitivity of 92%, but the specificity is only 37%. SOPROLIFE in daylight mode with an equivalent cutoff value of 1.54 presents a sensitivity of 93% and specificity of 63%, while SOPROLIFE blue fluorescence with cutoff value of 1.52 shows a sensitivity of 95%, but the specificity is down to 55%. Table 5 summarizes the specific tool cutoff values for grouping ICDAS 0 with 1 and 2 as “healthy,” the sensitivity and specificity at this cutoff, confidence intervals, and likelihood ratio. Fig. 27Sensitivity and specificity of the DIAGNOdent; cutoff point at the grouping of ICDAS code 0, 1, and 2 together.  Fig. 28Sensitivity and specificity of the SOPROLIFE blue fluorescence; cutoff point at the grouping of ICDAS code 0, 1, and 2 together. 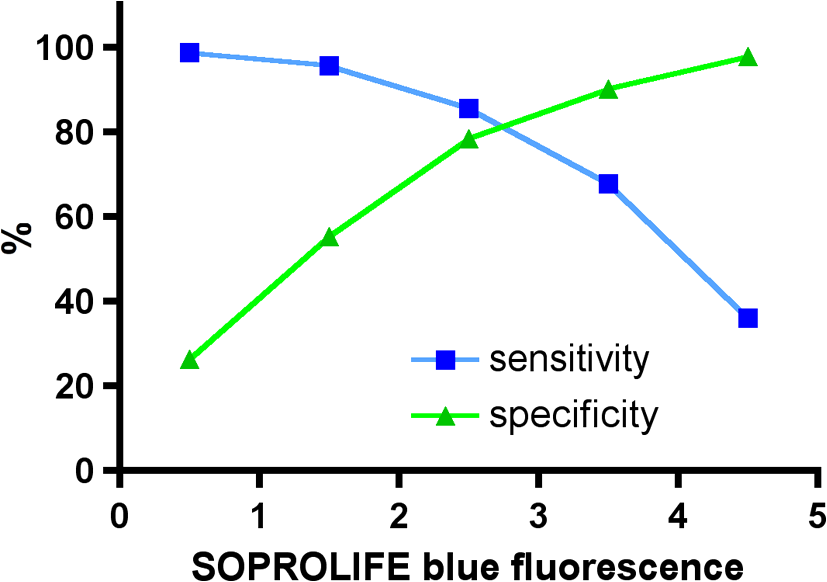 Fig. 29Sensitivity and specificity of the Spectra Caries Detection Aid; cutoff point at grouping of ICDAS code 0, 1, and 2 together. 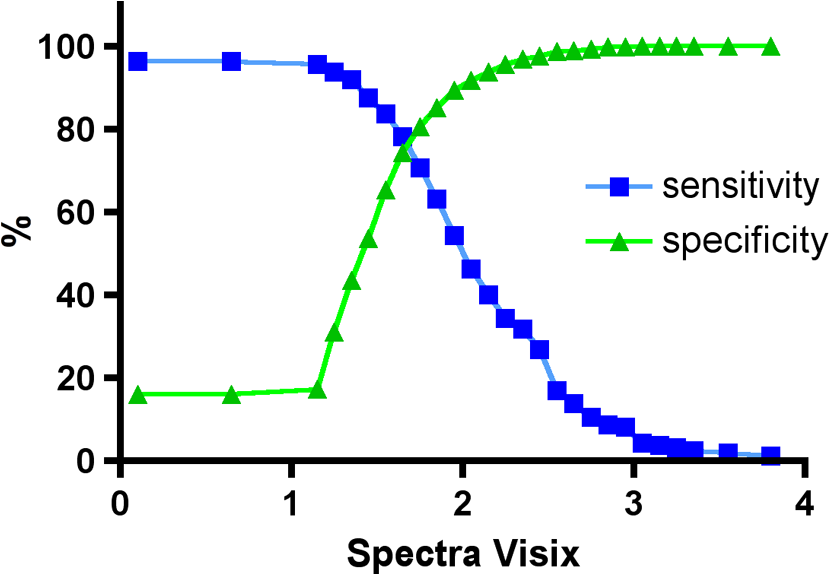 Table 4Average values for DIAGNOdent, SOPROLIFE, and Spectra Caries Detection Aid at different ICDAS scores and grouping of ICDAS 0, 1, and 2 together.
Table 5Sensitivity and specificity at the cutoff value for DIAGNOdent, SOPROLIFE, and Spectra Caries Detection Aid, 95% confidence interval and likelihood ration.
4.DiscussionOver the years diverse caries detection systems have been used, all of them using different definitions and description terms; consequently communication across different dental fields has been difficult. The visual method known as the International Caries Detection and Assessment System II (ICDAS II) has been developed with the purpose of bridging the gap of communication between fields of dental epidemiology, clinical caries research, and clinical caries management.10 ICDAS criteria are based on enamel properties of translucency and microporosity. With numerous demineralization events, the microporosity of enamel subsurface increases, which leads to changes in its refractive index. The first sign of carious alteration is a change in translucency and light refraction of the enamel surface. If demineralization is allowed to continue, the enamel microporosity increases, which then leads to further decrease in the refractive index of enamel.62 Ekstrand et al.46,63,64 validated ICDAS by demonstrating an association between the severity of caries lesions (as described by ICDAS codes) and the lesions’ histological depth. Other authors have confirmed a close relationship between ICDAS scoring, and the histological depth of the caries lesion especially in precavitated but also in slightly cavitated stages.65,66 These studies again endorsed a relationship between the visual topography at surface level and the histological lesion depth. ICDAS II code and relation to histological lesion depth has been reported as: code 1, lesion depth in pits/fissures was 90% in the outer enamel with only 10% into dentin; code 2, lesion depth was 50% into the inner enamel and 50% into the outer dentin; code 3, lesion depth was 77% in dentin; code 4, lesion depth was 88% into dentin; code 5, lesion depth was 100% in dentin.63 Due to the validated relationship between ICDAS codes and the histological depth of a carious lesion, ICDAS II was used as “gold standard” in the present study. ICDAS II ratings were compared to four other caries assessment tools, including DIAGNOdent, SOPROLIFE daylight and blue fluorescence, and Spectra Caries Detection Aid. Digital bitewings are not discussed further here since they only showed occlusal lesions in nine cases, therefore not detecting occlusal lesions in the bulk of the teeth examined and were only successful in detecting approximal lesions. In this study 433 posterior teeth in 100 subjects were examined and up to 1066 data points for each assessment method were available for statistical evaluation. Using 1066 SOPROLIFE daylight and 1064 blue fluorescence areas of interest led to the development of a new SOPROLIFE daylight and blue fluorescence scoring system with six distinct codes for each detection mode. Developing those codes enabled us to compare the diagnostic abilities of the SOPROLIFE system with ICDAS II as well as the other caries assessment tools. Examining the relationship between the ICDAS II scores and the scores derived from the different assessment tools revealed that for each ICDAS II code, each diagnostic tool provides a distinct average score. Per assessment tool each average score for one given ICDAS II code was significantly different from the one for another ICDAS II code. Interestingly, for all tools there was a difference in average values for ICDAS II code 3 versus code 4 with the average for code 4 higher, but that difference was not statistically significant. One explanation could be that only 25 lesions were scored with ICDAS II code 4. DIAGNOdent as a spot fluorescence measurement tool has been previously discussed for its clinical validity.23–29 The discussion about an appropriate cutoff point to determine an operative intervention (filling) is ongoing.67–71 The company recommends a cutoff point between 15 and 30 depending on caries risk. Eakle et al. recommended as cutoff point a DIAGNOdent value of 25 to 30.72 If an ICDAS code 3—first visualized breakdown of enamel—is considered as reason for an operative intervention, according to our study the equivalent DIAGNOdent value is located around 40, while for code 2 it is around 22. ICDAS II code 0—“sound”—accumulated a very low SOPROLIFE daylight average score of (). Noncavitated lesions (ICDAS II code 1 and 2, respectively) provided significantly higher SOPROLIFE daylight scores of and , respectively. More severe, already slightly cavitated caries lesions with first visible enamel breakdown (ICDAS II code 3) received significant higher scores with , and when even dentin was visibly exposed (ICDAS II code 5) the SOPROLIFE daylight climbed to a score. For SOPROLIFE blue fluorescence the distribution pattern as well as the values for average scores were similar and close to the SOPROLIFE daylight assessments. The absolute value differences between those average scores are high enough to allow the conclusion that the difference between each code is not only statistically but clinically significant. Thus the new SOPROLIFE daylight and blue fluorescence codes can serve as a distinct classification for sound, precavitated and cavitated caries lesions allowing the prediction of the histological depth of caries lesions. Last, when comparing average Spectra Visix values for each ICDAS II code, the differences in values for each ICDAS II code are statistically significant, but the absolute value differences are relatively small. Those small differences in value for each lesion class might not be clinically significant to help in differentiating between sound, precavitated or cavitated lesions. The linear regression fits for caries assessment tools in relation to average ICDAS II scores revealed that for all different caries assessment tools all line fits were significantly nonzero. In other words with a known value on the -axis, a distinct value on the -axis can be calculated. The slope of the line determines the discrimination. On a flat curve two different values on the -axis are not easy to discriminate. In contrast, on a steep curve the difference between two values on the -axis is much higher and thus easier to discriminate. The goodness of fit was very high for all linear regression fit calculations. Using normalized data the linear regression fit for all caries assessment tools revealed that both SOPROLIFE caries assessment tools present the highest slope values of all, demonstrating the steepest slope with 0.8809. The slope for the DIAGNOdent linear regression fit is lower with 0.6600, while the Spectra Visix slope is 0.3357. From this point of view, SOPROLIFE daylight and SOPROLIFE blue fluorescence allow for the best discrimination followed by DIAGNOdent and Spectra Caries Detection Aid. Using SOPROLIFE a judgment call for classification of a lesion into sound, precavitated or cavitated, even with sublevels per class, is easier to make than with the other tools. With respect to the overall ability of the different applied caries assessment tools to discriminate between healthy and diseased the AROC achieved similar high values for each tool. The best AROC values were accomplished when ICDAS code 0 and precavitated lesions (codes 1 and 2) were grouped together as “healthy” and all other codes were gathered as “caries” representing in a traditional way cavitated lesions. No other grouping of codes resulted in higher AROC values; no higher overall ability to discriminate between carious and noncarious could be achieved. When sensitivity and specificity were calculated, the grouping of no lesion/healthy and precavitated lesions together appeared again to be the best cutoff point for each detection method to determine sensitivity and specificity of each method. Selecting this cutoff point DIAGNOdent achieved a sensitivity of 87% with a specificity of 66%. At the same cutoff point, SOPROLIFE in daylight mode showed with 93% a slightly higher sensitivity and a slightly lower specificity (63%). In the blue fluorescence mode the sensitivity of the tool was slightly higher, up to 95%, but the specificity drops to 55%. The Spectra Visix achieved a similar high-sensitivity value at this cutoff (92%), but the specificity was extremely low at 37%. Only for the DIAGNOdent tool, a wide range of reports is available, but the sensitivity values range widely from 19% to 100%. The specificity values exhibit a similar pattern, ranging from 52% to 100%.73 In comparison with visual assessments Bader et al. (2004) state in a systematic review that the DIAGNOdent exhibits a sensitivity value that was always higher and a specificity value that was always lower.73 The DIAGNOdent and DIAGNOdent pen have been compared with the Spectra Caries Detection Aid in vitro,74 and the in vitro sensitivity and specificity of the tool against the gold standard histology has also been evaluated. Sensitivity was reported between 57% and 94%, while specificity was calculated between 50% and 78%, depending on chosen diagnostic threshold/cutoff points and selected data sets.75 In another in vitro study when using the cutoff points recommended by the manufacturer, sensitivity values showed a high variance ranging from 0.04 to 0.86, and specificity values were between 0.32 and 0.99.76 DIAGNOdent scores were relatively high on precavitated lesions. Contrary to DIAGNOdent and Spectra Caries Detection Aid with the SOPROLIFE system, the lesion and its real topography can be seen in a magnified enlarged view. The lesion extension in terms of confinement of the lesion to the fissure, extending from the base of the fissure up the slopes etc., as well as the physical surface topography with roughness and with first enamel loss or even open dentin, can clearly be seen. This helps in scoring a lesion in daylight mode. Adding the blue fluorescence an additional prediction can be made from the “color scheme,” especially intensity and spread of the fluorescence color, which are reflected in the new SOPROLIFE blue fluorescence score. We assume from our observations in this study that the fluorescence signal and expression are most probably triggered and modified by bacteria and bacteria byproducts. The blue light transmits through healthy enamel and evokes a green fluorescence of the dentin core. The green fluorescence light coming back from the dentin core then leads to a red fluorescence from bacteria and bacterial byproducts like porphyrins. The prediction of lesion depth and stage is guided by scoring details like tiny shiny red fluorescence, red dots confined to the fissure, dark red fluorescence confined to the fissure, intense red wider than the fissure confinement possibly including grey areas wider than the fissure, and additional roughness. Both evaluation modes allow the definition of the lesion width as well as an assumption of the histological lesion depth. The additional observation with the SOPROLIFE camera might also prevent unnecessary operative interventions based on high fluorescence scores due to the better visibility. The fluorescence camera system allows picturing where the fluorescence signal comes from and, especially, what the reason for an unexpected high fluorescence value might be. Due to that “visibility” of the lesion, the interpretation of a higher fluorescence answers is easier. The observation capacity of the SOPROLIFE system should guide the clinician toward a more preventive and minimally invasive treatment strategy with monitoring lesion progression or remineralization over time and not tempt him/her to overtreat a lesion.77 5.ConclusionAll fluorescence tools were able to differentiate between distinct ICDAS II scores. For all tools the AROC depicting the overall capability to discriminate between healthy and diseased achieved similar high values with the SOPROLIFE tool in daylight as well as blue fluorescence mode having the highest values. Furthermore, the linear regression fits for the caries assessment tools in relation to ICDAS II codes revealed that both SOPROLIFE assessment tools with the highest slope values allow for the best caries lesion discrimination followed by DIAGNOdent. Spectra Caries Detection Aid demonstrates a relatively flat curve with low discrimination ability. At a cutoff point grouping healthy teeth and precavitated lesions together, DIAGNOdent shows a sensitivity of 87% and specificity of 66%, followed by SOPROLIFE daylight with sensitivity to specificity 93% to 63%, SOPROLIFE blue fluorescence with 95% to 55%, and Spectra Caries Detection Aid with 92% to 37%. Engaging those fluorescence tools, specifically those with observational capacity should guide clinicians toward a more preventive and minimally invasive treatment strategy and will allow monitoring lesions for success of prevention measures over time. ReferencesA. Lussi,
“Validity of diagnostic and treatment decisions of fissure caries,”
Caries Res., 25
(4), 296
–303
(1991). http://dx.doi.org/10.1159/000261380 CAREBK 0008-6568 Google Scholar
J. D. Featherstone,
“Caries detection and prevention with laser energy,”
Dent. Clin. North Am., 44
(4), 955
–969
(2000). DCNAAC 0011-8532 Google Scholar
D. A. YoungJ. D. FeatherstoneJ. R. Roth,
“Curing the silent epidemic: caries management in the 21st century and beyond,”
J. Calif. Dent. Assoc., 35
(10), 681
–685
(2007). JCDEA6 0008-0977 Google Scholar
D. A. Younget al.,
“Caries management by risk assessment: implementation guidelines,”
J. Calif. Dent. Assoc., 35
(11), 799
–805
(2007). JCDEA6 0008-0977 Google Scholar
L. Jensonet al.,
“Clinical protocols for caries management by risk assessment,”
J. Calif. Dent. Assoc., 35
(10), 714
–723
(2007). JCDEA6 0008-0977 Google Scholar
S. Domejean-OrliaguetS. A. GanskyJ. D. Featherstone,
“Caries risk assessment in an educational environment,”
J. Dent. Educ., 70
(12), 1346
–1354
(2006). 0022-0337 Google Scholar
J. D. B. Featherstoneet al.,
“Chlorehexidine and fluoride therapy reduces caries risk,”
J. Dent. Res., 84A
(2005). JDREAF 0022-0345 Google Scholar
C. I. Hooveret al.,
“Effect of a caries management regimen on cariogenic bacterial population,”
J. Dent. Res., 83A
(2004). JDREAF 0022-0345 Google Scholar
J. D. Featherstone,
“The caries balance: the basis for caries management by risk assessment,”
Oral Health Prev. Dent., 2
(1), 259
–264
(2004). 1602-1622 Google Scholar
C. M. Mitropoulos,
“The use of fibre-optic transillumination in the diagnosis of posterior approximal caries in clinical trials,”
Caries Res., 19
(4), 379
–384
(1985). http://dx.doi.org/10.1159/000260870 CAREBK 0008-6568 Google Scholar
C. Deeryet al.,
“Prevalence of dental caries in Latvian 11- to 15-year-old children and the enhanced diagnostic yield of temporary tooth separation, FOTI and electronic caries measurement,”
Caries Res., 34
(1), 2
–7
(2000). http://dx.doi.org/10.1159/000016563 CAREBK 0008-6568 Google Scholar
D. F. CortesR. P. EllwoodK. R. Ekstrand,
“An in vitro comparison of a combined FOTI/visual examination of occlusal caries with other caries diagnostic methods and the effect of stain on their diagnostic performance,”
Caries Res., 37
(1), 8
–16
(2003). http://dx.doi.org/10.1159/000068230 CAREBK 0008-6568 Google Scholar
D. A. YoungJ. D. Featherstone,
“Digital imaging fiber-optic trans-illumination, F-speed radiographic film and depth of approximal lesions,”
J. Am. Dent. Assoc., 136
(12), 1682
–1687
(2005). 0002-8177 Google Scholar
J. Vaarkampet al.,
“Quantitative diagnosis of small approximal caries lesions utilizing wavelength-dependent fiber-optic transillumination,”
J. Dent. Res., 76
(4), 875
–882
(1997). http://dx.doi.org/10.1177/00220345970760040901 JDREAF 0022-0345 Google Scholar
A. Schneidermanet al.,
“Assessment of dental caries with Digital Imaging Fiber-Optic TransIllumination (DIFOTI): in vitro study,”
Caries Res., 31
(2), 103
–110
(1997). http://dx.doi.org/10.1159/000262384 CAREBK 0008-6568 Google Scholar
A. Lussiet al.,
“Performance and reproducibility of a laser fluorescence system for detection of occlusal caries in vitro,”
Caries Res., 33
(4), 261
–266
(1999). http://dx.doi.org/10.1159/000016527 Google Scholar
A. LussiR. HibstR. Paulus,
“DIAGNOdent: an optical method for caries detection,”
J. Dent. Res., 83C C80
–83
(2004). http://dx.doi.org/10.1177/154405910408301S16 JDREAF 0022-0345 Google Scholar
E. H. VerdonschotM. H. van der Veen,
“Lasers in dentistry 2. Diagnosis of dental caries with lasers,”
Ned Tijdschr Tandheelkd, 109
(4), 122
–126
(2002). Google Scholar
K. KonigG. FlemmingR. Hibst,
“Laser-induced autofluorescence spectroscopy of dental caries,”
Cell Mol. Biol. (Noisy-le-grand), 44
(8), 1293
–1300
(1998). Google Scholar
X. Q. ShiU. WelanderM. B. Angmar,
“Occlusal caries detection with KaVo DIAGNOdent and radiography: an in vitro comparison,”
Caries Res., 34
(2), 151
–158
(2000). http://dx.doi.org/10.1159/000016583 Google Scholar
X. Q. ShiS. TranaeusB. Angmar-Mansson,
“Validation of DIAGNOdent for quantification of smooth-surface caries: an in vitro study,”
Acta Odontol. Scand., 59
(2), 74
–78
(2001). http://dx.doi.org/10.1080/000163501750157153 AOSCAQ 0001-6357 Google Scholar
R. O. Rochaet al.,
“In vivo effectiveness of laser fluorescence compared to visual inspection and radiography for the detection of occlusal caries in primary teeth,”
Caries Res., 37
(6), 437
–441
(2003). http://dx.doi.org/10.1159/000073396 CAREBK 0008-6568 Google Scholar
A. AstvaldsdottirW. P. HolbrookS. Tranaeus,
“Consistency of DIAGNOdent instruments for clinical assessment of fissure caries,”
Acta Odontol. Scand., 62
(4), 193
–198
(2004). Google Scholar
S. Tranaeuset al.,
“In vivo validity and reliability of IR fluorescence measurements for caries detection and quantification,”
Swed. Dent. J., 28
(4), 173
–182
(2004). SDJOD5 Google Scholar
M. BamzahimA. AljehaniX. Q. Shi,
“Clinical performance of DIAGNOdent in the detection of secondary carious lesions,”
Acta Odontol. Scand., 63
(1), 26
–30
(2005). AOSCAQ 0001-6357 Google Scholar
V. Angneset al.,
“Clinical effectiveness of laser fluorescence, visual inspection and radiography in the detection of occlusal caries,”
Caries Res., 39
(6), 490
–495
(2005). http://dx.doi.org/10.1159/000088185 CAREBK 0008-6568 Google Scholar
A. Reiset al.,
“Performance of methods of occlusal caries detection in permanent teeth under clinical and laboratory conditions,”
J. Dent., 34
(2), 89
–96
(2006). http://dx.doi.org/10.1016/j.jdent.2005.04.002 JDENAB 0300-5712 Google Scholar
S. AkarsuH. Koprulu,
“In vivo comparison of the efficacy of DIAGNOdent by visual inspection and radiographic diagnostic techniques in the diagnosis of occlusal caries,”
J. Clin. Dent., 17
(3), 53
–58
(2006). Google Scholar
M. J. Altenburgeret al.,
“The evaluation of fluorescence changes after application of casein phosphopeptides (CPP) and amorphous calcium phosphate (ACP) on early carious lesions,”
Am. J. Dent., 23
(4), 188
–192
(2010). AJDEES Google Scholar
H. C. Benedict,
“A note on the fluorescence of teeth in ultraviolet rays,”
Science, 67
(1739), 442
(1928). http://dx.doi.org/10.1126/science.67.1739.442 SCIEAS 0036-8075 Google Scholar
U. Hafstrom-Bjorkmanet al.,
“Comparison of laser fluorescence and longitudinal microradiography for quantitative assessment of in vitro enamel caries,”
Caries Res., 26
(4), 241
–247
(1992). http://dx.doi.org/10.1159/000261446 CAREBK 0008-6568 Google Scholar
Z. Emamiet al.,
“Mineral loss in incipient caries lesions quantified with laser fluorescence and longitudinal microradiography. A methodologic study,”
Acta Odontol. Scand., 54
(1), 8
–13
(1996). http://dx.doi.org/10.3109/00016359609003502 AOSCAQ 0001-6357 Google Scholar
S. al-Khateebet al.,
“Quantification of formation and remineralization of artificial enamel lesions with a new portable fluorescence device,”
Adv. Dent. Res., 11
(4), 502
–506
(1997). Google Scholar
S. al-Khateebet al.,
“Laser fluorescence quantification of remineralisation in situ of incipient enamel lesions: influence of fluoride supplements,”
Caries Res., 31
(2), 132
–140
(1997). http://dx.doi.org/10.1159/000262388 CAREBK 0008-6568 Google Scholar
E. de Josselin de Jonget al.,
“A new method for in vivo quantification of changes in initial enamel caries with laser fluorescence,”
Caries Res., 29
(1), 2
–7
(1995). http://dx.doi.org/10.1159/000262032 CAREBK 0008-6568 Google Scholar
S. Al-Khateebet al.,
“A longitudinal laser fluorescence study of white spot lesions in orthodontic patients,”
Am. J. Orthod. Dentofacial. Orthop., 113
(6), 595
–602
(1998). http://dx.doi.org/10.1016/S0889-5406(98)70218-5 AJOOEB 0889-5406 Google Scholar
S. Tranaeuset al.,
“Application of quantitative light-induced fluorescence to monitor incipient lesions in caries-active children. A comparative study of remineralisation by fluoride varnish and professional cleaning,”
Eur. J. Oral Sci., 109
(2), 71
–75
(2001). http://dx.doi.org/10.1034/j.1600-0722.2001.00997.x EJOSFY 0909-8836 Google Scholar
S. Tranaeuset al.,
“In vivo repeatability and reproducibility of the quantitative light-induced fluorescence method,”
Caries Res., 36
(1), 3
–9
(2002). http://dx.doi.org/10.1159/000057583 CAREBK 0008-6568 Google Scholar
I. A. PrettyR. P. Ellwood,
“Comparison of paired visual assessment and software analyses of changes in caries status over six months from fluorescence images,”
Caries Res., 41
(2), 115
–120
(2007). http://dx.doi.org/10.1159/000098044 CAREBK 0008-6568 Google Scholar
W. Yinet al.,
“Reliability of quantitative laser fluorescence analysis of smooth surface lesions adjacent to the gingival tissues,”
Caries Res., 41
(3), 186
–189
(2007). http://dx.doi.org/10.1159/000099316 CAREBK 0008-6568 Google Scholar
A. G. Ferreira Zandonaet al.,
“An in vitro comparison between laser fluorescence and visual examination for detection of demineralization in occlusal pits and fissures,”
Caries Res., 32
(3), 210
–218
(1998). http://dx.doi.org/10.1159/000016455 CAREBK 0008-6568 Google Scholar
E. Terreret al.,
“A new concept in restorative dentistry: light-induced fluorescence evaluator for diagnosis and treatment. Part 1: Diagnosis and treatment of initial occlusal caries,”
J. Cont. Dent. Pract., 10
(6), E086
–094
(2009). 1526-3711 Google Scholar
E. Terreret al.,
“A new concept in restorative dentistry: LIFEDT-light-induced fluorescence evaluator for diagnosis and treatment: part 2—treatment of dentinal caries,”
J. Cont. Dent. Pract., 11
(1), E095
–102
(2010). 1526-3711 Google Scholar
G. E. WhiteA. TsamtsourisD. L. Williams,
“Early detection of occlusal caries by measuring the electrical resistance of the tooth,”
J. Dent. Res., 57
(2), 195
–200
(1978). http://dx.doi.org/10.1177/00220345780570020801 JDREAF 0022-0345 Google Scholar
K. R. EkstrandD. N. RickettsE. A. Kidd,
“Reproducibility and accuracy of three methods for assessment of demineralization depth of the occlusal surface: an in vitro examination,”
Caries Res., 31
(3), 224
–231
(1997). http://dx.doi.org/10.1159/000262404 CAREBK 0008-6568 Google Scholar
D. N. Rickettset al.,
“Histological validation of electrical resistance measurements in the diagnosis of occlusal caries,”
Caries Res., 30
(2), 148
–155
(1996). http://dx.doi.org/10.1159/000262152 CAREBK 0008-6568 Google Scholar
J. Kuhnisch,
“An in vitro comparison between two methods of electrical resistance measurement for occlusal caries detection,”
Caries Res., 40
(2), 104
–111
(2006). http://dx.doi.org/10.1159/000091055 CAREBK 0008-6568 Google Scholar
W. P. RockE. A. Kidd,
“The electronic detection of demineralisation in occlusal fissures,”
Br. Dent. J., 164
(8), 243
–247
(1988). http://dx.doi.org/10.1038/sj.bdj.4806415 BDJOAJ 0007-0610 Google Scholar
E. H. Verdonschotet al.,
“Performance of some diagnostic systems in examinations for small occlusal carious lesions,”
Caries Res., 26
(1), 59
–64
(1992). http://dx.doi.org/10.1159/000261429 CAREBK 0008-6568 Google Scholar
M. C. Huysmanset al.,
“Surface-specific electrical occlusal caries diagnosis: reproducibility, correlation with histological lesion depth, and tooth type dependence,”
Caries Res., 32
(5), 330
–336
(1998). http://dx.doi.org/10.1159/000016468 CAREBK 0008-6568 Google Scholar
D. Huanget al.,
“Optical coherence tomography,”
Science, 254
(5035), 1178
–1181
(1991). http://dx.doi.org/10.1126/science.1957169 SCIEAS 0036-8075 Google Scholar
A. F. Fercheret al.,
“In vivo optical coherence tomography,”
Am. J. Ophthalmol., 116
(1), 113
–114
(1993). AJOPAA 0002-9394 Google Scholar
G. J. Tearneyet al.,
“In vivo endoscopic optical biopsy with optical coherence tomography,”
Science, 276
(5321), 2037
–2039
(1997). http://dx.doi.org/10.1126/science.276.5321.2037 SCIEAS 0036-8075 Google Scholar
B. W. Colston Jr.et al.,
“Imaging of hard- and soft-tissue structure in the oral cavity by optical coherence tomography,”
Appl. Opt., 37
(16), 3582
–3585
(1998). http://dx.doi.org/10.1364/AO.37.003582 APOPAI 0003-6935 Google Scholar
J. G. Fujimotoet al.,
“High-resolution in vivo intra-arterial imaging with optical coherence tomography,”
Heart, 82
(2), 128
–133
(1999). 1355-6037 Google Scholar
D. Friedet al.,
“Imaging caries lesions and lesion progression with polarization sensitive optical coherence tomography,”
J. Biomed. Opt., 7
(4), 618
–627
(2002). http://dx.doi.org/10.1117/1.1509752 JBOPFO 1083-3668 Google Scholar
R. S. Joneset al.,
“Imaging artificial caries on the occlusal surfaces with polarization-sensitive optical coherence tomography,”
Caries Res., 40
(2), 81
–89
(2006). http://dx.doi.org/10.1159/000091052 CAREBK 0008-6568 Google Scholar
R. S. Joneset al.,
“Remineralization of in vitro dental caries assessed with polarization-sensitive optical coherence tomography,”
J. Biomed. Opt., 11
(1), 014016-1
–014016-9
(2006). http://dx.doi.org/10.1117/1.2161192 JBOPFO 1083-3668 Google Scholar
“Quantify Agreement with Kappa: Assess how well two observers classify subjects into groups,”
2011). http://www.graphpad.com/quickcalcs/kappa1.cfm Google Scholar
J. A. Swets,
“Measuring the accuracy of diagnostic systems,”
Science, 240
(4857), 1285
–1293
(1988). http://dx.doi.org/10.1126/science.3287615 SCIEAS 0036-8075 Google Scholar
(2005). Google Scholar
K. R. Ekstrandet al.,
“Relationship between external and histologic features of progressive stages of caries in the occlusal fossa,”
Caries Res., 29
(4), 243
–250
(1995). http://dx.doi.org/10.1159/000262076 CAREBK 0008-6568 Google Scholar
S. Tranaeuset al.,
“In vivo validity and reliability of IR fluorescence measurements for caries detection and quantification,”
Swed. Dent. J., 28
(4), 173
–182
(2004). SDJOD5 Google Scholar
F. M. Mendeset al.,
“Performance of DIAGNOdent for detection and quantification of smooth-surface caries in primary teeth,”
J. Dent., 33
(1), 79
–845
(2005). http://dx.doi.org/10.1016/j.jdent.2004.10.010 JDENAB 0300-5712 Google Scholar
A. AstvaldsdottirW. P. HolbrookS. Tranaeus,
“Consistency of DIAGNOdent instruments for clinical assessment of fissure caries,”
Acta Odontol. Scand., 62
(4), 193
–198
(2004). http://dx.doi.org/10.1080/00016350410001612 AOSCAQ 0001-6357 Google Scholar
A. Jablonski-Momeniet al.,
“Performance of laser fluorescence at tooth surface and histological section,”
Lasers Med. Sci., 26
(2), 171
–178
(2011). http://dx.doi.org/10.1007/s10103-010-0768-y 0268-8921 Google Scholar
A. Goel,
“Comparison of validity of DIAGNOdent with conventional methods for detection of occlusal caries in primary molars using the histological gold standard: an in vivo study,”
J. Indian Soc. Pedod. Prev. Dent., 27
(4), 227
–234
(2009). http://dx.doi.org/10.4103/0970-4388.57658 0970-4388 Google Scholar
W. ZhangC. McGrathE. C. Lo,
“A comparison of root caries diagnosis based on visual-tactile criteria and DIAGNOdent in vivo,”
J. Dent., 37
(7), 509
–513
(2009). http://dx.doi.org/10.1016/j.jdent.2009.03.009 JDENAB 0300-5712 Google Scholar
K. C. Huthet al.,
“Clinical performance of a new laser fluorescence device for detection of occlusal caries lesions in permanent molars,”
J. Dent., 36
(12), 1033
–1040
(2008). http://dx.doi.org/10.1016/j.jdent.2008.08.013 JDENAB 0300-5712 Google Scholar
V. AnttonenL. SeppaH. Hausen,
“Clinical study of the use of the laser fluorescence device DIAGNOdent for detection of occlusal caries in children,”
Caries Res., 37
(1), 17
–23
(2003). http://dx.doi.org/10.1159/000068227 CAREBK 0008-6568 Google Scholar
S. Eakleet al.,
“Clinical Evaluation of the DIAGNOdent Device,”
Early Detection of Dental Caries III Indiana. Conference 2003, Indiana University Press, Indiana
(2005). Google Scholar
J. D. BaderD. A. Shugars,
“A systematic review of the performance of a laser fluorescence device for detecting caries,”
J. Am. Dent. Assoc., 135
(10), 1413
–1426
(2004). 0002-8177 Google Scholar
M. S. De Benedettoet al.,
“Comparing the reliability of a new fluorescence camera with conventional laser fluorescence devices in detecting caries lesions in occlusal and smooth surfaces of primary teeth,”
Lasers Med. Sci., 26
(2), 157
–162
(2011). http://dx.doi.org/10.1007/s10103-010-0757-1 0268-8921 Google Scholar
A. Jablonski-Momeniet al.,
“Impact of measuring multiple or single occlusal lesions on estimates of diagnostic accuracy using fluorescence methods,”
Lasers Med. Sci., 27
(2), 343
–352
(2011). 0268-8921 Google Scholar
A. Jablonski-Momeniet al.,
“Performance of a fluorescence camera for detection of occlusal caries in vitro,”
Odontology/the Society of the Nippon Dental University, 99
(1), 55
–61
(2011). Google Scholar
A. C. Pereiraet al.,
“Validity of caries detection on occlusal surfaces and treatment decisions based on results from multiple caries-detection methods,”
Eur. J. Oral Sci., 117
(1), 51
–57
(2009). http://dx.doi.org/10.1111/eos.2009.117.issue-1 EJOSFY 0909-8836 Google Scholar
|