
|
|
1.IntroductionAtherosclerosis remains the leading cause of death worldwide.1 The macrophage is an important early cellular marker that provides information relevant to the risk of future rupture of atherosclerotic plaques. Macrophage infiltration into the intimal layer of plaques accelerates inflammation by releasing matrix metalloproteinases (MMPs), which erode the fibrous cap and make the plaques more prone to rupture.2,3 Lipid is another important constituent in the progression of atherosclerosis. After entering an activated endothelial layer, low-density lipoproteins (LDL) are taken up by macrophages which have entered the arterial wall. These LDL-loaded macrophages are observed in the lipid core as foam cells in postmortem vulnerable plaques.4,5 Since the vulnerability of plaques is related to cellular composition as well as anatomical structure,6 developing a diagnostic method that can simultaneously reveal both is critical to identify vulnerable plaques and would allow the determination of macrophage density in longitudinal studies in response to therapies without cutting tissue. Optical coherence tomography (OCT) has been demonstrated to visualize microstructural features such as fibrous cap and surface structure of atherosclerotic plaques with high resolution.7–10 Although Tearney et al. showed a correlation between OCT and histological measurements of macrophage density in the center of fibrous caps,11 and more recently, Liu et al. showed that micro-OCT is capable of detecting plaque-based macrophages with higher resolution,12 the specificity of OCT/micro-OCT alone to identify macrophages is limited by scattering contrast between macrophages, lipids and other plaque components such as crystals of cholesterol esters and microcalcifications. Photothermal wave (PTW) imaging is a potential screening tool for imaging and distinguishing macrophages and lipid deposits in atherosclerotic plaques. PTW imaging is based on absorption of light by targeted chromophores, which generate a periodic thermal modulation.13–15 Differences in optical absorption among tissue constituents provide contrast in PTW imaging.16 Multiwavelength PTW imaging can selectively visualize different chromophores in plaque that absorb at selected laser irradiation wavelengths. Multifrequency PTW imaging can localize chromophores at multiple depths due to different thermal diffusion lengths at selected modulation frequencies.17 The combination of PTW imaging and OCT may identify the distribution of macrophages and lipid deposits in the context of anatomical plaque structure in a single merged PTW-OCT image. No endogenous optical absorption contrast exists between macrophages and other plaque components. A novel gold nanoparticle called nanorose was developed by our group to serve as a macrophage targeting chromophore and has been shown to be taken up much more aggressively by macrophages than either aortic smooth-muscle cells or aortic endothelial cells.18 The 30-nm-diameter nanoroses are formed by kinetically controlled assembly of thin-gold-shell-coated iron oxide nanoparticles in aqueous medium. Nanoroses were injected intravenously, engulfed by plaque-based macrophages or blood-based monocytes due to a dextran coating,19 and utilized as a contrast agent for PTW imaging to identify macrophages. Broad (650 to 800 nm) near-infrared (NIR)absorption of nanorose with an absorption cross-section (in solution) of at a wavelength of 800 nm is achieved by the asymmetric core-shell geometry and plasmonic effects from close spacing between primary particles in the cluster [Fig. 1(a)]. Nanorose specificity is provided, since the absorption spectra of lipid and other plaque components are known to nadir at 800 nm,20 while nanorose has high absorption at this wavelength. Moreover, since fatty acids have a local absorption maxima around 1210 nm, while the absorption of water is relatively lower and nearly constant in this spectral range [Fig. 1(b)],21,22 lasers that emit at wavelengths of 800 and 1210 nm were selected to target nanorose and lipid respectively in PTW imaging. Nanorose concentration of , approximately equal to that on plaque surfaces in our ex vivo animal studies, was measured; and corresponding nanorose absorption coefficient spectrum is shown in Fig. 1(b). Fig. 1(a) Absorbance spectrum of nanorose colloidal suspension. Inset shows a scanning electron microscopy image of a single nanorose cluster. (b) Absorption coefficient spectra of arterial tissues, lipid, water and nanorose. Nanorose concentration was typical of that found inside macrophages on plaque surface, based on surface radiometric temperature measurement in response to a pulsed laser irradiation at 800 nm.23 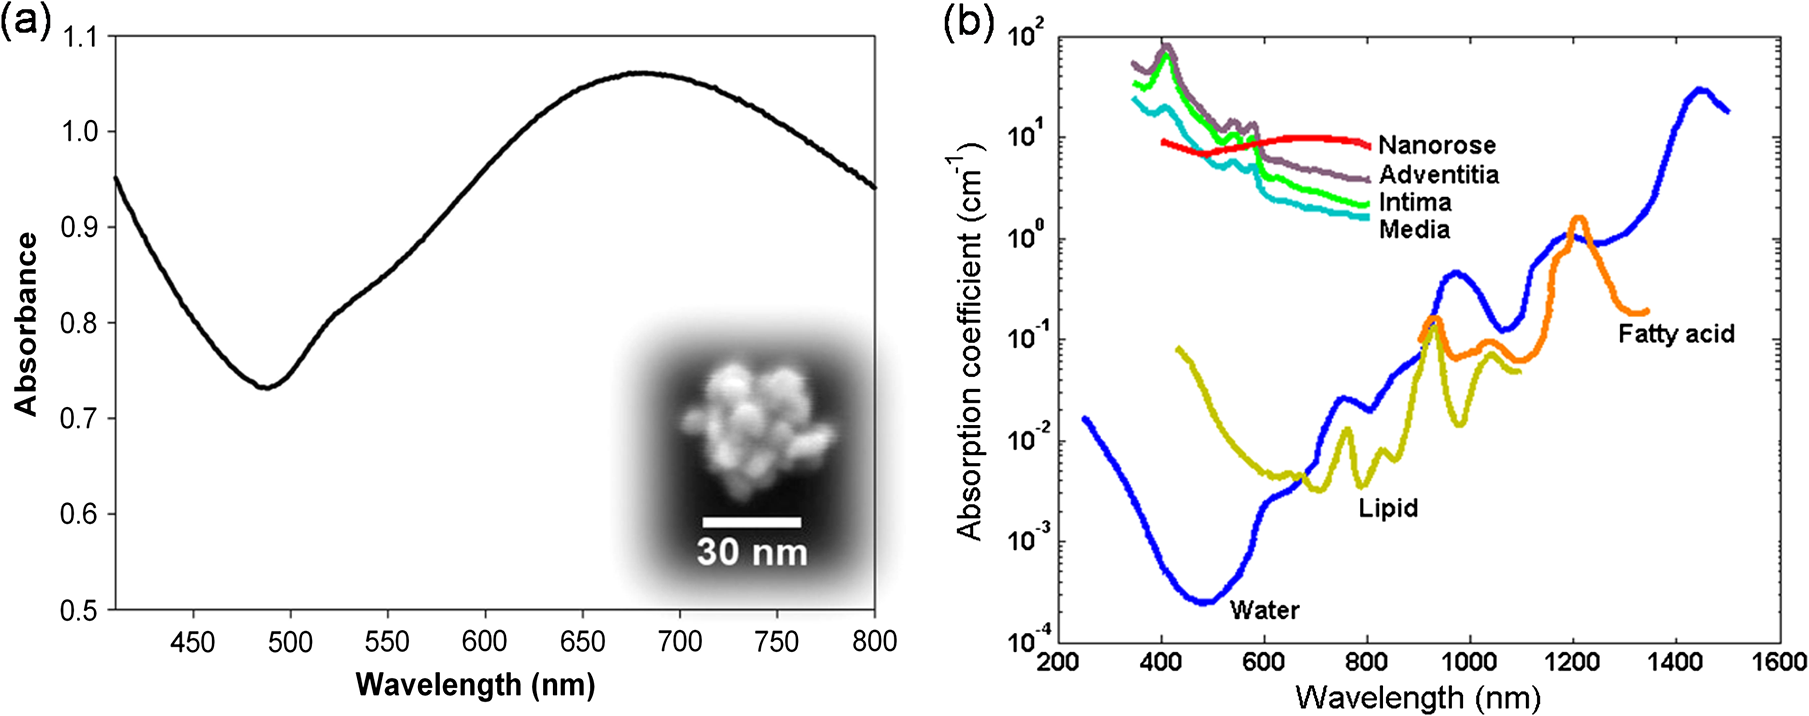 In this study, we demonstrate for the first time that combined PTW-OCT imaging can identify nanorose-loaded macrophages and lipid deposits in a rabbit atherosclerosis model. Presence of nanorose-loaded macrophages was confirmed by colocalization of two-photon luminescence (TPL) microscopy of nanorose and RAM-11 stain of macrophages in histological sections. Our results suggest that nanorose-loaded macrophages are: 1. localized at the shoulders on the upstream side of atherosclerotic plaques associated with lipid deposits; and 2. detected superficially within 20 μm of plaque surface. This approach could be used to characterize the distribution of nanorose-loaded macrophages and lipid deposits in atherosclerotic plaques. 2.Materials and Methods2.1.Macrophage Cell CultureTo demonstrate nanorose uptake by macrophages, C57/BLK6 mouse peritoneal macrophages were incubated with nanorose suspension. Macrophage cells were cultivated in Dulbecco’s modified Eagle’s medium (DMEM) supplemented with 10% fetal bovine serum (FBS), L-glutamine (2 mM), penicillin () and streptomycin () at 37°C in 5% . To load cells with nanorose, macrophages were incubated with nanorose suspension (approximately ) in phenol-red-free and serum-free DMEM overnight. Nanorose-loaded macrophages and control macrophages without nanorose were imaged by transmission electron microscopy (TEM). 2.2.Preparation of Rabbit Arterial TissuesA rabbit animal model of atherosclerosis was used to create macrophage-rich atherosclerotic plaques in the aorta.24 Nine male New Zealand white rabbits were fed a 0.25% cholesterol chow for six months. Six rabbits (positive group) were sacrificed three days following marginal ear vein injection with nanorose (1.4 mg Au/kg rabbit body weight) as done previously.25 The dose of nanorose injection used in this study is comparable to the current Food and Drug Administration (FDA)-approved value of 100 mg for a single injection of gold sodium thiomalate (per a 70 kg human body) used in the treatment of rheumatoid arthritis.26 The remaining three rabbits (control group) were sacrificed three days following saline injection. The aortas were harvested, cut open, flushed clean of red blood cells and placed in sample containers with saline and stored at 4°C before use. Several plaque segments (about ) were harvested from the aortas (44 plaque segments from the positive group and 30 plaque segments from the control group) and positioned en face onto glass-slide sample holders with the luminal side face up to be imaged by PTW imaging and OCT. Orthogonally oriented tape rulers affixed to sample holders indicated coordinate positions of plaque segments so that recorded PTW and OCT images could be coregistered. All imaging experiments were completed within 12 h after animal sacrifice. The animal protocol was approved by the Institutional Animal Care and Use Committee at the University of Texas Health Science Center at San Antonio. 2.3.Imaging Systems2.3.1.PTW ImagingSchematic diagram of a custom-built PTW imaging system used in this study is presented in Fig. 2(a). Two lens-coupled fiber-optic lasers (FCTS/B, Opto Power; 1200-001, Candela) that emit at wavelengths of 800 and 1210 nm respectively with radiant output power of 0.25 W were used to irradiate plaque segments to induce PTWs. A 50-mm-diameter lens () was used to focus the laser beam to a 1-cm-diameter spot size on the plaque segments. A mechanical shutter controlled by a function generator (not shown in Fig. 3) intensity-modulated continuous laser light at fixed frequencies (0.1, 1, and 4 Hz) with a 50% duty cycle. The infrared (IR) signal (radiometric temperature) emitted from plaque surface was reflected by a dichroic beam splitter and recorded by an IR camera (SC6000 with an InSb detector (3.0 to 5.0 μm), FLIR) over a 20-second time period at a frame acquisition rate of 25.6 Hz. The extraction of amplitude and phase PTW images () at each modulation frequency was performed by computing a fast Fourier transform (FFT) at each pixel of the recorded temporal IR image sequence. 2.3.2.OCTA swept-source (SS) laser (HSL-1000, Santec) with center wavelength of 1060 nm and a bandwidth of 80 nm scanning at a repetition rate of 34 kHz was used in the custom-built intensity OCT system [Fig. 2(b)]. Power at the sample arm was 1.2 mW. The measured free-space axial resolution was 20 μm with a 2.8 mm scan depth. The OCT signal was sampled with a linear k-space sampling clock to allow real-time OCT image acquisition and display. The linear k-space clock was generated from a portion of the source light directed into a Mach-Zehnder interferometer and detected by a balanced detector. This clock signal was filtered, frequency-quadrupled and used as the input to the external clock port of the analog-to-digital converter (ADC) card. The laser sweep rate governs the A-scan rate of 34 kHz, and images were acquired at a rate of 68 B-scans per second with 500 A-scans per B-scan. 2.3.3.TPL MicroscopyMeasurements of TPL from nanoroses were performed using the custom-built NIR laser-scanning multiphoton microscope described in a previous study.27 As the TPL excitation source, a femtosecond Ti:Sapphire laser (Mira 900, Coherent) with excitation wavelength of 800 nm was used. The laser beam entering the microscope was modulated by an acousto-optic modulator (AOM: 23080-1, NEOS Technologies). The focal volume of the objective lens (, , water emersion, Olympus) was scanned along the sample in the plane using a pair of galvanometric scanning mirrors (6215HB, Cambridge Technology) to produce two-dimensional images. TPL from plaque segments was detected by two photomultiplier tubes (PMT1: H7422P-40, PMT2: H7422P-50, Hammamtsu) through a dichroic beam splitter (FF735-Di01, Semrock). TPL emission spectra (in response to 800 nm excitation) of plaque components such as collagen, elastin fibers, oxidized-LDL, neutral lipid and calcification are well below 650 nm,28–30 while nanorose has intensive and broad luminescence emission within the wavelength band of 650 to 750 nm. Endogenous plaque fluorescence and nanorose luminescence were separated by a long-pass filter (E570LP, Chroma Technology) with reflection wavelengths shorter than 570 nm and a band-pass filter (HQ700/75m, Chroma Technology) with center wavelength of 700 nm. Wavelengths shorter than 570 nm from endogenous plaque fluorescence were collected by PMT1. Wavelengths longer than 570 nm from nanorose luminescence transmitted through the band-pass filter and were collected by PMT2. The average Ti:Sapphire-laser power incident at the tissue surface was 20 mW, and no nanorose damage or photobleaching effect was observed during imaging. 2.4.Histology AnalysisAorta sections (5 μm in thickness) were immersion-fixed in formalin, processed with paraffin embedding and stained with RAM-11,31 a marker of rabbit macrophage cytoplasm. 2.5.Statistical AnalysisStatistical analysis was performed using SPSS Software for Windows (Version 19.0.0, SPSS). Radiometric temperature increase of plaque is given as mean temperature increase per excitation pulse over specific regions (nanorose regions in the positive group and plaque regions with no nanorose in the control group) in each plaque segment using PTW imaging. The comparison of superficial nanorose distribution in plaques is given as an area percentage of nanorose at plaque shoulders on the upstream versus downstream side. A two-tailed independent-sample student’s test was performed for comparison of mean temperature increase of plaques from positive and control groups. The findings of nanorose distribution in plaques from the positive group were compared by applying a two-tailed paired-sample student’s test. A two-tailed value less than 0.05 was considered statistically significant for both tests. 2.6.Analysis of Area Percentage of Nanorose in PlaquesArea percentage of nanorose at plaque shoulders on the upstream versus downstream side in each plaque segment () in the positive group was calculated according to the ratio of nanorose pixel number defined by the pixel number of nanorose at plaque shoulders on the upstream versus downstream side, respectively, to a total pixel number of nanorose in each plaque segment. ImageJ software was used for the percentage measurement. Data are presented as mean ± standard deviation. 3.Results3.1.Nanorose Uptake by MacrophagesAfter 24-hour macrophage incubation, nanoroses are observed to accumulate in lysosomes inside macrophages [Fig. 3(a)]. Nanoroses are not localized in all lysosomes but appear more frequently in those close to the cell surface. Both single nanorose and nanorose clusters are observed [inset in Fig. 3(a)], suggesting that nanoparticle aggregation occurs during macrophage internalization. Dense accumulation of nanoroses in lysosomes indicates substantial macrophage endocytosis of 30-nm dextran-coated nanorose in cell culture. 3.2.Nanorose Identification by TPL Microscopy in Histological SectionsTPL microscopy was used to identify the presence of nanorose in unstained histological sections (5 μm in thickness) excised from plaque segments in the positive group. To demonstrate plaque fluorescence and nanorose luminescence simultaneously, TPL images from the two PMTs were recorded separately and merged into a single image. Figure 4(a) illustrates a TPL image of plaque measured with emission wavelengths shorter than 570 nm. Figure 4(b) shows nanorose TPL collected through a 700 nm band-pass filter. These two images collected in separate emission wavelengths were assigned to different channels (plaque: green channel; nanorose: red channel) and merged [Fig. 4(c)]. In images presented throughout the remainder of this manuscript, endogenous fluorescence from plaque is green while luminescence from nanorose is red. Fig. 4Coregistered TPL images of an unstained histological section of plaque from the positive group. (a) TPL images of plaque measured at emission wavelengths shorter than 570 nm (green). (b) TPL images of nanoroses measured via a 700-nm band-pass filter (red). (c) Merged image of (a) and (b). Yellow arrows in (c) point to nanorose locations. [“SP”: short-pass (); “BP”: band-pass ()].  3.3.PTW Imaging of Superficial Nanoroses and Lipid Deposits in Atherosclerotic PlaquesPlaque segments from positive and control groups were irradiated by 800- and 1210-nm laser radiation at a frequency of 4 Hz to generate PTWs from superficial chromophores (nanoroses and lipid deposits that are within 100 μm in depth from plaque surface). Amplitude and phase PTW images at a modulation frequency of 4 Hz were computed (Fig. 5). Location of stronger light absorption corresponding to nanoroses can be identified in both amplitude and phase PTW images at 800 nm [Figs. 5(a) and (5e)], and shapes of plaque lesions and lipid deposits are revealed at 1210 nm [Figs. 5(b), 5(d), 5(f) and 5(h)]. Phase PTW images not only show locations of nanoroses and lipid deposits, but also reveal depth information as the gray scale assigns darker colors to smaller phase values [Figs. 5(e) and 5(h)]. Because amplitude PTW images have better contrast and SNR than phase images, amplitude PTW images were used for further image analysis. Fig. 5Amplitude (a, b, c, d) and phase (e, f, g, h) PTW images of atherosclerotic plaques from positive and control groups respectively at 800- and 1210-nm laser irradiation. Laser modulation frequency is 4 Hz. Red arrows point to the position of nanoroses in (a) and lipid deposits in (b) and (d). Red squares indicate regions with and without nanorose in (a) and (c) respectively. Scale bar is the same in (a, b, e, f) and (c, d, g, h) respectively.  Radiometric temperature increase in 44 plaque segments from the positive group and 30 plaque segments from the control group were compared to determine the presence of nanorose and to distinguish nanorose from plaque. Figure 6(a) shows the average radiometric temperature response from red-square areas in Figs. 5(a) and 5(c). The highest radiometric temperature increase and modulation amplitude were observed in regions with nanorose aggregation from the positive group over the first ten seconds after laser irradiation. In contrast, a much lower radiometric temperature increase and smaller modulation amplitude were observed in the control group. Figure 6(b) shows the comparison of mean radiometric-temperature increase per excitation pulse at regions with (red) and without (blue) nanorose in all plaque segments from positive and control groups respectively. An independent-sample student’s test reveals a significantly higher mean radiometric-temperature increase per excitation pulse at nanorose regions in the positive group compared to the control group (). Fig. 6(a) Average radiometric temperature increase in response to 800-nm laser irradiation at a modulation frequency of 4 Hz measured from plaque area containing nanorose [bright regions in the red square in Fig. 5(a)] in the positive group and area with no nanorose [red square in Fig. 5(c)] in the control group. (b) Radiometric temperature increase per pulse at a laser modulation frequency of 4 Hz from all plaque segments in positive and control groups, respectively. Data are given as .  Overlay of 800- and 1210-nm amplitude PTW images from Figs. 5(a) and 5(b) shows the relative spatial distribution of nanorose and lipid deposits [Fig. 7(a)]. Red regions in Fig. 7(a) show locations of superficial nanorose aggregates as detected by PTW imaging at 800 nm. Detected regions of nanorose correspond to the edges of superficial lipid deposits. Nanorose is not present at all lipid edges but at discrete locations (e.g., 1B, 1C, 2A, 3B, 3C) in Fig. 7(a). The blue dashed line represents a region with nanorose accumulation in the overlay image [Fig. 7(a)], consistent with the histological section from the same region where a dense accumulation of macrophages is identified by RAM-11 stain [Fig. 7(b)]. In contrast, macrophages are not observed [Fig. 7(c)] in regions with no PTW signals from nanorose [yellow dashed line in Fig. 7(a)]. Fig. 7(a) Overlay of amplitude PTW images from Fig. 5(a) and 5(b). Red color indicates nanorose. (b,c) Histological sections of plaque from the positive group with RAM-11 stain along blue and yellow dashed lines representing regions with and without nanorose accumulation respectively in (a). (d) Histological section of plaque from the control group with RAM-11 stain. Brown color in (b) and (d) indicates macrophages. (e,f,g), (h,i,j), (k,l,m) Merged TPL images of unstained histological section adjacent to the section in (b), (c) and (d) respectively. Red square region in (b), (c) and (d) corresponds to (e), (h) and (k) respectively. Yellow square region in (e), (h) and (k) corresponds to (f), (i) and (l) respectively. Blue square region in (f), (i) and (l) corresponds to (g), (j) and (m) respectively. Inset in (g) shows colocalized RAM-11 stain of (g) magnified from (b). Yellow arrows in (g) point to nanorose locations. Yellow arrow heads in (m) point to lipid droplets. Yellow circle in (m) indicates clusters of macrophages. 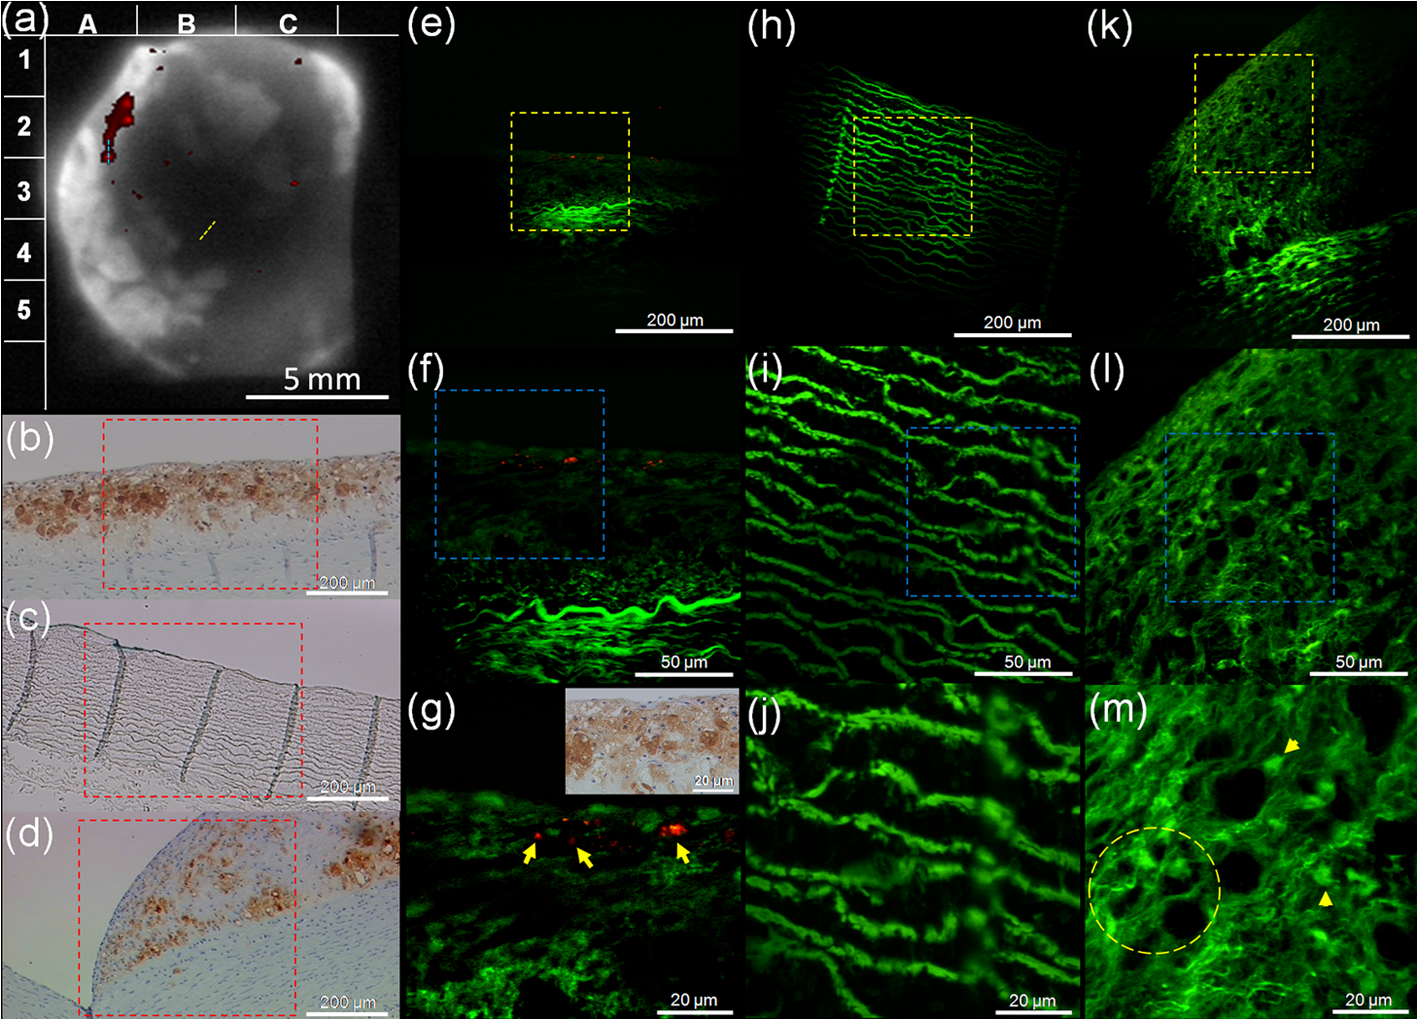 Merged TPL images from an unstained histological section adjacent to the section in Fig. 7(b) are shown in Fig. 7(e) through 7(g) with increased magnification. Strong TPL signals from nanorose are observed [red color pointed by yellow arrows in Fig. 7(g)]. Endogenous plaque fluorescence, which may originate from elastin fibers and collagen,28,30,32 is also observed in the plaque [green color in Fig. 7(e)–7(j)]. Nanoroses identified by TPL microscopy co-localize with superficial macrophages [Fig. 7(g)], indicating that PTW signals at 800 nm laser irradiation are generated by nanorose-loaded macrophages. The size of nanorose aggregations in macrophages varies from less than 1 μm to about 10 μm [Fig. 7(g)], suggesting that the concentration of engulfed nanoroses in macrophages is variable. Although macrophages are observed as deep as 200 μm from the plaque surface [Fig. 7(b)], nanorose distribution is restricted within the first 20 μm [Fig. 7(g)]. This observation may suggest that the nanorose-loaded macrophages mostly reside in the very superficial regions of intima and have not migrated to deeper locations up to three days after intravenous nanorose injection. In a region of the same plaque segment from the positive group where no PTW signals from nanorose are detected [Fig. 7(c)], only endogenous plaque fluorescence from elastin fibers is observed [Figs. 7(h)–7(j)]. A histological section of plaque from the control group with a dense accumulation of macrophages [Fig. 7(d)] was also imaged by TPL microscopy [Figs. 7(k)–7(m)]. Fluorescence from elastin fibers is detected. Moreover, macrophage-like cellular structures with dark nuclei (indicated by a yellow circle) and possibly lipid droplets in or outside macrophages (pointed by yellow arrow heads) are observed in Fig. 7(m).33,34 3.4.Multifrequency PTW Imaging in Combination with OCTDetection of chromophores located deeper in the tissue using PTW imaging requires reduced laser modulation frequencies. Therefore, laser modulation frequencies of 0.1 and 1 Hz were applied to visualize deeper nanorose-loaded macrophages and lipid deposits (600- and 200-μm thermal-diffusion lengths in response to 0.1 and 1 Hz laser modulation frequencies respectively). In Fig. 8, amplitude PTW images at three modulation frequencies are shown. At 800-nm laser irradiation, nanoroses produce the strongest PTW signals at 4 Hz [Fig. 8(c)], much weaker at 1 Hz [Fig. 8(b)] and negligible signal contrast at 0.1 Hz [Fig. 8(a)], suggesting that nanorose-loaded macrophages are primarily superficially distributed in the plaque (i.e., ), consistent with merged TPL microscopy images [red color in Figs. 8(i)–8(k)]. Fig. 8(a,b,c,d,e,f) Amplitude PTW images of a plaque segment from the positive group at 800- and 1210-nm laser irradiation, respectively. Laser modulation frequencies are respectively 0.1, 1 and 4 Hz with corresponding thermal diffusion lengths of 600, 200 and 100 μm. Black arrows point to lipid deposits in (d), (e) and (f). (g) Coregistered and merged PTW-OCT image (Video 1). Red, yellow and green colors in (g) represent respectively nanorose-loaded macrophages, lipid deposits and both. White arrows point to peak (P) and valley (V) regions of the plaque in (g). Red arrows above (g) indicate direction of blood flow. (h) Histological section with RAM-11 stain along blue dashed line representing a region with nanorose accumulation in (g). (i, j, k) Merged TPL images of unstained histological section adjacent to the section in (h). (i), (j) and (k) respectively represent red, yellow and blue square region in (h), (i) and (j). (l) Area percentage of nanorose at shoulders on the upstream versus downstream side of the plaques () from the positive group. Larger area percentages of nanorose are observed at plaque shoulders on the upstream side (). Yellow arrows in (k) point to nanorose locations. (Video 1, MPEG, 2.5 MB). [URL: http://dx.doi.org/10.1117/1.JBO.17.3.036009.1].  At 1210-nm laser irradiation, lipid deposits produce strong PTW signals at all three frequencies, denoted by black arrows in Figs. 8(d) and 8(f). This observation indicates that lipid deposits distribute over multiple depths in the plaque. The bright region where the arrow points in Fig. 8(d) reveals the location of a lipid core in the plaque. Amplitude PTW images at lower modulation frequencies [Figs. 8(a), 8(b), 8(d), 8(e)] appear more blurred than images at higher frequency [Figs. 8(c) and 8(f)] due to greater lateral heat diffusion in the plaque. Amplitude PTW images at a modulation frequency of 4 Hz [Figs. 8(c) and 8(f)] were merged into a coregistered OCT image [Fig. 8(g)]. The merged PTW-OCT image shows a topographic surface structure of the plaque. Peak (P) and valley (V) regions are observed. The blue dashed line in the merged PTW-OCT image represents a region with nanorose accumulation, consistent with the histological section from the same region, where a dense accumulation of macrophages is identified [Fig. 8(h)]. Merged TPL images from an unstained histological section adjacent to the section in Fig. 8(h) are shown in Fig. 8(i) through 8(k). Strong TPL signals from nanorose are observed within 20 μm from plaque surface [Fig. 8(k)] and endogenous plaque fluorescence from elastin fibers and lipid droplets is also observed [Fig. 8(j)]. Interestingly, Fig. 8(g) shows that superficial lipid deposits are surrounded by nanorose-loaded macrophages located close to the shoulders of the plaque. The relative distribution of nanorose-loaded macrophages to lipid deposits is consistent with that in Fig. 7(a) and observed repeatedly in other plaques (19 of 44 plaque segments (43%) in the positive group). Of note is that the direction of blood flow in the live animal is from top to bottom in the image, as depicted by red arrows above Fig. 8(g). 4.DiscussionThe presently employed imaging contrast agent, nanorose, represents a novel gold nanoparticle that is taken up by macrophages. Many investigators have noted that particle size is an important factor in cellular uptake of gold nanoparticles. Chithrani et al. observed that gold-nanoparticle endocytosis by Hela cells is strongly size dependent, with higher uptake rates for particle sizes between 30 and 60 nm.35 Recently, Jiang et al. showed that the internalization of Herceptin-gold nanoparticles by human breast-cancer cells was most efficient at 25- to 50-nm size range.36 Furthermore, larger nanoparticles tend to have a short blood half-life and are quickly removed from circulation by liver and spleen.37 In contrast, smaller nanoparticles have a longer blood residence time, giving greater chance of being taken up by circulating blood-based monocytes and plaque-based macrophages.38 Therefore, nanorose with a 30-nm particle size and non-ionic dextran coating is potentially effective to increase macrophage uptake and decrease opsonization and subsequent removal by liver and spleen. In this study, a three-day interval between nanorose injection and PTW-OCT imaging was used to ensure nanorose uptake by macrophages. However, this time interval may not be clinically optimal. Interestingly, magnetic susceptibility artifacts induced by the injected ferumoxtran-10 (one type of ultrasmall superparamagnetic nanoparticles of iron oxide) have been detected optimally in the carotid arteries of patients 24 to 48 h after the injection, while almost no signal contrast was observed at 72 h,39 a result which suggests that shorter time intervals may be considered in future studies. In this study, the majority of nanoroses observed were found to be superficial and localized at the shoulders of plaques, especially on the upstream side of lesions, suggesting that macrophages which had engulfed the nanorose were colocalized at these regions. A paired-sample student’s test reveals a significantly larger area percentage of nanorose at shoulders on the upstream compared to the downstream side () of the plaques [Fig. 8(l)]. This finding is consistent with a previous study by Dirksen et al., who showed that 67% of the 33 human carotid plaques collected contained more macrophages in upstream shoulder regions where higher flow rate and higher shear stress prevails.40 Recently, a review by Slager et al. confirmed that macrophages predominate on the upstream side of the plaque induced by high shear stress.41 In fact, increased expression of MMPs by macrophages in plaques appears to be restricted to shoulder regions of plaques.42–45 Moreover, rupture of atherosclerotic plaques has been reported to occur predominantly at macrophage-rich shoulders of the plaque’s fibrous cap.40,46–48 Therefore, the observation of high density of nanorose, engulfed by macrophages, at plaque shoulders on the upstream side in our study demonstrates that a combined PTW-OCT imaging approach with nanorose as a contrast agent has predictive value for plaque vulnerability. Most nanoroses detected by TPL microscopy were superficial, within 20 μm from plaque surface. However, RAM-11 stained macrophages were distributed as deep as 200 μm. This observation suggests that only superficial macrophages in the plaque took up nanorose. Macrophages that already migrate into deeper locations may not be able to take up nanorose either, because nanorose cannot penetrate deeply into the intima, or because probability of nanorose’s delivery through the vasa vasorum is low or does not occur. Moreover, apoptotic and necrotic macrophages contribute to lipid core formation in plaques,49 and these macrophage debris could stain RAM-11 positive but are not intact and are unable to take up free nanorose in situ. Although nanorose uptake by macrophages has been identified in our cell culture study (Fig. 3), the transport pathway of nanorose to plaque-based macrophages is not clear. Previous studies have proposed three mechanisms for transport of superparamagnetic nanoparticles to arterial tissue:50–53 1. nanoparticles are endocytosed by activated blood monocytes which migrate through the lumen into the intimal surface; 2. transcytosis of nanoparticles across the endothelium and into the intima followed by uptake by in situ macrophages; and 3. diffusion of individual nanoparticles into the adventitia via the vasa vasorum. Our PTW imaging (at 0.1-Hz laser modulation) and TPL microscopy results of a plaque segment [Fig. 8(a)] and histological section [Fig. 8(i)], respectively, show that nanorose is not detected at deeper plaque locations (e.g., 100 to 600 μm), suggesting that nanorose transport via the vasa vasorum may not have occurred in our study. Interestingly, TPL images of a histological section of plaque from the positive group show a “snapshot” of a nanorose-loaded monocyte-like cell entering the plaque surface (Fig. 9). Sparsely distributed nanoroses are visible inside the cell. This image suggests that nanoroses can be first endocytosed by monocytes in the blood stream and then enter the plaques through the lumen. However, further study is needed to determine the relative contributions of these proposed mechanisms to enhance the clinical value of PTW-OCT imaging. Fig. 9Coregistered TPL images of a nanorose-loaded monocyte-like cell entering the plaque surface from an unstained histological slice of plaque from the positive group. (a) TPL images of plaque measured at emission wavelengths shorter than 570 nm (green). (b) TPL images of nanoroses measured via a 700-nm band-pass filter (red). (c) Merged image of (a) and (b). Yellow arrow in (c) points to nanorose location. (“SP”: short-pass (); “BP”: band-pass ()).  We demonstrate for the first time that dual-wavelength multifrequency PTW imaging can be used to detect and distinguish plaque components. With excitation wavelengths that match high-absorption spectral regions of different chromophores in atherosclerotic plaques, PTW imaging provides contrast for nanorose-loaded macrophages and lipid deposits. Moreover, axial distribution of nanorose-loaded macrophages and lipid deposits can be determined at selected laser modulation frequencies, giving additional diagnostic information of atherosclerotic plaques, such as macrophage infiltration depth and lipid core location. Although OCT shows tomographic plaque surface structure and is able to resolve fibrous caps (usually less than 65 μm in thickness), this imaging method alone does not provide specificity for macrophages and lipid deposits due to lack of scattering contrast among different plaque components. Merged tomographic PTW-OCT images can simultaneously reveal plaque composition with respect to plaque surface structure, a function which substantially enhances the capability of OCT in the study of characterizing plaque components and allows observation of known biological phenomena (e.g., macrophages distributed at shoulders on the upstream side of atherosclerotic plaques). From a clinical perspective, imaging macrophages and lipid deposits in the context of plaque surface structure offers the ability to identify plaque regions more prone to rupture. Our study utilized ex vivo tissues, and the clinical translation of combined PTW-OCT imaging would face many implementation challenges. Beard et al. demonstrated an optical-fiber photoacoustic-photothermal probe54 which has the potential to perform intravascular PTW imaging. Recently, photothermal OCT systems25,55–57 have been reported to record optical pathlength variation due to thermalelastic and thermorefractive changes induced by absorption of incident radiation. Both candidate approaches require engineering development to incorporate into an intravascular catheter. The motivation for future development of intravascular PTW imaging in combination with an OCT catheter58,59 during heart catheterization to detect nanorose-loaded macrophages and lipid deposits in plaques in vivo appears promising. Intravascular PTW-OCT imaging using nanorose as a contrast agent could allow clinical studies that monitor nanorose-loaded macrophages in response to various therapeutic interventions in vivo. Such an imaging tool would be of value to determine macrophage and lipid density over time rather than the current standard of autopsy studies, which provide a single time point measurement. 5.ConclusionBy utilizing PTW imaging in response to 800- and 1210-nm laser irradiation, we demonstrated detection of PTW signals from nanorose and lipid deposits in atherosclerotic plaques. Moreover, multifrequency (0.1, 1 and 4 Hz) PTW imaging can be used to distinguish nanorose and lipid deposits distributed at different depths. Nanorose presence was also identified with TPL microscopy on histological sections. Colocalization of nanorose shown in TPL microscopy with RAM-11 stained macrophages suggests that PTW signals at 800-nm laser irradiation is generated by superficial nanorose-loaded macrophages. Amplitude PTW images (800 and 1210 nm) at a modulation frequency of 4 Hz merged with a coregistered OCT image demonstrated the location and distribution of superficial nanorose-loaded macrophages and lipid deposits with respect to plaque surface structure and direction of blood flow. Our results suggest that nanorose-loaded macrophages are distributed at plaque shoulders on the upstream side, at edges of lipid deposits and superficially located (within 20 μm from plaque surface). This ex vivo animal study suggests that combined PTW-OCT imaging is a promising imaging approach for multidepth screening of nanorose-loaded macrophages and lipid deposits in atherosclerotic plaques. AcknowledgmentsThe authors would like to acknowledge the technical support from the University of Texas Health Science Center at San Antonio. This work was supported by a Veterans Administration merit grant to Feldman, a Welch Foundation grant F-1319 and NSF grant CBET-0968038 to Johnston, and the Department of Energy Center for Frontiers of Subsurface Energy Security. ReferencesS. Yusufet al.,
“Global burden of cardiovascular diseases: part I: general considerations, the epidemiologic transition, risk factors, and impact of urbanization,”
Circulation, 104
(22), 2746
–2753
(2001). http://dx.doi.org/10.1161/hc4601.099487 CIRCAZ 0009-7322 Google Scholar
E. FalkP. K. ShahV. Fuster,
“Coronary plaque disruption,”
Circulation, 92
(3), 657
–671
(1995). CIRCAZ 0009-7322 Google Scholar
F. D. Kolodgieet al.,
“Pathologic assessment of the vulnerable human coronary plaque,”
Heart, 90
(132), 1385
–1391
(2004). http://dx.doi.org/10.1136/hrt.2004.041798 1355-6037 Google Scholar
M. J. DaviesA. Thomas,
“Thrombosis and acute coronary-artery lesions in sudden cardiac ischemic death,”
N. Engl. J. Med., 310
(18), 1137
–1140
(1984). http://dx.doi.org/10.1056/NEJM198405033101801 NEJMAG 0028-4793 Google Scholar
E. Falk,
“Pathogenesis of atherosclerosis,”
J. Am. Coll. Cardiol., 47
(8 Suppl), C7
–C12
(2006). http://dx.doi.org/10.1016/j.jacc.2005.09.068 JACCDI 0735-1097 Google Scholar
J. SanzZ. A. Fayad,
“Imaging of atherosclerotic cardiovascular disease,”
Nature, 451
(7181), 953
–957
(2008). http://dx.doi.org/10.1038/nature06803 NATUAS 0028-0836 Google Scholar
M. E. Brezinskiet al.,
“Imaging of coronary artery microstructure (in vitro) with optical coherence tomography,”
Am. J. Cardiol., 77
(1), 92
–93
(1996). http://dx.doi.org/10.1016/S0002-9149(97)89143-6 AJNCE4 0258-4425 Google Scholar
O. C. Raffelet al.,
“Relationship between a systemic inflammatory marker, plaque inflammation, and plaque characteristics determined by intravascular optical coherence tomography,”
Arterioscler. Thromb. Vasc. Biol., 27
(8), 1820
–1827
(2007). http://dx.doi.org/10.1161/ATVBAHA.107.145987 1079-5642 Google Scholar
A. Tanakaet al.,
“Morphology of exertion-triggered plaque rupture in patients with acute coronary syndrome: an optical coherence tomography study,”
Circulation, 118
(23), 2368
–2373
(2008). http://dx.doi.org/10.1161/CIRCULATIONAHA.108.782540 CIRCAZ 0009-7322 Google Scholar
D. Vancraeynestet al.,
“Imaging the vulnerable plaque,”
J. Am. Coll. Cardiol., 57
(20), 1961
–1979
(2011). http://dx.doi.org/10.1016/j.jacc.2011.02.018 JACCDI 0735-1097 Google Scholar
G. J. Tearneyet al.,
“Quantification of macrophage content in atherosclerotic plaques by optical coherence tomography,”
Circulation, 107
(1), 113
–119
(2003). http://dx.doi.org/10.1161/01.CIR.0000044384.41037.43 CIRCAZ 0009-7322 Google Scholar
L. Liuet al.,
“Imaging the subcellular structure of human coronary atherosclerosis using micro-optical coherence tomography,”
Nat. Med., 17
(8), 1010
–1014
(2011). http://dx.doi.org/10.1038/nm.2409 1078-8956 Google Scholar
A. Rosencwaig,
“Thermal-wave imaging,”
Science, 218
(4569), 223
–228
(1982). http://dx.doi.org/10.1126/science.218.4569.223 SCIEAS 0036-8075 Google Scholar
R. L. ThomasL. D. FavroP. K. Kuo,
“Thermal-wave imaging for nondestructive evaluation,”
Can. J. Phys., 64
(9), 1234
–1237
(1986). http://dx.doi.org/10.1139/p86-215 CJPHAD 0008-4204 Google Scholar
A. MandelisA. WilliamsE. K. M. Siu,
“Photothermal wave imaging of metal-oxide-semiconductor field-effect transistor structures,”
J. Appl. Phys., 63
(1), 92
–98
(1988). http://dx.doi.org/10.1063/1.340468 JAPIAU 0021-8979 Google Scholar
S. A. Telenkovet al.,
“Coherent thermal wave imaging of subsurface chromophores in biological materials,”
Phys. Med. Biol., 47
(4), 657
–671
(2002). http://dx.doi.org/10.1088/0031-9155/47/4/308 PHMBA7 0031-9155 Google Scholar
G. Busseet al.,
“Imaging with optically generated thermal waves,”
Phil. Trans. R. Soc. Lond. A, 320
(1554), 181
–186
(1986). http://dx.doi.org/10.1098/rsta.1986.0109 PTRMAD 1364-503X Google Scholar
L. L. Maet al.,
“Small multifunctional nanoclusters (nanoroses) for targeted cellular imaging and therapy,”
ACS Nano, 3
(9), 2686
–2696
(2009). http://dx.doi.org/10.1021/nn900440e 1936-0851 Google Scholar
S. Mornetet al.,
“Magnetic nanoparticle design for medical diagnosis and therapy,”
J. Mater. Chem., 14
(14), 2161
–2175
(2004). http://dx.doi.org/10.1039/b402025a JMACEP 0959-9428 Google Scholar
S. Jacques,
“Optical properties spectra,”
(2012) http://omlc.ogi.edu/spectra ( 15 March ). 2012). Google Scholar
R. R. Andersonet al.,
“Selective photothermolysis of lipid-rich tissues: a free electron laser study,”
Laser Surg. Med., 38
(10), 913
–919
(2006). http://dx.doi.org/10.1002/lsm.20393 LSMEDI 0196-8092 Google Scholar
C. L. TsaiJ. C. ChenW. J. Wang,
“Near-infrared absorption property of biological soft tissue constituents,”
J. Med. Biol. Eng., 21
(1), 7
–14
(2001). 1609-0985 Google Scholar
J. T. Walsh Jr.,
“Pulsed laser angioplasty: a paradigm for tissue ablation,”
Optical-Thermal Response of Laser-Irradiated Tissue, 869
–874 Plenum Press, New York
(1995). Google Scholar
F. D. Kolodgieet al.,
“Hypercholesterolemia in the rabbit induced by feeding graded amounts of low-level cholesterol: methodological considerations regarding individual variability in response to dietary cholesterol and development of lesion type,”
Arterioscler. Thromb. Vasc. Biol., 16
(12), 1454
–1464
(1996). http://dx.doi.org/10.1161/01.ATV.16.12.1454 1079-5642 Google Scholar
A. S. Paranjapeet al.,
“Depth resolved photothermal OCT detection of macrophages in tissue using nanorose,”
Biomed. Opt. Exp., 1
(1), 2
–16
(2010). http://dx.doi.org/10.1364/BOE.1.000002 BOEICL 2156-7085 Google Scholar
C. F. Shaw III,
“Gold-based therapeutic agents,”
Chem. Rev., 99
(9), 2589
–2600
(1999). http://dx.doi.org/10.1021/cr980431o CHREAY 0009-2665 Google Scholar
J. Parket al.,
“Two-photon-induced photoluminescence imaging of tumors using near-infrared excited gold nanoshells,”
Opt. Express, 16
(13), 1590
–1599
(2008). http://dx.doi.org/10.1364/OE.16.001590 OPEXFF 1094-4087 Google Scholar
M. B. Lilledahlet al.,
“Characterization of vulnerable plaques by multiphoton microscopy,”
J. Biomed. Opt., 12
(4), 0440051
–04400512
(2007). http://dx.doi.org/10.1117/1.2772652 JBOPFO 1083-3668 Google Scholar
T. T. Leet al.,
“Label-free molecular imaging of atherosclerotic lesions using multimodal nonlinear optical microscopy,”
J. Biomed. Opt., 12
(5), 0540071
–05400710
(2007). http://dx.doi.org/10.1117/1.2795437 JBOPFO 1083-3668 Google Scholar
W. Yuet al.,
“In vivo imaging of atherosclerotic plaques in apolipoprotein E deficient mice using nonlinear microscopy,”
J. Biomed. Opt., 12
(5), 0540081
–05400810
(2007). http://dx.doi.org/10.1117/1.2800337 JBOPFO 1083-3668 Google Scholar
S. J. Leibovichet al.,
“Macrophage-induced angiogenesis is mediated by tumor necrosis factor-alpha,”
Nature, 329
(6140), 630
–632
(1987). http://dx.doi.org/10.1038/329630a0 NATUAS 0028-0836 Google Scholar
M. van Zandvoortet al.,
“Two-photon microscopy for imaging of the (atherosclerotic) vascular wall: a proof of concept study,”
J. Vasc. Res., 41
(1), 54
–63
(2004). http://dx.doi.org/10.1159/000076246 JVREE9 1018-1172 Google Scholar
R. S. Limet al.,
“Multimodal CARS microscopy determination of the impact of diet on macrophage infiltration and lipid accumulation on plaque formation in ApoE-deficient mice,”
J. Lipid Res., 51
(7), 1729
–1737
(2010). http://dx.doi.org/10.1194/jlr.M003616 JLPRAW 0022-2275 Google Scholar
H. Wanget al.,
“Imaging and quantitative analysis of atherosclerotic lesions by CARS-based multimodal nonlinear optical microscopy,”
Arterioscler. Thromb. Vasc. Biol., 29
(9), 1342
–1348
(2009). http://dx.doi.org/10.1161/ATVBAHA.109.189316 1079-5642 Google Scholar
B. D. ChithraniA. A. GhazaniW. C. W. Chan,
“Determining the size and shape dependence of gold nanoparticle uptake into mammalian cells,”
Nano Lett., 6
(4), 662
–668
(2006). http://dx.doi.org/10.1021/nl052396o NALEFD 1530-6984 Google Scholar
W. Jianget al.,
“Nanoparticle-mediated cellular response is size-dependent,”
Nat. Nanotech., 3
(3), 145
–150
(2008). http://dx.doi.org/10.1038/nnano.2008.30 1748-3387 Google Scholar
D. E. Owens IIIN. A. Peppas,
“Opsonization, biodistribution, and pharmacokinetics of polymeric nanoparticles,”
Int. J. Pharmaceu., 307
(1), 93
–102
(2006). http://dx.doi.org/10.1016/j.ijpharm.2005.10.010 IJPHDE 0378-5173 Google Scholar
Y. Wengeret al.,
“Tissue distribution and pharmacokinetics of stable polyacrylamide nanoparticles following intravenous injection in the rat,”
Toxicol. Appl. Pharmacol., 251
(3), 181
–190
(2011). http://dx.doi.org/10.1016/j.taap.2010.11.017 TXAPA9 0041-008X Google Scholar
R. A. Trivediet al.,
“In vivo detection of macrophages in human carotid atheroma: temporal dependence of ultrasmall superparamagnetic particles of iron oxide-enhanced MRI,”
Stroke, 35
(7), 1631
–1635
(2004). http://dx.doi.org/10.1161/01.STR.0000131268.50418.b7 SJCCA7 0039-2499 Google Scholar
M. T. Dirksenet al.,
“Distribution of inflammatory cells in atherosclerotic plaques relates to the direction of flow,”
Circulation, 98
(19), 2000
–2003
(1998). https://doi.org/doi: 10.1161/01.CIR.98.19.2000 CIRCAZ 0009-7322 Google Scholar
C. J. Slageret al.,
“The role of shear stress in the destabilization of vulnerable plaques and related therapeutic implications,”
Nat. Rev. Cardiol., 2
(9), 456
–464
(2005). Google Scholar
S. T. Nikkariet al.,
“Interstitial collagenase (MMP-1) expression in human carotid atherosclerosis,”
Circulation, 92
(6), 1393
–1398
(1995). CIRCAZ 0009-7322 Google Scholar
A. M. Henneyet al.,
“Localization of stromelysin gene expression in atherosclerotic plaques by in situ hybridization,”
Proc. Natl. Acad. Sci. U.S.A., 88
(18), 8154
–8158
(1991). http://dx.doi.org/10.1073/pnas.88.18.8154 PNASA6 0027-8424 Google Scholar
I. Halpertet al.,
“Matrilysin is expressed by lipid-laden macrophages at sites of potential rupture in atherosclerotic lesions and localizes to areas of versican deposition, a proteoglycan substrate for the enzyme,”
Proc. Natl. Acad. Sci. U.S.A., 93
(18), 9748
–9753
(1996). http://dx.doi.org/10.1073/pnas.93.18.9748 PNASA6 0027-8424 Google Scholar
H. Uzuiet al.,
“Increased expression of membrane type 3-matrix metalloproteinase in human atherosclerotic plaque: role of activated macrophages and inflammatory cytokines,”
Circulation, 106
(24), 3024
–3030
(2002). http://dx.doi.org/10.1161/01.CIR.0000041433.94868.12 CIRCAZ 0009-7322 Google Scholar
S. Rajagopalanet al.,
“Reactive oxygen species produced by macrophage-derived foam cells regulate the activity of vascular matrix metalloproteinases in vitro. Implications for atherosclerotic plaque stability,”
J. Clin. Invest., 98
(11), 2572
–2579
(1996). http://dx.doi.org/10.1172/JCI119076 JCINAO 0021-9738 Google Scholar
P. T. KovanenM. KaartinenT. Paavonen,
“Infiltrates of activated mast cells at the site of coronary atheromatous erosion or rupture in myocardial infarction,”
Circulation, 92
(5), 1084
–1088
(1995). CIRCAZ 0009-7322 Google Scholar
B. Schiefferet al.,
“Expression of angiotensin II and interleukin 6 in human coronary atherosclerotic plaques: potential implications for inflammation and plaque instability,”
Circulation, 101
(12), 1372
–1378
(2000). CIRCAZ 0009-7322 Google Scholar
I. Tabas,
“Macrophage apoptosis in atherosclerosis: consequences on plaque progression and the role of endoplasmic reticulum stress,”
Antioxid. Redox. Signal, 11
(9), 2333
–2339
(2009). http://dx.doi.org/10.1089/ars.2009.2469 1523-0864 Google Scholar
C. Corotet al.,
“Macrophage imaging in central nervous system and in carotid atherosclerotic plaque imaging using ultrasmall superparamagnetic iron oxide in magnetic resonance imaging,”
Invest. Radiol., 39
(10), 619
–625
(2004). http://dx.doi.org/10.1097/01.rli.0000135980.08491.33 INVRAV 0020-9996 Google Scholar
V. Doussetet al.,
“In vivo macrophage activity imaging in the central nervous system detected by magnetic resonance,”
Magn. Reson. Med., 41
(2), 329
–333
(1999). http://dx.doi.org/10.1002/(ISSN)1522-2594 MRMEEN 0740-3194 Google Scholar
M. Rauschet al.,
“MRI-based monitoring of inflammation and tissue damage in acute and chronic relapsing EAE,”
Magn. Reson. Med., 50
(2), 309
–314
(2003). http://dx.doi.org/10.1002/(ISSN)1522-2594 MRMEEN 0740-3194 Google Scholar
C. Corotet al.,
“Recent advances in iron oxide nanocrystal technology for medical imaging,”
Adv. Drug Deliv. Rev., 58
(14), 1471
–1504
(2006). http://dx.doi.org/10.1016/j.addr.2006.09.013 ADDREP 0169-409X Google Scholar
P. C. Beardet al.,
“Optical fiber photoacoustic-photothermal probe,”
Opt. Lett., 23
(15), 1235
–1237
(1998). http://dx.doi.org/10.1364/OL.23.001235 OPLEDP 0146-9592 Google Scholar
D. C. Adleret al.,
“Photothermal detection of gold nanoparticles using phase-sensitive optical coherence tomography,”
Opt. Express, 16
(7), 4376
–4393
(2008). http://dx.doi.org/10.1364/OE.16.004376 OPEXFF 1094-4087 Google Scholar
M. C. Skalaet al.,
“Photothermal optical coherence tomography of epidermal growth factor receptor in live cells using immunotargeted gold nanospheres,”
Nano Lett., 8
(10), 3461
–3467
(2008). http://dx.doi.org/10.1021/nl802351p NALEFD 1530-6984 Google Scholar
C. Zhouet al.,
“Photothermal optical coherence tomography in ex vivo human breast tissues using gold nanoshells,”
Opt. Lett., 35
(5), 700
–702
(2010). http://dx.doi.org/10.1364/OL.35.000700 OPLEDP 0146-9592 Google Scholar
B. E. Boumaet al.,
“Evaluation of intracoronary stenting by intravascular optical coherence tomography,”
Heart, 89
(3), 317
–320
(2003). http://dx.doi.org/10.1136/heart.89.3.317 00070769 Google Scholar
H. Yabushitaet al.,
“Characterization of human atherosclerosis by optical coherence tomography,”
Circulation, 106
(13), 1640
–1645
(2002). http://dx.doi.org/10.1161/01.CIR.0000029927.92825.F6 CIRCAZ 0009-7322 Google Scholar
|


