|
|
1.IntroductionThe rate of oxygen consumption () is an important indicator of tissue metabolic activity. The ability to accurately image noninvasively will have an impact on research and clinical practice relating to cancer,1 diabetes,2 congestive heart failure3 and many other diseases relating to oxygen metabolism. is defined as the amount of oxygen consumed in a given tissue region per unit time per 100 g of tissue or the organ of interest.4 It can be estimated by quantifying the net oxygen flux of the blood vessels entering or exiting a defined tissue region. Blood oxygen saturation (), mean flow speed, and cross-sectional area of the blood vessel are the key parameters to estimate the local oxygen flux of a single vessel. Presently, techniques to obtain are limited. Near-infrared optical methods have been developed to measure with the blood flow information provided by the diffuse correlation spectroscopy (DCS) and blood oxygenation information provided by diffuse reflectance spectroscopy (DRS).5 However, the spatial resolution is poor due to optical scattering. Positron emission tomography (PET) with -oxygen has been used to measure oxygen consumption,6 but typical spatial resolution is for clinical systems, and for small animal systems. Magnetic resonance imaging (MRI) plays an important role in noninvasive measurement of by utilizing the blood oxygenation-level dependent (BOLD) effect.7 BOLD MRI can provide high spatial resolution, but it is only sensitive to deoxy-haemoglobin and has trouble distinguishing between changes in and blood flow. Moreover, PET and MRI are not well-suited for many bedside clinical applications and can be cost-prohibitive. Photoacoustic microscopy (PAM) is a novel technique that may provide a new way to image . Photoacoustic imaging involves transmitting short laser pulses into biological tissues producing rapid heating in optically absorbing structures and detecting ultrasonic waves induced by thermo-elastic expansions. The strength of received PA signals is proportional to optical absorption, and the spatial resolution depends on ultrasonic detection. Maslov et al.8 developed the first dark-field confocal PAM system with a 50-MHz transducer, demonstrating a lateral resolution of . Recently, an alternative technique termed optical-resolution PAM (OR-PAM) utilizes the fine optical focusing to achieve high lateral resolution () with sacrifice of the imaging depth ().9 The lateral resolution is determined by the size of a raster-scanned optical focal spot, and the axial resolution is still derived from time-resolved ultrasonic detection. Since oxy-haemoglobin () and deoxy-haemoglobin (HbR) are two of the major absorbing chromophores in human blood, and the optical absorption of blood is dependent on its oxygenation status, PAM is well suited to the imaging of vascular structures from macro vessels all the way down to individual capillaries4,9 and capable of functional imaging of by multi-wavelength measurements. Zhang et al.10 have demonstrated in vivo imaging of microvasculature with high spatial resolution and of single vessels in animals and total concentration of haemoglobin () in humans. Combined PAM and optical coherence tomography (OCT) method has been proposed to estimate in vivo, with measured by OR-PAM and blood flow speed measured by spectral-domain OCT.11 There are many potential methods to estimate the flow velocity and blood volume fraction. Recently, photoacoustic Doppler flowmetry has been proposed to measure transverse flow velocity based on Doppler bandwidth broadening, and the structural information of the flow can be provided as well.12 Yao et al. have developed mPAM (metabolic photoacoustic microscopy) system for simultaneously imaging and blood flow speed to quantify in vivo.13 However, the detectable flow speeds () are limited by the low laser pulse repetition rate, and the imaging depth is shallow (). In our work, we propose to implement high-frequency Doppler ultrasound for flow estimation. High-frequency ultrasound is considered to include frequencies above . The small beam size and large bandwidth provide high spatial resolution, which is important for imaging small animal models in preclinical research.14 Pulsed color Doppler ultrasound transmits ensembles of ultrasound pulses and estimates flow velocities from detected phase shifts in received echoes. By choosing appropriate pulse-repetition frequency (PRF) and Doppler ensemble length, color Doppler ultrasound is capable of imaging a wide range of flow velocities. However, like other flow metries based on the Doppler frequency shifts, the blood flow is hard to identify when the Doppler angle approaches 90 deg. Moreover, the noise signal with a low power but wide frequency spread can be displayed in color Doppler images as random velocities in random directions, which may appear as a mosaic of colors masking real vascular signals. In contrast with color Doppler, the technique of power Doppler ultrasound displays the back scatter strength of moving blood instead of flow velocities and directions. The intensity of power Doppler images is proportional to the number of scatterers moving within a vascular volume, rather than the frequency shifts they generate.15 The increased sensitivity to blood flow detection, and the angle-independent feature of power Doppler ultrasound make it particularly useful for imaging blood volume fractions even for tortuous vessels. For small vessels with low flow speeds, which are hard to detect by Doppler ultrasound, our previous work shows that photoacoustic imaging is more effective than power Doppler for the detection of blood.16 The long-term goal of our research is to develop photoacoustic and ultrasonic imaging methods for noninvasive estimation of in vivo. We recently developed a combined photoacoustic and high-frequency ultrasound microscopy system with a swept-scan 25-MHz transducer and confocal dark-field laser illumination optics.16,17 Previously we demonstrated the use of this system for interlaced photoacoustic and power Doppler imaging modes. In this article, along with our recent conference publication,18 we add color Doppler flow imaging to our system’s capabilities. Since the mean flow speed can be estimated using color Doppler ultrasound, vessel cross-sectional area can be quantified from power Doppler or photoacoustic images, and can be estimated using multi-wavelength photoacoustic methods, our combined system is able to provide all of the parameters necessary for blood oxygen flux estimation. The accuracy of the flow velocity and estimation has been investigated. In vitro sheep blood phantom experiments have been performed at different levels and mean flow speeds. We also experimentally demonstrate for the first time the feasibility of imaging local blood oxygen flux of a single vessel by combining photoacoustic oximetry and color Doppler ultrasound. 2.Methods2.1.Experimental SystemOur customized imaging system incorporates a computer-controlled scanning, triggering, and data-acquisition system and a combined light delivery and ultrasound probe based on confocal dark-field laser illumination optics. Readers are referred to our previous work16,17 for specific details about the instrumentations and explanations on light delivery probe and imaging procedures. In brief, a digital-input-output (DIO) card (NI PCI-6542, National Instruments, Inc., USA) is used to generate a pulse sequence that is sent to the ultrasound pulser/receiver (5073PR, Panametrics; Waltham, Massachusetts) and/or laser to enable different imaging modes. Currently our system can provide ultrasound (US) B-mode, photoacoustic (PA) mode, and Doppler US mode. In PA mode, a tuneable optical parametric oscillator (Surelite OPO Plus, Continuum; Santa Clara, California) is pumped by a Q-switch Nd:YAG laser (Surelite III, Continuum; Santa Clara, California) with a repetition rate of 10 Hz. The tuning range is from 410 to 710 nm. PA and Doppler US modes are combined by using the DIO card to interleave laser and US triggers so that images can be co-registered. A 25-MHz single element transducer (V324-SM, 12.7-mm focal length, Panametrics; Waltham, Massachusetts) is positioned inside the light delivery probe and can be adjusted vertically to match its focus point with the laser focus. Radio frequency (RF) data received by the US pulser/receiver is digitized by an eight-channel PCI data-acquisition card (CS8289, Gage Cobra, Gage Applied Systems, Inc., USA) with 12-bit dynamic range and sampling rates as high as 125 M Samples/s. 2.2.Principles of Multi-Wavelength PAM for Oxygen Saturation EstimationSince HbR and are treated as the two dominant absorbing chromophores in blood, the blood absorption coefficient () at wavelength can be expressed as: here and are the known molar extinction coefficients () of HbR and at wavelength , respectively. and are the concentrations of these two forms of hemoglobin. The PA signal amplitude emitted from a subsurface location is proportional to the local optical absorption coefficient , local optical fluence , and the Grueneisen parameter : Often the Grueneisen parameter is assumed to be a constant . By interrogating the tissue with at least two optical wavelengths, we solve the following matrix equation to obtain and : Often the local optical fluence is unknown to us. In this paper we take two approaches to solve this equation. The first approach involves assuming that the fluence is a wavelength-independent constant. The second approach uses a separate PA experiment and some highly absorbing black dye to estimate a factor proportional to the subsurface wavelength-independent fluence. In either case, a least-squares approach using the Moore-Penrose pseudo-inverse can be used to solve for and . The oxygen saturation is then calculated as:2.3.Signal Processing Strategies of Doppler UltrasoundSince tissues surrounding blood vessels often generate scattered signals much stronger than reflected signals from moving blood, clutter filtering is necessary before velocity estimation and power calculations. We use an eigen-filter, which is designed based on the statistics of the clutter, so that the response can be adapted to the tissue movement. The correlation matrix of the received RF data is decomposed into eigenvectors and eigenvalues by the discrete Karhunen-Loeve transform (DKLT), and then eigenvalues are sorted in decreasing amplitude. The eigenvalue spectrum is a generalization of the Fourier power spectrum, which represents the power distribution of the frequency components.19 Since the power of clutter signals arising from stationary tissue is much higher than other components, we can partition the clutter subspace and eliminate clutter signals by choosing appropriate filter order. Appropriate filter order is determined experimentally by picking the filter order (typically two to three), which gives the best trade-off between clutter rejection and preservation of flow. The combined system uses a swept-scan mode to continuously scan over the imaging target. This method can shorten the data-acquisition time, but the mechanical scan may cause changes of the amplitude and phase of the received signals, producing a gradual de-correlation. In this case, some clutter signals may pass through the filter, and the velocity estimator may interpret them as blood flow. Hence signal alignment is important before wall filtering. Within one line-of-sight, the peak magnitude of the cross-correlation between each adjacent pulse pair is found, and the alignment can be achieved by shifting each of the pulses by the determined amount.20 The technique for velocity estimation is the auto-correlation technique introduced by Kasai et al.21 A sequence of A-mode RF signals is obtained from transmissions in the same beam direction, and the flow velocity is calculated using the phase shift information. The Doppler ensemble length is determined by the scan speed and ultrasound PRF. The maximum and minimum detectable velocities are related to PRF and Doppler ensemble length. After signal alignment and wall filtering, the intensity of the signals from moving blood is accumulated within each Doppler ensemble to generate power Doppler images. 2.4.Oxygen Flux and EstimationThe oxygen content in blood is the summed contribution of oxygen dissolved in plasma and chemically bound to haemoglobin (Hb) in red blood cells. The amount of oxygen carried in each form depends on the partial pressure of oxygen () to which each medium is exposed. Since the solubility of oxygen is limited in plasma, the specialized oxygen-binding mechanism of Hb is the major means of transporting oxygen in blood. As shown in Eq. (5), the gas-phase equivalent volume (in ml) of oxygen carried by Hb per ml of blood can be quantified as:22 Here is the oxygen-binding capacity of Hb. From previous study,22 when Hb is completely saturated with oxygen, is Hb, which means that each gram of Hb will bind with 1.34-ml oxygen. The unit of is . Oxygen dissolved in plasma, despite its lower transport capacity, plays an important role for cells. In small capillaries, oxygen in plasma can diffuse through capillary walls and into cells for aerobic metabolism. According to Henry’s law, the gas-phase equivalent volume (in ml) of dissolved oxygen per 100 ml of blood can be quantified by the equation:22 Here with a unit of is the solubility coefficient of the oxygen in plasma dependent on temperature (), and the unit of is mmHg.The blood oxygen flux is defined as the volume of oxygen content transported per unit time. According to Eqs. (5) and (6), for a single vessel model, the oxygen flux can be expressed as: Here is the oxygen flux (), is the cross-sectional area of the blood vessel, and is the mean flow speed. If a region of interest is well defined, for feeding vessels and draining vessels, can be expressed as: where is the weight of the region of interest (in gram). The relative uncertainty of blood oxygen flux estimation can be determined by the relative uncertainties of , , and . Simply, based on the assumption of error independence, for a single vessel model (): where denotes an error quantity. Uncertainty due to measurement variability can be quantified by measuring , , and repeatedly and estimating standard deviations.2.5.Phantom StudyExperiments were performed on flow phantoms with the objective to show the feasibility of imaging blood oxygen flux using our combined PA and high-frequency US microscopy system. Transparent polymer tubing (Paradigm Optics; Vancouver, Washington) with inner diameter (ID) of 0.86 mm was used in construction of blood vessels. This ID is representative of small arteries and small veins.23 Six vessels were evenly positioned on an acrylic holder and embedded deep in a tissue-mimicking base. The tissue-mimicking base was composed of 10% cornstarch and 10% gelatin by mass, which provided an optical reduced scattering coefficient at 532 nm, similar to human tissues. The ultrasonic and mechanical properties are also within the range of typical biological tissues.24 2.6.Double-Ink StudiesTo determine the accuracy of flow velocity and estimation, phantom studies were conducted using double-ink blood-mimicking fluid with both ultrasonic scattering and optical absorption. The double-ink experiments provide a good first step toward oxygen flux estimation because all parameters regarding flow and mock- can be easily controlled. The blood-mimicking fluid was prepared by dissolving 5% (by weight) cornstarch in water, which ensures the blood-to-tissue signal power consistent with in vivo signal levels. Red and blue ink samples (fiesta red and lake placid blue, Private Reserve Ink, Indiana) were diluted by the blood-mimicking fluid and mixed in various volumetric ratios to mimic different levels of . The fraction of the red ink concentration in the total ink concentration is termed mock-. Independent measurements of the optical absorption spectra of the ink samples were performed using a spectrometer (USB4000 Miniature Fiber Optic Spectrometer, Ocean Optics Inc., USA). The double-ink blood-mimicking fluid was pumped through corresponding vessels at different flow rates using a calibrated syringe pump (NE-300 Syringe Pump, New Era Pump System Inc., USA) and imaged by our combined system. 2.7.Sheep Blood StudiesTo demonstrate the capability of imaging blood oxygen flux, in vitro phantom experiments were performed using freshly collected arterial sheep blood with anticoagulant CPDA-1 (Citrate Phosphate Dextrose Adenine) solution. Figure 1 shows the experimental setup. The blood was loaded into a flask with a four-hole stopper. Pure oxygen and pure carbon dioxide flowed into the flask at different ratios of flow rates to obtain various levels. The blood of certain was withdrawn from one hole to a corresponding vessel of the flow phantom at different flow rates. Since the actual is unknown, to validate estimation, was measured simultaneously when the blood flow was imaged by the combined system. An airtight acrylic mould was designed to hold the electrode (DO_166MT-1 Micro Dissolved Oxygen Electrode, Lazar Research Laboratories, Inc., USA) as well as the temperature compensated pH electrode (HI 9126 pH/ORP meter, Hanna Instruments, USA) securely with the electrode tip completely immersed in blood. The relationship between and is determined by the oxy-hemoglobin dissociation curve (OHDC), which demonstrates the nonlinear tendency for oxygen to bind to hemoglobin. Eq. (10) is the classic OHDC equation developed by Kelman:25 Here, is (mmHg) in standard condition (temperature , , and carbon dioxide partial pressure ). Measurements conducted in other temperature or pH can be converted to standard condition by Eqs. (11) and (12): Coefficients to in Eq. (10) are determined by fitting the equation in the least-squares sense to paired values of and .3.Results3.1.Co-Registered Images Acquired from Double-Ink Flow PhantomThe flow phantom was immersed in water and imaged by cross-sectional scans at a speed of , which provides 50 μm between each line-of-sight. The Doppler angle was 75 deg. Double-ink blood-mimicking fluid with four different mock- levels (20%, 40%, 60%, and 80%) was pumped through corresponding vessels at different flow rates. The mean flow speed is calculated from the volumetric flow rate divided by the cross-sectional area of the vessel. The mean flow speeds above represent the blood flow in small arteries, and the speed range below represents the flow in small veins down to large capillaries.21 Considering the slow scan speed, the Doppler ensemble length was chosen to be 10. Appropriate PRFs were set to ensure that the flow speed was within the detectable range. Optical wavelengths of 560 to 600 nm in steps of 10 nm were employed for estimation. A photodiode (DET36A/M, Thorlabs, USA) was used for laser pulse-energy normalization. Interlaced data were separated to form individual PA, B-mode, and Doppler US images. Then PA and Doppler images were co-registered and superimposed on the B-mode images with structural context. To better estimate the mock-, M-mode measurements were repeated 100 times at the location with peak PA signal and the averaged amplitude of PA signals was used in Eq. (3). The mean flow speed and cross-sectional area of the vessel were estimated from ultrasound Doppler images. Figure 2 shows representative co-registered power Doppler [Fig. 2(a)], color Doppler [Fig. 2(b)], PA [Fig. 2(c)], and mock- [Fig. 2(d)] images. The mock- image [Fig. 2(d)] was obtained by assigning the estimated value to a region obtained by thresholding the color Doppler image [Fig. 2(b)]. Appropriate regions of interest are selected so that the cross-sectional area of the vessel can be displayed in the center. The PA image [Fig. 2(c)] was acquired at 560 nm and shows that only the top surface can be well visualized because of the minimal light penetration depth in the vessel. The power Doppler [Fig. 2(a)] and color Doppler [Fig. 2(b)] images both show good detection of the blood volume fraction. In practice, Doppler threshold levels will be important to accurately estimate the vessel area. Fig. 2Representative co-registered power Doppler, color Doppler, PA, and mock- images of double-ink flow phantom: (a) power Doppler image, (b) color Doppler image, (c) PA image, (d) mock- image.  To demonstrate the performance of color flow estimation, different mean flow speeds were imaged while the mock- stayed invariant at 40%. Co-registered color Doppler and mock- images at different mean flow speeds are shown in Fig. 3. Fig. 3Co-registered color Doppler and mock- images of double-ink flow phantom: (a) , 40%; (b) , 40%; (c) , 40%; (d) , 40%; (e) , 40%.  When the mean flow speed stayed at , the mock- level was varied and imaged to show the performance of estimation. Figure 4 shows the co-registered color Doppler and mock- images at different levels. 3.2.Measurement AccuracyMeasurement accuracy can be elucidated by validating the mean of experimentally estimated quantities against known values. Mean flow speeds were quantified from color Doppler images [Fig. (3)] and plotted in Fig. 5. Linear regression shows a good linear relationship between the measured and preset values with a correlation coefficient of , a slope of (with 95% confidence bounds), and a zero-offset of . We used black ink (Private Reserve Ink, Indiana) as a wavelength-independent optical absorber to calibrate for the influence of wavelength-dependent local optical fluence. This black ink was pumped through each vessel as a separate experiment, and multi-wavelength PA signals were acquired. Because light is completely absorbed within one acoustic resolution voxel at the surface of the black ink (regardless of wavelength), these PA signals were proportional to the local wavelength-dependent fluence and used to normalize the existing data for improved estimation of . Table 1 shows the mean values and standard errors of estimated mock- before and after black ink correction. A student’s t-test was carried out to evaluate if the mean values of mock- are significantly different from these two groups. Since the -values are all within 0.05, the mean values of mock- in these two groups are significantly different. Table 1Mean values and standard deviations of mock-sO2 of double-ink phantom with/without correction.
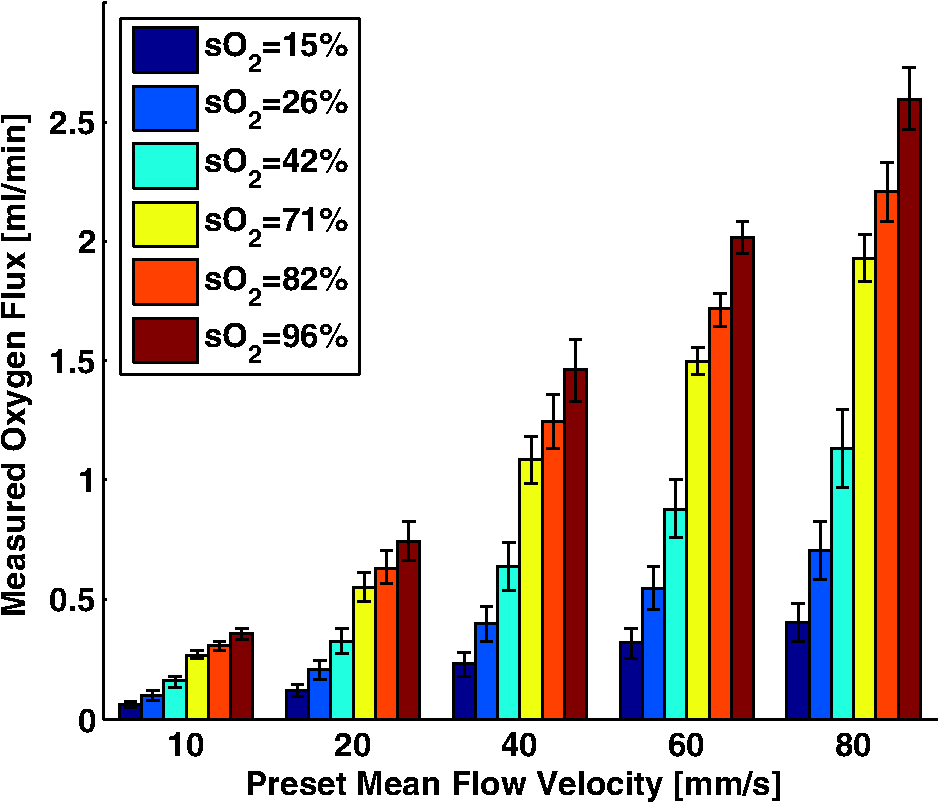
Figure 6 shows the relation between measured and preset mock- values. Linear regression indicates a good linear relationship with a correlation coefficient of , a slope of , and a zero-offset of . 3.3.In Vitro Phantom Study of Oxygen Flux EstimationAs illustrated in Fig. 1, the fresh sheep blood with different levels flows through the corresponding vessels embedded in tissue-mimicking base at different flow rates, and imaged by the combined system. Mean flow speeds were quantified from color Doppler images and plotted against preset values (10, 20, 40, 60, and ) with linear least-square fitting in Fig. 7. The correlation coefficient is 0.95 with a slope of and a zero-offset of . Four wavelengths (558, 564, 570, and 576 nm) are used to estimate . Since HbR and have the same optical absorption coefficient at isosbestic wavelength (570 nm), the PA signal acquired at 570 nm is proportional to regardless of the level. In previous study,26 of the arterial sheep blood was measured to be . We set this value as the of blood when quantifying oxygen flux. To determine the relative error in for Eq. (9), the amplitude of PA signals acquired at 570 nm (from blood with varying levels) was shown in Fig. 8. Both and pH were measured simultaneously when the blood flow was imaged by the combined system. All the measurements were conducted under room temperature () of 23 °C. Assuming that the partial pressure , the measured values are calibrated to standard condition according to Eq. (11). To investigate the relationship between measured and , we applied a least-square fitting of the and values to Eq. (10). As shown in Fig. 9(a), our experimental results were in agreement with the sigmoidal shape of Kelman’s OHDC25 with a correlation coefficient of 0.97. The fitted curve rises steeply with increasing and reaches 90% at of . In addition, the corresponding was calculated from measured according to Eq. (10). Figure 9(b) shows the relation between the measured by PA method and calculated from measured . Linear regression shows that the correlation coefficient is 0.92 with a slope of and a zero-offset of . Fig. 9(a) The relationship between measured and measured , (b) The linear least-square fitting of the measured and calculated from .  From measurements of all these parameters, blood oxygen flux of a single vessel was estimated by Eq. (6), and the uncertainty was quantified by Eq. (9). Results are shown in Fig. 10. The mean standard error is . 4.DiscussionWe have demonstrated for the first time a photoacoustic and ultrasound method for imaging local blood oxygen flux in a single vessel. Our combined photoacoustic and high-frequency ultrasound microscopy system shows good performance on both flow velocity and estimation at penetration depths to 3 mm. For the task of cross-sectional area estimation, a circular region is selected so that all the color pixels in the power Doppler image can be fitted into the circle. For different vessel sizes and flow speeds, it may be possible to improve our estimation of fractional blood volume by careful selection of photoacoustic or power Doppler parameters. On the other hand, color Doppler velocity estimation may be improved by only computing Doppler estimates in locations where photoacoustic or power Doppler signals exist. One long-term goal of our research is to use this system to estimate in vivo. As shown in Eq. (3), the subsurface optical fluence is often unknown in photoacoustic imaging so that quantitative estimation of oxygen saturation is challenging for animal models. In this work, we used a black-ink correction method to reduce the influence of wave-independence of the local optical fluence. In future studies, we would like to couple PAM with a technique termed oblique incidence reflectometry, which can provide a good first-order estimate of local optical fluence to improve our estimation.27 This proposed method will require validation. Even if accurate fluence correction is not possible, relative changes of oxygen flux into and out of a given region, and within a given range of imaging depths may prove informative if not absolutely quantitative. Moreover, the challenge of imaging depth and reduced imaging speed may be limitations of the high-frequency swept-scan system. A clinical array system may be incorporated to allow images at multi-cm depths and higher frame rates. Work in progress includes implementing the photoacoustic and Doppler ultrasound method for estimation on a clinical array system. 5.ConclusionWe have developed a combined photoacoustic and high-frequency ultrasound imaging system with a 25-MHz single-element transducer and confocal dark-field laser illumination optics. Flow phantoms are constructed to validate the color flow estimation and multi-wavelength estimation. In vitro sheep blood phantom experiments have been performed at different levels and mean flow speeds. We also experimentally demonstrate for the first time the feasibility of imaging local blood oxygen flux of a single vessel by combining photoacoustic oximetry and color Doppler ultrasound. Uncertainties at all experimental conditions are quantified to show a good performance of blood oxygen flux estimation. The mean standard error is , which means that we can distinguish oxygen fluxes that differ by this amount. ReferencesT. N. SeyfriedL. M. Shelton,
“Cancer as a metabolic disease,”
Nutr. Metab., 7
(7), 1
–22
(2010). Google Scholar
P. Horstmann,
“The oxygen consumption in diabetes mellitus,”
Acta Med. Scand., 139
(4), 326
–330
(1951). http://dx.doi.org/10.1111/j.0954-6820.1951.tb17171.x AMSVAZ 0001-6101 Google Scholar
R. M. Bersinet al.,
“Improved hemodynamic function and mechanical efficiency in congestive heart failure with sodium dichloroacete,”
J. Am. Card., 23
(7), 1617
–1624
(1994). http://dx.doi.org/10.1016/0735-1097(94)90665-3 JACCDI 0735-1097 Google Scholar
L. V. Wang,
“Prospects of photoacoustic tomography,”
Med. Phys., 35
(12), 5758
–5767
(2008). http://dx.doi.org/10.1118/1.3013698 MPHYA6 0094-2405 Google Scholar
G. Yuet al.,
“Time-dependent blood flow and oxygenation in human skeletal muscles measured with noninvasive near-infrared diffuse optical spectroscopies,”
J. Biomed. Opt., 10
(2), 024027
(2005). http://dx.doi.org/10.1117/1.1884603 JBOPFO 1083-3668 Google Scholar
Y. Yamamotoet al.,
“Noninvasive quantification of regional myocardial metabolic rate of oxygen by O-15(2) inhalation and positron emission tomography,”
Circulation, 94
(4), 808
–816
(1996). http://dx.doi.org/10.1161/01.CIR.94.4.808 CIRCAZ 0009-7322 Google Scholar
E. M. Haackeet al.,
“In vivo measurement of blood oxygen saturation using magnetic resonance imaging: a direct validation of the blood oxygen level-dependent concept in functional brain imaging,”
Hum. Brain Mapp., 5
(5), 341
–346
(1997). http://dx.doi.org/10.1002/(SICI)1097-0193(1997)5:5<>1.0.CO;2-S HBRME7 1065-9471 Google Scholar
K. MaslovG. StoicaL. V. Wang,
“In vivo dark-field reflection-mode photoacoustic microscopy,”
Opt. Lett., 30
(6), 625
–627
(2005). http://dx.doi.org/10.1364/OL.30.000625 OPLEDP 0146-9592 Google Scholar
K. Maslovet al.,
“Optical-resolution photoacoustic microscopy for in vivo imaging of single capillaries,”
Opt. Lett., 33
(9), 929
–931
(2008). http://dx.doi.org/10.1364/OL.33.000929 OPLEDP 0146-9592 Google Scholar
H. F. Zhanget al.,
“Imaging of hemoglobin oxygen saturation variations in single vessels in vivousing photoacoustic microscopy,”
Appl. Phys. Lett., 90 053901
(2007). http://dx.doi.org/10.1063/1.2435697 APPLAB 0003-6951 Google Scholar
T. Liuet al.,
“Combined photoacoustic microscopy and optical coherence tomography can measure metabolic rate of oxygen,”
Biomed. Opt. Ex., 2
(5), 1359
–1365
(2011). http://dx.doi.org/10.1364/BOE.2.001359 BOEICL 2156-7085 Google Scholar
J. YaoL. V. Wang,
“Transverse flow imaging based on photoacoustic Doppler bandwidth broadening,”
J. Biomed. Opt., 15
(2), 021304
(2010). http://dx.doi.org/10.1117/1.3339953 JBOPFO 1083-3668 Google Scholar
J. Yaoet al.,
“Label-free oxygen-metabolic photoacoustic microscopy in vivo,”
J. Biomed. Opt., 16
(7), 076003
(2011). http://dx.doi.org/10.1117/1.3594786 JBOPFO 1083-3668 Google Scholar
J. M. Rubinet al.,
“Power doppler US: a potentially useful alternative to mean frequency-based color doppler US,”
Radiology, 190
(3), 853
–856
(1994). Google Scholar
J. M. Rubinet al.,
“Power Doppler US: a potentially useful alternative to mean frequency-based color Doppler US,”
Radiology, 190
(3), 853
–856
(1996). RADLAX 0033-8419 Google Scholar
Y. Jianget al.,
“Photoacoustic and high-frequency power Doppler ultrasound biomicroscopy: a comparative study,”
J. Biomed. Opt., 15
(5), 056008
(2010). http://dx.doi.org/10.1117/1.3491126 JBOPFO 1083-3668 Google Scholar
T. Harrisonet al.,
“Combined photoacoustic and ultrasound biomicroscopy,”
Opt. Express, 17
(24), 22041
–22046
(2009). http://dx.doi.org/10.1364/OE.17.022041 OPEXFF 1094-4087 Google Scholar
Y. Jianget al.,
“Oxygen consumption estimation with combined color Doppler ultrasound and photoacoustic microscopy: a phantom study,”
Proc. SPIE, 7899 789942
(2011). http://dx.doi.org/10.1117/12.875786 PSISDG 0277-786X Google Scholar
D. E. KruseK. W. Ferrara,
“A new high resolution color flow system using an eigen decomposition-based adaptive filter for clutter rejection,”
IEEE Trans. Ultrason., Ferroelect. Freq. Control, 49
(12), 1739
–1753
(2002). http://dx.doi.org/10.1109/TUFFC.2002.1159852 Google Scholar
B. G. ZagarR. J. FornarisK. W. Ferrara,
“Ultrasonic mapping of the microvasculature: signal alignment,”
Ultrasound in Med. and Bio., 24
(6), 809
–824
(1998). http://dx.doi.org/10.1016/S0301-5629(98)00042-8 USMBA3 0301-5629 Google Scholar
C. Kasaiet al.,
“Real-time two-dimensional blood flow imaging using an autocorrelation technique,”
IEEE Trans. Son. Ultrason., 32
(3), 458
–463
(1985). http://dx.doi.org/10.1109/T-SU.1985.31615 IESUAU 0018-9537 Google Scholar
P. L. MarinoK. M. Sutin, The ICU Book, Lippincott Williams & Wilkins, Philadelphia, USA Google Scholar
S. Z. PinterJ. C. Lacefield,
“Detectability of small blood vessels with high-frequency power Doppler and selection of wall filter cut-off velocity for microvascular imaging,”
Ultrasound Med. Bio., 35
(7), 1217
–1228
(2009). http://dx.doi.org/10.1016/j.ultrasmedbio.2009.01.010 USMBA3 0301-5629 Google Scholar
R. J. ZempC. KimL. V. Wang,
“Ultrasound-modulated optical tomography with intense acoustic bursts,”
Appl. Opt., 46
(10), 1615
–1623
(2007). http://dx.doi.org/10.1364/AO.46.001615 APOPAI 0003-6935 Google Scholar
G. R. Kelman,
“Digital computer subroutine of the conversion of oxygen tension into saturation,”
Appl. J. Phys., 21
(4), 1375
–1376
(1966). Google Scholar
D. E. Ullreyet al.,
“Sheep hematology from birth to maturity I. Erythrocyte population, size and hemoglobin concentration,”
J. Animal Sci., 24
(1), 135
–140
(1965). JANSAG 0021-8812 Google Scholar
J. C. Ranasinghesagaraet al.,
“Photoacoustic technique for assessing optical scattering properties of turbid media,”
J. Biomed. Opt., 14
(4), 040504
(2009). http://dx.doi.org/10.1117/1.3200922 JBOPFO 1083-3668 Google Scholar
|