|
|
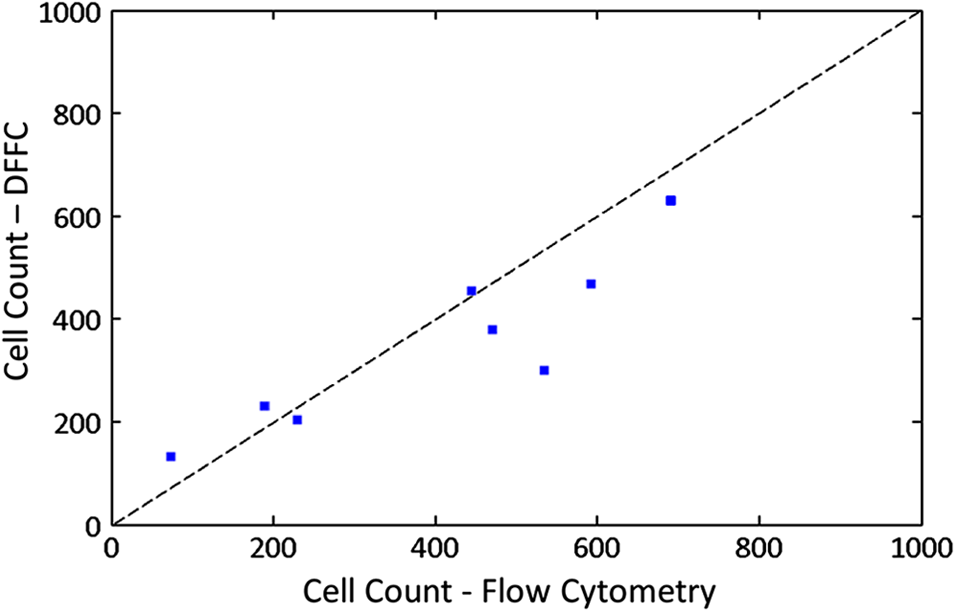
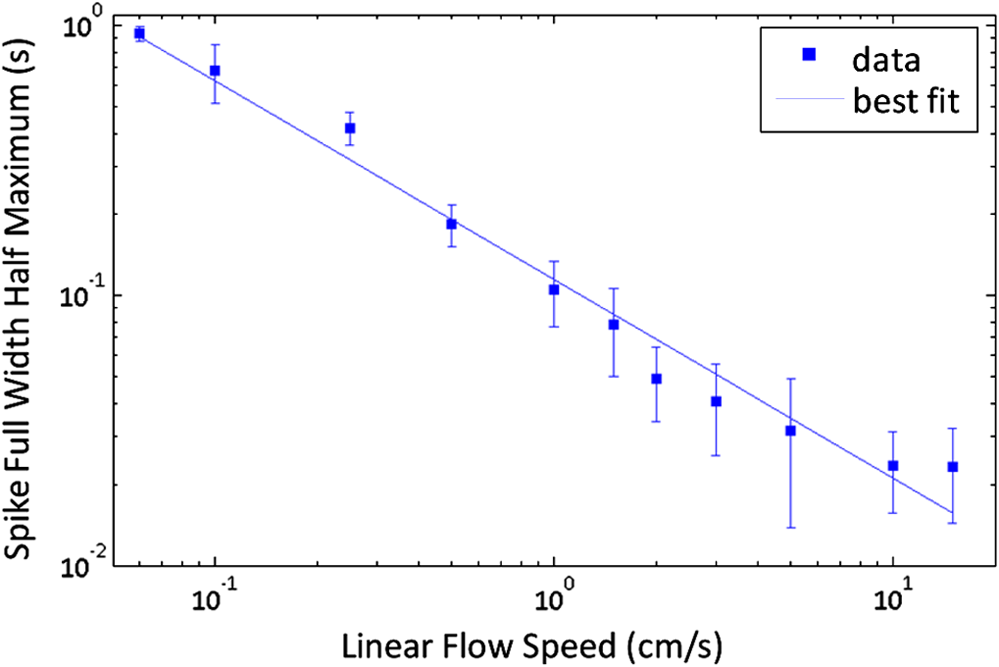
1.IntroductionThere are many applications in preclinical biomedical research where it is desirable to measure the number of cells circulating in the bloodstream in small animals. For example, the number of circulating tumor cells is known to be an important predictor of progression of cancer metastasis.1–5 In current practice, circulating cell populations are normally quantified in mice by extraction of small blood samples and ex-vivo analysis using, for example, flow cytometry,6 hemocytometry, or microfluidic devices.6–10 However, typical sampling volumes for nonterminal experiments are less than 1% of the total blood volume of the animal, so very rare cell types are difficult to detect.11 Measurement of changes in cell populations over hours or minutes is also challenging because blood samples are typically drawn only once per day.11 These limitations have motivated the development of noninvasive techniques that can be operated continuously without drawing blood samples.12–19 Microscopy-based in vivo flow cytometry of fluorescently labeled circulating cells, wherein a laser beam is focused through a microscope objective across a small blood vessel in the ear or retina of a mouse, is one such approach. As cells cross the laser path, a fluorescent pulse is generated that can be detected with a photomultiplier tube (PMT).12,13 While in vivo flow cytometry has proven useful for many applications—including enumeration of circulating red blood cells, -lymphocytes, and multiple myeloma (MM) cells,12,13,20,21 the limitation is that relatively small blood volumes are sampled, specifically on the order of 1–5 μL per minute. Therefore, monitoring of about 1% of the blood volume of a mouse requires approximately 30 min. This sets a practical lower limit of sensitivity of about to in circulation. As such, very rare circulating cell types may escape detection entirely. Here we describe a new technological approach to this problem using high-sensitivity detection of diffuse fluorescent light from relatively large blood vessels in vivo. Specifically, our goal is to develop an instrument capable of detecting fluorescently labeled circulating cells in mice in the range of less than cells in circulation, i.e., below the sensitivity range of microscopy-based instant-varying fading channel (IVFC; in vivo flow cytometry). Our strategy was to develop a fluorescence sensing ring that would be placed around a relatively narrow, 2 to 3 mm limb of a mouse, where total circulating blood flow rates are approximately 0.2 to 0.5 mL per minute.22 Therefore, in principle, the entire blood volume of a mouse could be interrogated in minutes. As we discuss, the principal engineering challenges in developing this instrument were i. high-sensitivity detection of very low signal levels from individual cells, ii. rejection of interfering background autofluorescence, and iii. minimizing movement (breathing) artifacts in mice. In this paper, we first describe our diffuse fluorescence flow cytometry (DFFC) instrument and validate its operation with a custom-made optical flow phantom model. We demonstrate that the instrument can successfully detect single fluorescent microspheres and fluorescently labeled cells passing through flow phantoms with similar size, optical properties, autofluorescence, and flow speeds of a mouse limb with excellent counting accuracy. We also present preliminary in vivo validation of our design by detecting fluorescently labeled circulating MM cells in the tails of nude mice. To our knowledge, the concept of enumerating circulating cells with diffuse fluorescence light has not been described previously. We anticipate that our DFFC instrument will have many potential applications in biomedical research, including the detection of cancer metastasis at earlier stages and counting circulating hematopoietic stem cells in vivo. 2.Methods and Materials2.1.System DescriptionA schematic diagram and photograph of the DFFC instrument is shown in Figs. 1(a) and 1(b), respectively. The sample—either a limb mimicking flow phantom or a mouse limb—was placed in the center of the custom-made ring and could be illuminated by two solid-state lasers emitting at 642 nm (DL640-050-O, CrystaLaser, Inc., Reno, NV). The output of each laser was passed through 640-nm excitation clean-up filters with a 10-nm bandpass (Z640/10x, Chroma Technology, Rockingham, VT), and the power of the sample was 15 mW with a spot size of 1 mm diameter. For the work described in this article, only a single laser was operated in continuous wave (CW) mode, but as we discuss, in the future we plan to modulate both lasers so as to allow coarse tomographic localization of fluorescent cells in the cross-section of the phantom or mouse limb. Fig. 1(a) A schematic of the diffuse fluorescence flow cytometry instrument, and (b) a photograph of the device during in vivo operation with a limb-mimicking optical flow phantom (inset). The position of the six detection fibers (D1 to 6) are shown.  Emitted fluorescence signal from the sample was detected with six optical fibers that were arranged around the ring holder as shown in Fig. 1. Six detector fibers were used so as to allow close to full-angle collection of the emitted fluorescent light. As we demonstrate, the signal from individual fluorescent microspheres and fluorescently labeled cells was detectable on each of the six detection channels, but in this work, these were summed to improve the overall signal-to-noise ratio (SNR). Specially cut filters centered at 700 nm with a 50-nm bandpass (ET700/50, Chroma Technology, Rockingham, VT) were placed in front of collection fibers; this blocked diffusely and specularly reflected light from directly entering the fiber and generating secondary autofluorescence. On the opposite end, the fibers were terminated on a custom-designed filter housing with collimating lenses and a second, 700-nm filter (Chroma) placed in front of each anode of an eight-channel PMT array (H9530-01, Hamamatsu Photonics, Japan). The use of two filters for each detector fiber was empirically determined to be necessary since the emitted fluorescence from individual cells was very small, and even modest amounts of autofluorescence or laser light leakage could obscure the signal. The output from each channel of the PMT was then amplified with a 1.6 GHz, eight-channel preamplifier with 26 dB gain (HFAM-26dB-10, Boston Electronics, Boston, MA) and passed into an eight-channel multichannel scalar (MCS) photon counting card (PMM-328, Boston Electronics) installed in a personal computer (NIXSYS Open Systems, Santa Ana, CA). This instrument design allowed high-sensitivity photon counting from each of the six detection optical fibers simultaneously (the two additional PMT channels were unused). The photon-counting threshold was set to for each channel, and the sampling rate was set to a rate of . The maximum number of photon counts per time sample was 65,535 (hardware limited) on each of the six detection channels. For each experiment, the MCS card was configured to acquire continuously for 7500 samples, which was equivalent to 75 s. The 75 s measurement “run” could be repeated an arbitrary number of times with approximately a 0.1-s time delay between cycles to allow for writing of the data to the hard drive. Experimental automation was performed using the analog outputs of a multifunction data acquisition card (DAQ; NI-USB-6251, National Instruments, Austin, TX) controlled with the same personal computer. 2.2.Limb-Mimicking Optical Flow PhantomsTo test and characterize our instrument, we first developed an optical flow phantom with similar size, optical properties, and flow speeds as a mouse limb or tail [Fig. 1(b), inset]. The phantoms were constructed from polyester resin material (Casting Craft, Fields Landing, CA) with titanium oxide (; Sigma-Aldrich, Inc., St. Louis, MO) and India ink (Higgins Ink, Bellwood, IL) added to adjust the optical properties.23 Phantoms were first made with final optical properties close to that of biological tissue at near-infrared wavelengths,24 specifically with the reduced scattering coefficient and absorption coefficient (these baseline optical properties were used for all experiments in this paper unless otherwise specified). The liquid resin material was placed in a 3-mm diameter by a 1-cm cylindrical mold with a length of 250 μm internal diameter Tygon tubing (TGY-010-C, Small Parts, Inc., Seattle, WA) passed through the center before hardening. During phantom characterization experiments, the Tygon tubing was connected to a 30-gauge insulin syringe (Easy Touch, Loveland, OH) that contained a solution of either fluorescent microspheres or fluorescently labeled cells as described below. The syringe was placed in a microsyringe pump (70-2209, Harvard Apparatus, Holliston, MA) that could be configured to produce linear flow rates in the range of to . A new flow phantom was used for each of the experiments described herein. Second, to investigate the effect of the flow phantom optical attenuation on the measured fluorescence signal, we constructed a set of phantoms with increasing concentrations of India ink. Specifically, the final absorption coefficients of the phantoms were , 0.25, 0.4, and . This was repeated four times for each ink concentration. 2.3.Fluorescent MicrospheresCharacterization of the DFFC instrument was first performed using commercially available flow cytometry calibration microspheres (6-µm PeakFlow Claret, P-24670, Invitrogen, Carlsbad, CA) with an absorption peak near 645 nm and an emission peak near 695 nm. These microspheres were chosen since they have similar absorption and emission characteristics, such as the Cy5.5, Alexafluor-680, and Vybrant-DiD NIR fluorescent dyes that we anticipate using with our system. Further, according to the manufacturer’s specifications, these microspheres have similar size and fluorescence emission intensity as fluorescently labeled cells. Before each experiment, the microspheres were diluted and suspended in phosphate-buffered saline (PBS) solution at final concentrations between and . Before dilution, and before each experiment, the microsphere suspensions were sonicated for 5 min (2510, Branson Ultrasonics Corp., Danbury, CT) to prevent clumping. 2.4.Characterization of DFFC Detection SensitivityTo determine the counting accuracy of our DFFC instrument, microspheres were suspended in PBS and 250 μL samples were passed through a flow phantom at a constant linear flow speed of . For these experiments, a total of eight samples in the range of less than were prepared; i.e., in the target sensitivity range of our instrument. Accurate dilution of microsphere solutions at very low concentrations is difficult. Therefore, to obtain “true” microsphere concentrations, the samples were collected in a microcentrifuge tube after analysis. These were subsequently counted with a commercial flow cytometer (Cell Lab Quanta SC, 771917, Beckman Coulter, Brea, CA), which has accuracy in the range of to . To obtain a total microsphere count with our DFFC instrument, we applied a thresholding algorithm to our measured data as follows. As will be shown, when a fluorescent microsphere passed through the instrument detection ring, a transient fluorescence signal (i.e., a “spike”) was recorded. The signal from all six detection channels were summed, and any fluorescence spike exceeding one standard deviation above the maximum measured background—determined by first running a blank sample of PBS through the flow phantom—was counted as a single microsphere. In practice, this threshold was approximately 300 photon counts. The count total for the 250 μL sample was then multiplied by 4 to arrive at a concentration in microspheres per mL for direct comparison to the commercial flow cytometer measurements. We note that we did not attempt to account for possible simultaneous arrival of more than one microsphere (i.e., “double spikes”) in this work. The implications of this are discussed below. 2.5.Characterization of the Useful DFFC Flow Speed RangeSince we anticipate that a large range of blood flow rates will be present in the instrument field of view in a mouse limb in vivo (i.e., in different-sized blood vessels), we next performed a series of experiments to determine the range of flow speeds for which our system could detect single microspheres. Microsphere suspensions were prepared in the range of to . Then 1-mL samples were run through the flow phantom at varying linear flow speeds between and . The latter value reflects a higher flow speed than we anticipate in limb blood vessels in mice in vivo,22,25,26 and the former is the lowest flow speed that the microsyringe pump could produce. Experiments were repeated three times for each flow speed. As above, the signals from all six channels were summed, and measured fluorescent spikes were analyzed for each to obtain the full width half maximum (FWHM), defined as the duration of time between data points with magnitude halfway between the maximum value for a given spike and the mean background. All spikes were analyzed for each experimental condition and the mean and standard deviation FWHMs were recorded. 2.6.Characterization with Fluorescently Labeled Cells in Flow Phantoms In VitroWe next tested the ability of the DFFC instrument to detect fluorescently labeled cells in our phantom model using either Jurkat -lymphocyte cells (American Type Culture Collection, Manassas, VA) or MM cells (Northwestern University, Chicago, IL). Jurkat -lymphocytes were cultured in tissue culture flasks at 37 °C in a humidified atmosphere with 5% and 95% air. The cells were cultured in RPMI 1640 supplemented with penicillin, streptomycin, and 10% fetal bovine serum (FBS). Cells were grown to confluence (approximately ) and then dyed with of Vybrant DiD (V-22887, Invitrogen) cell-labeling solution that had been incubated for 30 min. Vybrant-DiD is a nonspecific lipophilic dye that brightly labels cell membranes without loss of viability.12,13 The cell suspension was centrifuged and washed repeatedly in PBS and then resuspended in PBS at final concentrations of approximately . MM cells were harvested using trypsin, spun down at 400 g, and then resuspended in RPMI with 0.1% bovine serum albumin (BSA) at a concentration of . Cells were dyed using a final concentration of of Vybrant-DiD and incubated for 30 min at 37 °C. At the end of the incubation process, FBS was added (2% of total volume) to prevent cell clumping during centrifuging. Cells were centrifuged as before and washed, once with RPMI with FBS to remove any free DiD in suspension, and again with RPMI only. They were then resuspended at approximately . For these experiments, the syringe pump was configured to produce a linear flow speed of . Following data collection, the signal from each of the six detection channels was summed and the fluorescence spike amplitude from each cell was analyzed to determine the relative fluorescence intensity compared to fluorescent microspheres. The fluorescence signal from the cells and microspheres were also quantified with the commercial flow cytometer for comparison with our DFFC instrument. 2.7.Experiments in Mice In VivoAs an initial in vivo test of the DFFC instrument, we performed a limited number of experiments in mice with injected MM cells. All mice were handled in accordance with Northeastern University’s Division of Laboratory Animal Medicine policies on animal care. MM cells were used since they have been used previously for microscopy-based in vivo flow cytometry experiments12,13 and circulate with known kinetics. Further, as we demonstrate, MM cells exhibited better Vybrant-DiD labeling (measured intensity) than Jurkat cells. Nude (nu/nu) mice first were anesthetized using a cocktail of ketamine () and xylazine (), injected i.p. The mice were then placed on an adjustable platform with a warming pad and their tails were passed through the detection ring. Each tail was gently secured at each end with medical tape so that it would remain taut (but not tight enough to restrict circulation) in order to minimize breathing movement artifacts. A total of Vybrant-DiD-labeled MM cells were suspended in 100 μL in RPMI. Cells were injected retro-orbitally into the mice () while the instrument was operating so that changes in the measured fluorescence signal could be observed immediately after injection. Measurements were made until approximately 15 min after injection. We also performed control (sham) injections with unlabeled MM cells on a separate set of mice (). 3.Results3.1.Fluorescent MicrospheresFigure 2 shows a sample data set collected from each of the six detection channels of the DFFC instrument over a 30-s interval when fluorescent microspheres were run through a limb-mimicking optical flow phantom. For this experiment, a concentration of with a flow speed of 1 cm/s was used. As each fluorescent microsphere passed through the instrument field of view, a transient fluorescent signal (i.e., a “spike”) was observed. As shown, the amplitudes of these spikes were typically in the range of 1000 to 5000 photon counts above the background, depending on the detection channel. We also note that we observed intraspike variability in amplitude and width even within a single detection channel. This was primarily due to variations in speed across the flow profile inside the Tygon tubing; i.e., because microspheres near the center of the tubing move faster than those near the walls of the tubing. This was confirmed by observing the movement of fluorescent microspheres in bare Tygon tubing with a fluorescence microscope. For all subsequent analysis in this work, the signal from the six channels was summed; i.e., integrated over all detection angles. This was not a necessary step since microspheres were detectable on individual channels, but it improved the instrument SNR. The exact improvement varied somewhat between experiments and detector channels but was generally by approximately 5 to 7 dB (e.g., for the data in Fig. 2, the average channel SNR was approximately 19 dB, whereas the SNR of the summed signal was approximately 26 dB). As we discuss, we plan in future work to treat the signal from each channel independently, specifically to approximately localize the fluorescent microsphere or cell tomographically in the cross-section of the sample. Fig. 2Sample fluorescence signals from detector channels D1 to 6 (a–f) as microspheres passed through a limb-mimicking flow phantom at a concentration of and a linear flow speed of . Transient “spikes” (shown as arrows, panel a) were detected as each microsphere passed through the instrument field of view. 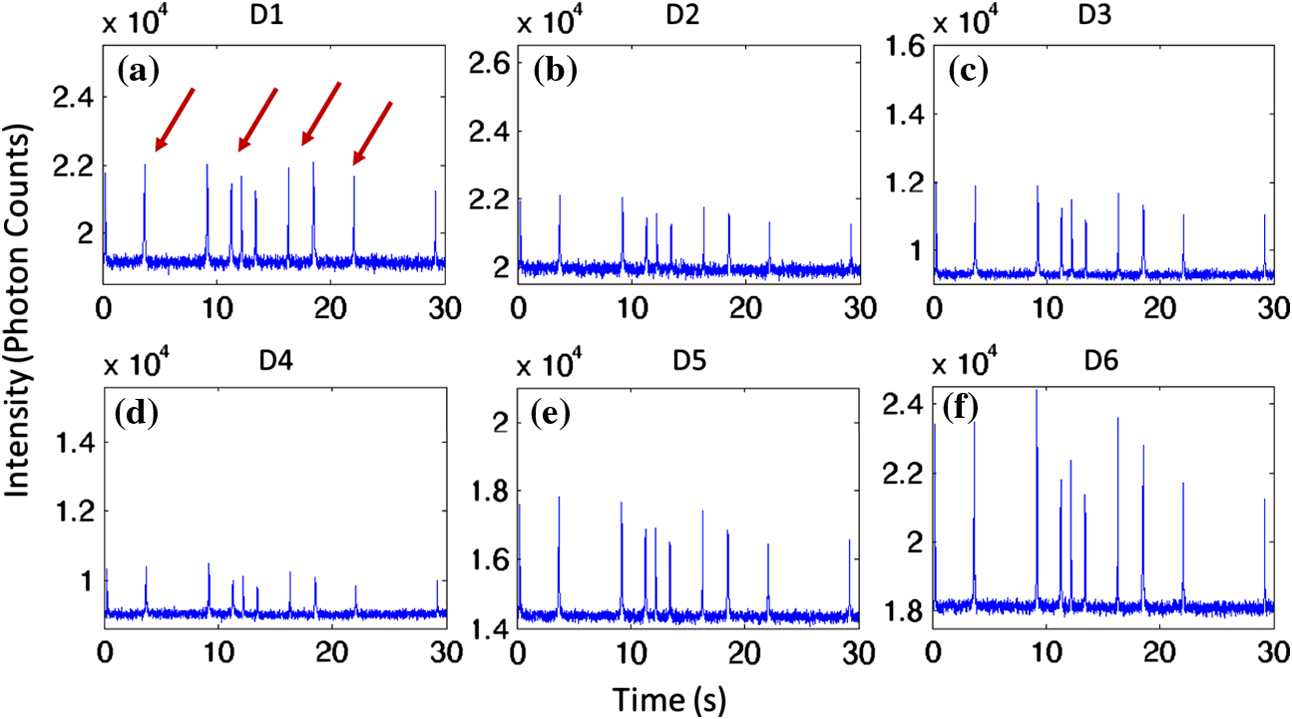 3.2.Effect of the Optical Phantom Absorption Coefficient on Measured SignalsTo investigate the effect of varying the optical absorption of our flow phantoms on the measured fluorescence signal, we increased the quantity of India ink so that increased from 0.1 to . These data are summarized in Fig. 3. Unsurprisingly, increasing the absorption coefficient reduced the amplitude of measured spikes; specifically, increasing by a factor of 5.5 decreased the amplitude of the measured spikes by a factor of 4. However, microspheres were easily detectable above the background in all cases. This range of absorption coefficients covers reported literature values in the red and near-infrared region for biological tissues24 and therefore shows the feasibility of this technique in a phantom model. Further, we added ink to the PBS media in which the microspheres were suspended so that of the media increased from 0 to . Increasing the absorption coefficient here had only negligible effect on the measured spike height in this range (data not shown) since the volume of PBS in the 250-μm diameter tubing was very small compared to the bulk phantom material. 3.3.Analysis of DFFC Detection SensitivityWe next characterized the detection sensitivity of our DFFC instrument in our flow phantom model. Using the thresholding algorithm described above, we counted the number of microspheres measurable with our system in 250 μL samples and then compared this concentration to that obtained with the same sample using a commercial flow cytometer. Figure 4 shows a cell count comparison between microspheres on our DFFC instrument and the flow cytometer for a set of eight experiments, all of which were in the target concentration range of less than cells per mL. The dashed line indicates the ideal 1–1 correspondence between the two systems. Generally, we observed very good correlation between the two instruments, with a mean error of less than 20%. We note that the microsphere concentrations used here were at least an order of magnitude below the recommended operating range of the commercial flow cytometer of . Therefore, deviations between the two measurements are at least partly due to the accuracy of the commercial system at low concentrations (as opposed to our DFFC prototype). From these data, we conclude that our DFFC instrument could detect individual microspheres with very high sensitivity. 3.4.Analysis of DFFC Flow Speed RangeTo ensure that the DFFC instrument was capable of detecting single microspheres over a large range of blood vessel flow speeds, we investigated the effect of varying the speed from to on the measured fluorescence spike width. For these experiments, microsphere concentrations between and were used. These data are summarized in Fig. 5. Each data point represents the mean and standard deviation of at least 100 fluorescent spikes at each flow speed. The highest flow speed () represents a faster speed than occurs normally in blood vessels in mice in vivo.22,25,26 The slowest flow speed used here () was the lower limit that could be produced with our microsyringe pump rather than a detection limit of our instrument. We note that the relatively large standard deviations for each point shown do not reflect error in the measurements, but real observed variations in flow speeds of the microspheres across the flow profile as discussed above. Finally, it is interesting to note that the linearity of the curve plotted on a log-log scale is consistent with the anticipated relationship, since the product of each FWHM and flow speed combination must equal the fixed instrument field of view. Therefore, from this analysis, we were able to estimate that the field of view of the DFFC instrument is approximately 0.7 mm. 3.5.Detection of Fluorescently Labeled Cells in Flow PhantomsWe next tested the ability of our DFFC instrument to detect fluorescently labeled cells (as opposed to microspheres) through the diffusive optical flow phantom. Vybrant-DiD-labeled Jurkat -Lymphocyte cells and MM cells were used. Sample data summed from all six detection channels are shown in Fig. 6. Here, a constant flow speed of 1 cm/s and cell concentrations of approximately were used. Sample data from Vybrant-DiD-labeled Jurkat cells [Fig. 6(a)] and MM cells [Fig. 6(b)], as well as data measured from fluorescent microspheres [Fig. 6(c)], are shown for comparison. The relative mean and standard deviation of measured fluorescent spike heights for each case are shown in Fig. 6(d), averaged over 1000 individual spikes. From these data, it can be seen that microspheres had the highest fluorescence intensity on average, followed by MM cells and Jurkat cells, which exhibited about 48% and 10% of the fluorescence intensity of the microspheres, respectively. These relative intensities also generally agreed well with conventional flow cytometry analysis [Fig. 6(d)], which showed that MM cells were on average about 50% as bright as fluorescent microspheres, and Jurkat cells were approximately 6% as bright. In summary, this series of experiments demonstrated that, although fluorescently labeled cells exhibited a lower level of emitted fluorescence than the fluorescent microspheres, our DFFC prototype could robustly detect diffuse fluorescent light from individual cells passing through an optical flow phantom. Fig. 6Sample fluorescence signals measured from Vybrant-DiD-labeled (a) Jurkat -lymphocyte cells (b) MM cells and (c) fluorescent microspheres through flow phantoms. Fluorescent spikes measured with the DFFC instrument were analyzed from each, and the mean and standard deviation (d) are shown. These data generally agree well with intensity analysis obtained using a commercial flow cytometer (d, inset). 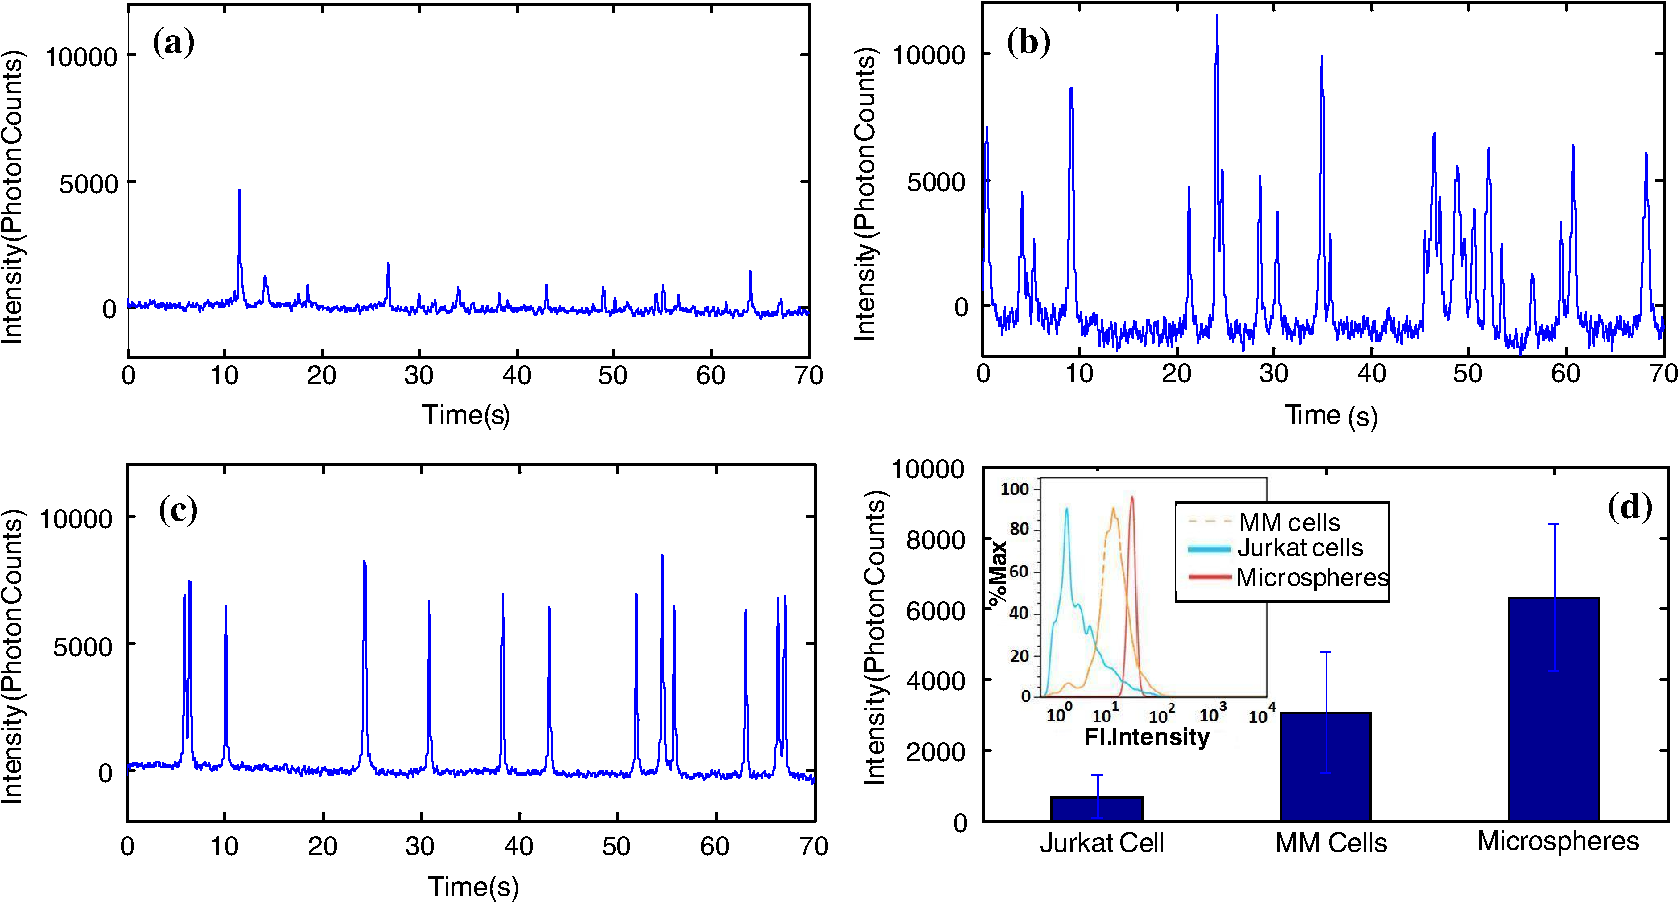 3.6.Experiments in Mice In VivoFinally, we conducted preliminary in vivo testing of our DFFC instrument in mice, with results shown in Fig. 7. After being anesthetized, nu/nu mice were placed on the translation platform and their tails placed inside the detection ring of our instrument. While the DFFC instrument was in operation, a total of cells suspended in 100 μL of media were injected retro-orbitally. Sample data for mice injected with fluorescently labeled MM cells and unlabeled control cells are shown in Figs. 7(a) and 7(b), respectively. We note here that the time scale is approximately 15 min for both experiments (i.e., significantly longer than that shown in previous figures), and the data from multiple time bins has been summed to 0.1-s increments. Magnified (120-s) portions of the curves are shown in the inset figures. Arrows indicate the time of the retro-orbital injection, and the signal fluctuations immediately prior to these were caused by unavoidable movement of the mouse during the injection. When fluorescently labeled cells were injected, an increase in the measured fluorescence signal due to the bolus of cells entering the bloodstream was observed within seconds. This increase began to decay over the course of several minutes, which we interpret to be due to the dilution of the bolus of injected cells in the mouse blood volume. On top of the larger bolus, individual fluorescent spikes were detected, which we interpret to be due to brightly labeled fluorescent cells passing through the instrument field of view. In additional experiments that were performed (data not shown), these spikes were observable up to 1 hour after injection. The average FWHM of the measured fluorescent spikes was about 0.23 s, which corresponds to a linear flow speed inside the instrument field of view of approximately (Fig. 5). This speed agrees well with reported literature values of average flow speeds in mouse tail arteries of less than .22,25,26 We note that relatively small numbers of fluorescent spikes were observed here, paradoxically because large numbers of cells were injected in these tests. This resulted primarily in a DC fluorescence increase as a result of the bolus, as opposed to many individual spikes as in our phantom experiments. Fig. 7The measured fluorescence signal from the tail of a mouse over approximately 15 min. when (a) Vybrant-DiD-labeled MM cells and (b) unlabeled control cells were injected retro-orbitally. Inset: magnified sections of the curves.  In contrast, when unlabeled control cells were injected [Fig. 7(b)], neither the bolus nor individual fluorescent spikes were observed. The measured average background autofluorescence signal was similar in amplitude to that observed in the phantom. However, inspection of the data revealed that there was a small but consistent 1 to 2 Hz component in the signal, which we attribute to artifacts from breathing movements of the mouse (this component was not present in the detected signal in our phantom studies). While the amplitude of this signal component was significantly lower than the fluorescent signals from circulating cells, minimization of these motion artifacts by carefully securing the tail was nonetheless critical in these experiments. Finally, we note that a steady decrease in the background signal of about 1% per minute was observed over the course of all the experiments. The cause for this decrease is unclear, but we hypothesize that it may be due to a decrease in the core temperature of the mouse during the experiment or photobleaching of native tissue chromophores. 4.Discussion and ConclusionsIn this work, we described and characterized a new instrument for detecting circulating cells in mice with diffuse fluorescent light. We demonstrated that the DFFC instrument is capable of robustly detecting individual fluorescent microspheres and fluorescently labeled cells in an optical flow phantom with similar size as a mouse forelimb, hindlimb, or tail and with optical properties in the range of reported literature values for biological tissue in the red and near-infrared region (; to ). While our experiments with Vybrant DiD-labeled cells indicated that the signal from fluorescent microspheres was larger than labeled cells, MM cells were nonetheless brightly labeled (at approximately 50% of the intensity of microspheres) and these were easily detectable with our DFFC instrument. Labeled Jurkat -Lymphocyte cells had an average of about 6% of the brightness of the microspheres, and our analysis indicates that we detected about 50% of these cells with our instrument in our in vitro flow phantom studies. As we discussed, the most difficult engineering challenge we faced was rejection of interfering background autofluorescence, which was found to originate from the optical flow phantom or mouse limb in the instrument field of view, but also the experimental apparatus itself (e.g., the optical fibers). Since even modest amounts of autofluorescence could obscure the very weak fluorescence signal from individual cells, significant effort was required to minimize this background signal in the development phase of this work, specifically with respect to instrument geometry and selection of appropriate excitation and emission filters. With respect to the detection sensitivity and count accuracy, our data indicated (Fig. 3) that the measured count rate of our DFFC prototype correlated very well with conventional flow cytometry in the target sensitivity range of . As discussed, we did not attempt to account for the simultaneous arrival of multiple microspheres in the instrument field of view with our cell-counting algorithm. However, at higher concentrations, our threshold approach could lead to undercounting errors; i.e., since simultaneous arriving cells would be single-counted. This issue could be addressed in the future by using more sophisticated counting algorithms (for example, by analyzing the measured pulse width and height). However, we note that this issue is not of immediate concern since our goal is to detect cells at very low concentrations (of total). An obvious challenge in applying our DFFC instrument to accurate cell counting (as opposed to cell detection) in mice in vivo is the variation in the number, direction, and flow speed ranges of blood vessels in a tail or limb. With respect to flow speed, our analysis (Fig. 4) demonstrates that the DFFC is capable of robustly detecting cells over several orders of magnitude of flow speeds. As we have noted, the highest flow speed used () was higher than the anticipated arterial blood flow speeds in mice. On the other hand, the lower limit of detection will be defined practically by the ability to identify a fluorescence signal as a “spike.” In particular, very slow moving cells will yield very long fluorescent signals; for example, a cell moving at would produce a transient signal with a FWHM of approximately 14 s (assuming a 0.7-mm field of view). Careful analysis of measured data sets would therefore be required to distinguish this effect from instrument DC drift. Second, the presence of multiple blood vessels within the DFFC field of view in vivo presents a challenge in accurate quantification of the number of circulating cells. We have conducted a series of experiments in phantoms with multiple embedded flow channels (not shown) and demonstrated that the DFFC instrument can detect cells from multiple vessels simultaneously. However, it is conceivable (or even likely) that a single cell in vivo may pass through the instrument more than once on its return trip through the vasculature, so that cells may be double-counted. To address this issue, we are developing algorithms to localize the fluorescent cell in the cross-section of the instrument field of view tomographically using differences in the measured signal amplitude on the six detector channels (although beyond the scope of the current work, we have recently shown that this is possible using two modulated light sources and plan to report this in a forthcoming article). We will use this data in combination with a priori anatomical information to identify approximately the location of the blood vessel in which the cell is moving to avoid double-counting. We also note that ultimately our goal is not to provide an absolute count of circulating cells, since it is entirely conceivable that a given circulating cell may happen not to pass through a blood vessel in the DFFC field of view during an acquisition (or, as we have already noted, a cell may pass through the field of view multiple times). Rather, our intention is to use the count rate (detected cells per minute) as a metric to quantify relative changes in circulating cell populations in response to, for example, disease progression1 or disruption of the homing process,20 as is often done for microscopy-based IVFC applications but at significantly lower cell concentrations. Our hypothesis is that, given sufficiently long acquisition times—on the order of 15 to 30 min—mixing of the blood volume will be sufficient so that count rates will be statistically accurate. Testing of this hypothesis is the subject of ongoing research. Finally, we performed a feasibility test of the DFFC instrument in detecting fluorescently labeled MM cells in the tails of nude mice in vivo. For this initial set of experiments, relatively large numbers of cells were injected ( in 100 μL), which resulted primarily in a DC increase in the detected fluorescent signal with a relatively small number of measured fluorescent spikes. We note that the use of retro-orbital injections most likely resulted in significant loss of cells at the injection site, so the actual number of circulating cells in these experiments is not known. More accurate quantification, using concurrent measurements with microscopy-based IVFC, is the subject of ongoing work. In future work, we will reduce the concentration of injected cells by several orders of magnitude until the target instrument sensitivity range of less than in circulation is reached. We also tried placing the DFFC ring around the forelimb of a mouse when fluorescently labeled MM cells were in circulation, which resulted in measurement of slightly larger fluorescent spikes than in the tail (presumably because of lower optical absorption), but movement artifacts were significantly larger since the forelimb was more difficult to immobilize. As we discussed, movement artifacts in the range of 1 to 2 Hz were present in the measured signal in the tail even in control mice, and special care was taken to minimize tail movement from breathing. In the future, we plan to add additional “out-of-band” detection wavelengths to the DFFC to allow better subtraction of interfering background signals. In summary, in this work we described a new instrument to detect fluorescently labeled cells using diffuse light in mice in vivo. Translation of this approach to larger clinical scales, while of potential interest in the longer term, is beyond the immediate intent of this work. This will allow interrogation of large blood volumes (up to 0.2 to 0.5 mL of blood per minute), which in principle would allow sampling of the entire blood volume of a mouse in minutes. This would not only increase the sampling rate but would allow the detection of circulating cells at several orders of magnitude lower concentration than is currently possible. We anticipate that this instrument would have many applications in preclinical biomedical research, including enumeration of circulating tumor cells at early stages, as well as tracking of hematopoietic stem cells in vivo. AcknowledgmentsThis work was funded with a grant from the National Institutes of Health (R21 HL098750-01) and from a Northeastern University laboratory startup grant. The assistance of Dr. Riikka Pastila and Tushar Swamy in conducting experiments is also gratefully acknowledged. ReferencesM. Cristofanilliet al.,
“Circulating tumor cells, disease progression, and survival in metastatic breast cancer,”
N. Engl. J. Med., 351
(8), 781
–791
(2004). http://dx.doi.org/10.1056/NEJMoa040766 NEJMAG 0028-4793 Google Scholar
J. B. SmerageD. F. Hayes,
“The prognostic implications of circulating tumor cells in patients with breast cancer,”
Cancer Invest., 26
(2), 109
–114
(2008). http://dx.doi.org/10.1080/07357900701784204 CINVD7 0735-7907 Google Scholar
T. Bauernhoferet al.,
“Association of disease progression and poor overall survival with detection of circulating tumor cells in peripheral blood of patients with metastatic breast cancer,”
Oncol. Rep., 13
(2), 179
–184
(2005). OCRPEW 1021-335X Google Scholar
S. Mocellinet al.,
“The prognostic value of circulating tumor cells in patients with melanoma: a systematic review and meta-analysis,”
Clin. Cancer Res., 12
(15), 4605
–4613
(2006). http://dx.doi.org/10.1158/1078-0432.CCR-06-0823 CCREF4 1078-0432 Google Scholar
S. Riethdorfet al.,
“Detection of circulating tumor cells in peripheral blood of patients with metastatic breast cancer: a validation study of the CellSearch system,”
Clin Cancer Res., 13
(3), 920
–928
(2007). http://dx.doi.org/10.1158/1078-0432.CCR-06-1695 CCREF4 1078-0432 Google Scholar
H. M. Shapiro, Practical Flow Cytometry, Wiley-Liss, New York
(1995). Google Scholar
C. F. Craddocket al.,
“Circulating stem cells in mice treated with cyclophosphamide,”
Blood, 80
(1), 264
–269
(1992). BLOOAW 0006-4971 Google Scholar
S. Nagrathet al.,
“Isolation of rare circulating tumour cells in cancer patients by microchip technology,”
Nature, 450
(7173), 1235
–1239
(2007). http://dx.doi.org/10.1038/nature06385 NATUAS 0028-0836 Google Scholar
R. Huanget al.,
“A microfluidics approach for the isolation of nucleated red blood cells (NRBCs) from the peripheral blood of pregnant women,”
Prenat. Diagn., 28
(10), 892
–899
(2008). http://dx.doi.org/10.1002/pd.v28:10 PRDIDM 1097-0223 Google Scholar
X. Chenget al.,
“A microfluidic device for practical label-free CD4(+) T cell counting of HIV-infected subjects,”
Lab. Chip., 7
(2), 170
–178
(2007). http://dx.doi.org/10.1039/b612966h LCAHAM 1473-0197 Google Scholar
J. Hoff,
“Methods of blood collection in the mouse,”
Lab. Animal, 29
(10), 47
–53
(2000). Google Scholar
J. Novaket al.,
“In vivo flow cytometer for real-time detection and quantification of circulating cells,”
Opt. Lett., 29
(1), 77
–79
(2004). http://dx.doi.org/10.1364/OL.29.000077 OPLEDP 0146-9592 Google Scholar
C. Altet al.,
“Retinal flow cytometer,”
Opt. Lett., 32
(23), 3450
–3452
(2007). http://dx.doi.org/10.1364/OL.32.003450 OPLEDP 0146-9592 Google Scholar
V. P. ZharovE. I. GalanzhaV. V. Tuchin,
“Photothermal image flow cytometry in vivo,”
Opt. Lett., 30
(6), 628
–630
(2005). http://dx.doi.org/10.1364/OL.30.000628 OPLEDP 0146-9592 Google Scholar
V. P. Zharovet al.,
“Photoacoustic flow cytometry: principle and application for real-time detection of circulating single nanoparticles, pathogens, and contrast dyes in vivo,”
J. Biomed. Opt., 12
(5), 051503
(2007). http://dx.doi.org/10.1117/1.2793746 JBOPFO 1083-3668 Google Scholar
W. Heet al.,
“In vivo quantitation of rare circulating tumor cells by multiphoton intravital flow cytometry,”
Proc. Natl. Acad. Sci. U S A, 104
(28), 11760
–11765
(2007). Google Scholar
S. Boutruset al.,
“Portable two-color in vivo flow cytometer for real-time detection of fluorescently-labeled circulating cells,”
J. Biomed. Opt., 12
(2), 020507
(2007). http://dx.doi.org/10.1117/1.2722733 JBOPFO 1083-3668 Google Scholar
C. F. Zhonget al.,
“Quantitative two-photon flow cytometry—in vitro and in vivo,”
J. Biomed. Opt., 13
(3), 034008
(2008). http://dx.doi.org/10.1117/1.2931077 JBOPFO 1083-3668 Google Scholar
Y. C. Changet al.,
“Fiber-optic multiphoton flow cytometry in whole blood and in vivo,”
J. Biomed. Opt., 15
(4), 047004
(2010). http://dx.doi.org/10.1117/1.3463481 JBOPFO 1083-3668 Google Scholar
Y. Alsayedet al.,
“Mechanisms of regulation of CXCR4/SDF-1 (CXCL12)-dependent migration and homing in multiple myeloma,”
Blood, 109
(7), 2708
–2717
(2007). BLOOAW 0006-4971 Google Scholar
A. K. Azabet al.,
“CXCR4 inhibitor AMD3100 disrupts the interaction of multiple myeloma cells with the bone marrow microenvironment and enhances their sensitivity to therapy,”
Blood, 113
(18), 4341
–4351
(2009). http://dx.doi.org/10.1182/blood-2008-10-186668 BLOOAW 0006-4971 Google Scholar
S. Wagneret al.,
“Time-of-flight quantitative measurements of blood flow in mouse hindlimbs,”
J. Magn. Reson. Imaging, 19
(4), 468
–474
(2004). Google Scholar
J. Baetenet al.,
“Development of fluorescent materials for Diffuse Fluorescence Tomography standards and phantoms,”
Opt. Express, 15
(14), 8681
–8694
(2007). http://dx.doi.org/10.1364/OE.15.008681 OPEXFF 1094-4087 Google Scholar
M. J. NiedreG. M. TurnerV. Ntziachristos,
“Time-resolved imaging of optical coefficients through murine chest cavities,”
J. Biomed. Opt., 11
(6), 064017
(2006). http://dx.doi.org/10.1117/1.2400702 JBOPFO 1083-3668 Google Scholar
L. A. Schildmeyeret al.,
“Impaired vascular contractility and blood pressure homeostasis in the smooth muscle alpha-actin null mouse,”
FASEB J., 14
(14), 2213
–2220
(2000). Google Scholar
A. K. Reddyet al.,
“Noninvasive blood pressure measurement in mice using pulsed Doppler ultrasound,”
Ultrasound Med. Biol., 29
(3), 379
–385
(2003). http://dx.doi.org/10.1016/S0301-5629(02)00746-9 USMBA3 0301-5629 Google Scholar
|