
|
|
1.IntroductionFiber loop ringdown (FLRD) technology, evolved from cavity ringdown spectroscopy, has become an emerging time-domain sensing technique for the development of fiber optic sensors and sensor networks.1,2 In the FLRD technique, light source fluctuations have a minimal adverse impact on the time-domain detection scheme and the detectivity is enhanced by the multi-pass feature of the ringdown technique. Fundamentally, FLRD combines the advantages of cavity ringdown spectroscopy including high detection sensitivity, fast response, and insensitivity to light source fluctuations with features of fiber optic sensors such as a small-footprint, light-weight, and low-cost. During the last nine years, the FLRD-based fiber optic sensors have generated increasing interest in sensing applications. Early studies of the FLRD technique were focused on the detection of trace gases by implementing a small air gap in the fiber loop.3 Later, detections of small volumes of fluids,4 chemical vapors,5,6 and even a single bio-molecular cell7 have been successfully demonstrated. The FLRD technique has also been extended to sense physical parameters such as pressure,8 temperature,9 strain,10 and fiber refractive index11 by using different sensing mechanisms at a sensor head. The incorporation of the evanescent field (EF) sensing mechanism into the fiber ringdown technique using a section of straightened, end-coated single mode fiber to form a high-finesse fiber ringdown cavity to explore EF absorption was first reported by von Lerber and Sigrist12 and later by Sara et al.5,7 who used a fiber loop to demonstrate the detection of the EF absorption of water and EF scattering of bio-molecular cells. Recently, the detection of EF absorption of dimethyl sulphoxide solutions in a fiber ringdown loop has also been reported.13 Very recently, studies of EF scattering loss in a fiber ringdown loop to detect DNA and bacteria have been reported.14 In this work, we propose a FLRD glucose sensor using refractive index-difference EF attenuation effect as a sensing mechanism. First, glucose oxidase (GOD) is immobilized on the surface of a section of partially-etched single mode fiber which acts as the sensor head. When GOD is exposed to a glucose solution, it reacts with glucose and generates gluconic which results in a change in the refractive index around the surface of the sensor head.15 Instead of detecting an index-based phase shift using a heterodyne interferometry technique or measuring a signal slope in optical coherent tomography as reported in recent studies of glucose sensors,15,16 the FLRD glucose sensor detects different optical losses due to changes in the surface index that are quantified by measuring different ringdown times. The objective of this study was to demonstrate the proof-of-the-concept of the FLRD glucose sensor. Several FLRD glucose sensors were fabricated and tested in different concentrations of standard glucose solutions and synthetic urine that ranged from to . In comparison, FLRD glucose sensors, which had no GOD coatings at the sensor head, were also tested in similar experimental settings. In this paper, we describe the concept of the sensor and report the results of the sensors’ reproducibility, response time, effect of the GOD coatings, and detection sensitivity of the FLRD glucose sensors. Exploration of potential applications of the sensors in near-real time monitoring of glucose will follow in future work. 2.Principle of EF-FLRD Fiber Glucose SensorIn FLRD, after injection of a laser pulse into a fiber loop, the temporal behavior of the output signal observed by the detector can be modeled by where is the light intensity at time in which we assume the time equals zero when the light source is shut off and a light pulse is injected into the loop, is the total length of the fiber loop, is the speed of light in a vacuum, is the average-refractive index of the fiber loop, and is the total fiber transmission loss, by percentage or by decibel, of the light in each round trip. The solution of Eq. (1) describes an exponential decay behavior of the light intensity observed by the detector: Equation (2) indicates that FLRD measures the light intensity decay rate and not the absolute intensity change, . Therefore, the measurement of is insensitive to fluctuations of the incident light intensity, . The time required for to decrease to of is referred to as the ringdown time, , and is given by For a given FLRD sensor, the total transmission loss, , is a constant, which is determined by the physical parameters of the sensor, such as the fiber absorption loss, the couplers’ insertion losses, the refractive index, and the fiber length. Apparently, the lower the losses of the light in the fiber, the longer the decay time constants, , will be. When a sensing activity occurs at one section, or sensor head, of the fiber loop, the result is an additional optical loss, , of the light pulse in the fiber loop, which causes a change in the ringdown time, , given by Eq. (3b). From Eqs. (3a) and (3b), we have: Assuming results exclusively from an EF-induced optical loss, EF attenuation, of the light transmitting through the sensor head and by further examining the EF attenuation due to EF absorption, scattering, or both,17 we can extend Eq. (4) as: where is the aforementioned etched fiber length at the sensor head and and are the light attenuation coefficients due to EF absorption and EF scattering respectively. In the absence of EF absorption, which is the case of the present work, the EF attenuation is from the EF scattering effect. The EF scattering loss depends on several parameters of the sensor head, including the diameter of the fiber core, EF penetration depth, and refractive index difference between the fiber core and the cladding. However, for a given EF-FLRD sensor head, the index difference, , determines the EF scattering loss and a smaller index difference, , corresponds to a lower EF scattering loss, a longer ringdown time.18,19 The EF attenuation at the sensor head becomes minimal when the index of the medium equals the index of the cladding of SMF.Two different approaches, the surface index-based sensing and bulk index-based sensing,20 are investigated in the fabrication of the EF-FLRD sensor heads in this study. In the former, the sensor head consists of a section of partially-etched SMF with GOD immobilized on the surface of the etched fiber. When GOD is exposed to a glucose solution, GOD reacts with glucose and generates gluconic acid, resulting in a change in the refractive index around the surface of the sensor head. The chemical reactions are described by:21 In the bulk index-based sensing, the sensor head is directly immersed in a glucose solution. The EF attenuation due to the index difference between the index of the effective fiber core and the index of the glucose solution is detected by observing a change in ringdown time. In either the surface index- or bulk index-based approach, the principle of the index-difference EF-FLRD glucose sensor is given by: In Eq. (7a), is the ringdown time when the sensor head, with or without the immobilized GOD, is exposed to air, is the ringdown time when the sensor head is exposed to an external medium such as a glucose solution, and represents an absolute difference, a.u., between the EF attenuation in air and in the glucose solution of the sensor head. is negative when , namely, . Experimentally, is determined by measuring the ringdown times when an EF-FLRD sensor head is exposed to air, , and when the sensor is immersed in a glucose solution, . Glucose solutions with different glucose concentrations have different refractive indices. Therefore, Eq. (7a) can be changed to: where ’s are constants for a given EF-FLRD glucose sensor exposed in a given medium and is the glucose concentration, % or , in DI water or in synthetic urine. When the glucose concentration is zero, represents the difference between the EF attenuation when the sensor head is exposed to air and the EF attenuation when the sensor head is immersed in DI water or synthetic urine without any addition of glucose. When the glucose concentration is low, and have a linear relationship under the first order approximation of Eq. (7b), but in higher concentrations, the equation shows a nonlinear relationship between and . Eqs. (7a) and (7b) represent the basic concept of the proposed EF-FLRD glucose sensor. The proposed formulation Eq. (7b) will be experimentally validated in this study via determining the relationships between and glucose concentration in both high, 1% to 10%, and low, 0.1 to 1% concentration ranges.3.Experimental SetupFigure 1(a) shows a schematic of the FLRD system similar to the one described in our previous study.19 The system consists of a continuous wave (CW) diode laser light source, two fiber couplers, a section of fused silica single mode fiber, a photodetector, and an electronic control. The cross-sections of the cladding and the fiber core of the single mode fiber, SMF-28e, Corning, Inc., have diameters of 125 μm and respectively. The two identical fiber couplers, Opneti Communications Co., were fabricated with a split ratio of 0.1:99.9 in the 2-leg end of the fiber couplers. The two 1-leg ends and the two 99.9% legs of each of the two couplers were spliced together, FITEL S321, Optical Fiber Cleaver; Ericsson 925, Fusion Splicer, to form a fiber loop, as shown in Fig. 1(a). The total optical loss, including absorption loss, fiber connectors’ insertion losses, and fiber couplers’ losses, was estimated to be . The splicing loss was estimated by the splicer and depended on each splicing case with a typical value of 0.02 to 0.04 dB. A narrow band, , single mode laser beam from the single mode fiber of the pig-tailed distributed feedback laser diode, NEL, Model NLK1S5AAA, was coupled into the fiber loop through the 0.1% leg with an FC/APC fiber connector, and the 0.1% leg of the second coupler was coupled to the InGaAs photodetector, Thorlabs, PDA50B. The total length of the loop was 120 m. Four initially identical fiber loops were used in this work, but after several rounds of cutting and splicing, the length of each loop and the total optical loss of each loop were slightly different. Consequently, each fiber loop gave a different ringdown time according to Eq. (3a). The absorption loss rate of the fiber was quoted to be at 1515 nm, and the wavelength of the laser diode had a tunable range of around the central wavelength of 1515 nm. In the present work, the diode laser wavelength was tuned precisely to 1515.25 nm. The output wavelength was monitored by a wavemeter, Burleigh, WA-1500, that had an accuracy of . Water and high abundance atmospheric molecules, such as oxygen, nitrogen, and carbon dioxide, have no absorption at 1515.25 nm. Therefore, the EF attenuation described in this study was assumed to be from the EF scattering loss only, in Eq. (5). Fig. 1Schematic of the evanescent field-fiber loop ringdown (EF-FLRD) glucose sensors. (a) The fiber loop ringdown system, (b) two types of sensor heads: without GOD coatings (left) and with GOD coatings (right).  When the detector observed a ringdown signal, this signal was applied to trigger a pulse generator, SRS, DG 535, to generate a series of negative square waves, 2.5 V and 10 to 100 Hz tunable. This pulsed series was then applied to the diode laser driver to rapidly drop the laser current to zero. Therefore, a series of laser pulses was generated from the cw diode laser. For each laser pulse, the detector observed a series of pulsed spikes resulting from each round trip of the laser pulse in the fiber loop. The intensity decay curve was monitored by an oscilloscope, Tektronix 410A, with a bandwidth of 400 MHz that was interfaced to a computer for further data processing. In the experiments, the triggering threshold was set at 0.5 V and the built-in amplifier of the detector was set at the level of 50 dB. For this experimental system, the ringdown time was on the order of μs and the time interval of two adjacent pulses was 10 to 100 ms, which guaranteed fast sampling rate up to 100 Hz. Figure 1(b) illustrates two typical sensor heads with and without GOD coatings. One section of fiber in each of the fiber loops had the plastic jacket removed and was then immersed in a 48% hydrofluoric acid, HF, solution. Length of these sections of fiber varied from 10.0 to 22.0 cm, depending on different sensor units. Figure 2 shows the real-time recording of a typical etching process. The section of fiber forming the sensor head was gradually etched away by the HF solution. When the etching process reached such a stage that the propagation of the EF became disturbed, Points B and C marked in Fig. 2, the observed ringdown time began to change due to the EF interaction in the interface between the surface of the un-etched fiber cladding and the solution. Afterward, ringdown time decreased as the EF attenuation increased. By continuously monitoring the ringdown time, the etching process of the fiber cladding was controlled in terms of the fiber diameter of the sensor head, and the entire etching process, Points A-D, lasted 42 min. After the etching process was completed, the etched fiber was immediately rinsed in DI water. In the experiments, a scanning electron microscopy (SEM) was used to image the surface of the etched fibers and quantify the etched fiber diameter as illustrated in Fig. 1(b). Fig. 2On-line monitoring of the etching process by recording ringdown times. A: the etching process started, B and C: evanescent field loss began to change, and D: the etching process was completed.  Immobilization of GOD on the surface of the etched fiber was achieved through a stepwise approach.15 First, the etched fiber was cleaned with DI water. Next, in order to immobilize GOD, the cleaned surface of the etched fiber was modified by immersing the fiber in an ethanol solution of amino linkage aldehyde group with 1% 3-propyl aldehyde for about 30 min. After that, the treated fiber was immersed in a GOD solution for 1 h at room temperature. The un-reacted aldehyde group in the fiber surface was removed by immersing the fiber in a 15 mM Tris buffer, T-B, for 10 min and the entire process was monitored by continuously recording ringdown times. The sensor head with the immobilized GOD was then ready for testing in glucose solutions. The glucose solutions in different concentrations, %, , or , were made by diluting a standard 10% glucose sample in DI water. Synthetic urine samples were prepared by adding 10% glucose solution to synthetic urine in different concentrations. Urine samples in different glucose concentrations were prepared by adding the standard 10% glucose solution to the synthetic urine, which was preheated for 8 s in a microwave oven up to 37 °C. The temperature of the urine sample solutions was kept at during testing. 4.Results and Discussion4.1.Detections of Glucose in Glucose SolutionsFigures 3(a) and 3(b) show the results of two repeated experiments using two FLRD glucose sensors with GOD coatings on the sensor heads. Each of the graphs shows the sensor’s response during the entire process, switching the etched bare sensor head between water and air, treating of the sensor head using the 1% aldehyde groups, immobilizing GOD, removing the un-reacted aldehyde groups using T-B, and testing the sensor head in air and different glucose solutions. The graph in Fig. 3(a) is marked in nine different zones, A-I. For example, zone A shows the sensor’s reproducible behavior when the sensor head was exposed to DI water and air. Due to the different index differences, (), the sensor read different ringdown times. when the sensor head was immersed in air. when the sensor head was immersed in distilled (DI) water. The 1.4491, 1.3330, and 1.0 are the refractive indices at 1515 nm of the fiber core, DI water, and air, respectively. The, , denotes that the fiber core in this study was actually an effective fiber core that consisted of the SMF core and the un-etched fiber cladding. The index of the effective fiber core should be slightly different from the index of the SMF core. In the text below, the fiber core at the sensor head is the effective fiber core. As described in Sec. 2, the smaller index difference between the fiber core and DI water corresponds to a lower EF attenuation and results in a longer ringdown time, as shown in zone A. In the upper parts of zones B-D, the sensor read different ringdown times due to different refractive indices of the 1% aldehyde, the GOD, and the T-B solutions. Comparison of the lower parts in zones B-D with the lower parts of zone A shows a noticeable difference in ringdown time. For example, when the sensor head was exposed to air, the lower part of zone C, right after the 1-h immersion in GOD solution, the observed ringdown time was 0.06 μs longer than the recorded ringdown time when the sensor head was exposed to air before the GOD coatings, the lower part of zone A. This ringdown time difference indicated that the sensor head had been effectively modified by the immobilized GOD. In other words, the immobilization GOD had changed the refractive index of the fiber surface. After a 10-min treatment of the un-reacted aldehyde using the T-B solution, the observed ringdown time dropped after the sensor head was removed from the T-B solution and placed in air. Without knowing the actual indices of the aldehyde groups, T-B solution, and the immobilized GOD layer, the different ringdown times indicated that those chemicals had different indices. Based on the one- standard deviation of the recorded ringdown time, which was 0.03 μs at 8.33 μs, the small ringdown time differences resulting from the different treatments, GOD and T-B, were noticeable. Fig. 3Response behavior of two EF-FLRD glucose sensors. Both sensors had a GOD coated sensor head. Zones A to D: fabrication of the sensor head; zones E-I: the sensor’s responses to the glucose solutions with different concentrations. (a) and (b) show the repeated experiments using two glucose sensors. 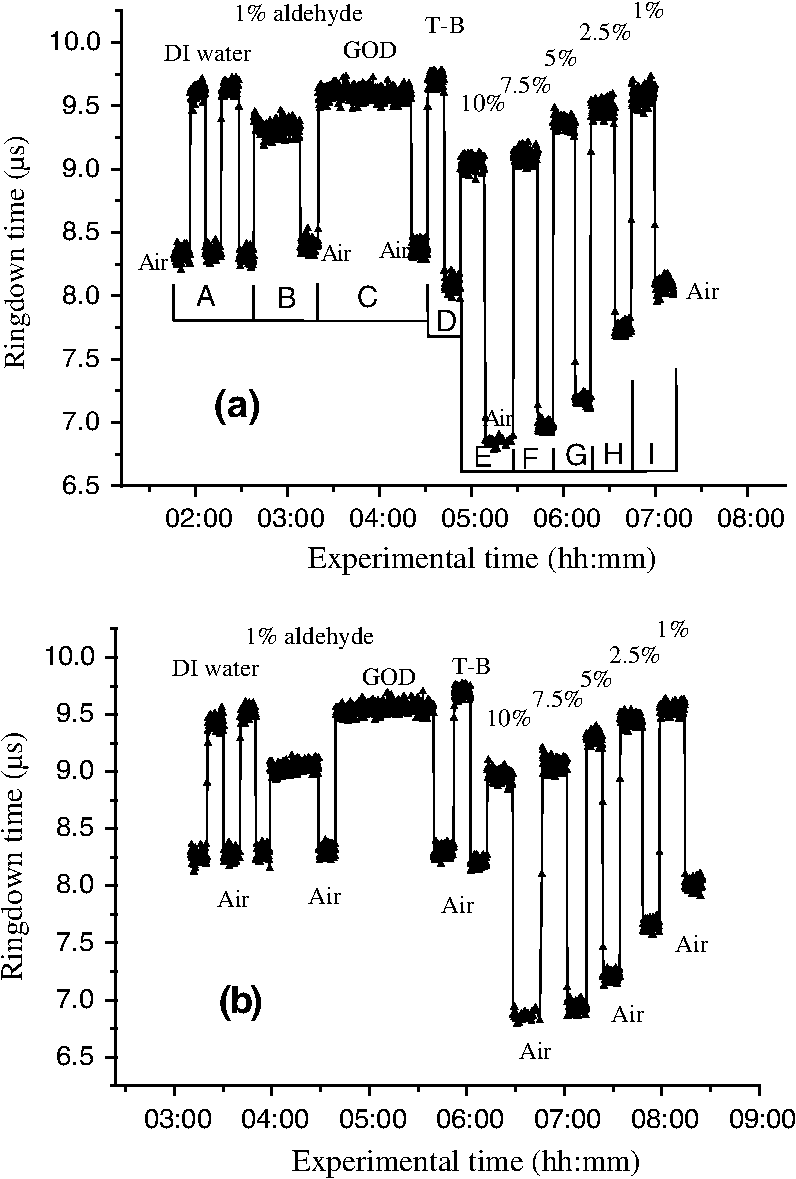 Zones E–I show the sensor’s responses to a change in the external media, such as when the sensor head was immersed in a 10% glucose solution for 12 min and then exposed to air for 12 min as shown by zone E in Fig. 3(a). Similar testing processes were repeated by exposing the sensor head to both air and different glucose solutions, zones F-I. The sensor read different ringdown times, , when the sensor head was immersed in different concentrations of glucose solutions. For instance, the observed ringdown time changed from 9.06 μs for the 10% glucose concentration to 9.58 μs for the 1% glucose concentration. One noteworthy point was that the sensor did not read the same ringdown time, , when the sensor head was exposed to air right after being removed from different glucose solutions, as shown in the lower parts of zones E-I. Comparison of different pairs of and obtained in each of the cases, E-I, shows that the sensor gave clearly different responses to the different glucose concentrations ranging from 1% to 10%, which corresponds to to . Figure 3(b) shows the results of the repeated experiment using the second sensor unit. Although the quoted specifications of the two fiber loops were the same, after a series of the lab-based fabrication processes of the sensor heads, such as etching, coating, and splicing, a small difference in the total optical loss between the two loops existed. Therefore, a noticeable difference between the ringdown time baselines, , of the two sensors was observed. However, the two sensors’ response behavior was reproducible. For example, the response time to a change in the external media and the general trend of the sensor’s response to different glucose concentrations were all reproducible. The experimental data were generated when the laser pulse repetition rate was set at 10 Hz. Each data point shown in Fig. 3 was collected by averaging over 100 ringdown events, 100 measurements, and the observed time interval between two adjacent data points in Fig. 3 was 10 s. With this setting, the sensors’ response time was or . Figures 4(a) and 4(b) show the curves of the EF attenuation, a. u., versus glucose concentration, %. The y-axis relates to the absolute value of defined in Eq. (7a). was determined by inserting the ringdown time measured in air, ), and the ringdown time obtained in a solution, , marked in each zone into Eq. (7a). For instance, in Fig. 3(a), and in zone E are 6.84 μs and 9.06 μs respectively and the absolute value of is 0.0236, a. u. The fitted curves in Figs. 4(a) and 4(b) show a nonlinear relationship between the EF attenuation and the glucose concentration in the examined range. In Fig. 4(b) especially, the signal seemed to be saturated in the higher concentration end of the graph. It should be noted that, no glucose samples in concentrations higher than 10% were used in this study. This non-linear relationship is consistent with our proposed expression given in Eq. (7b). Fig. 4The measured EF attenuation difference versus glucose concentration in glucose solutions. The dot denotes the experimental data and the line denotes a second order polynomial fitting. (a) The data was from Fig. 3(a); (b) the data was from Fig. 3(b). Both sensors showed a non-linear relation between and in the glucose concentration range of 1% to 10%. The observed trend was consistent with the proposed expression shown in Eq. (7b). 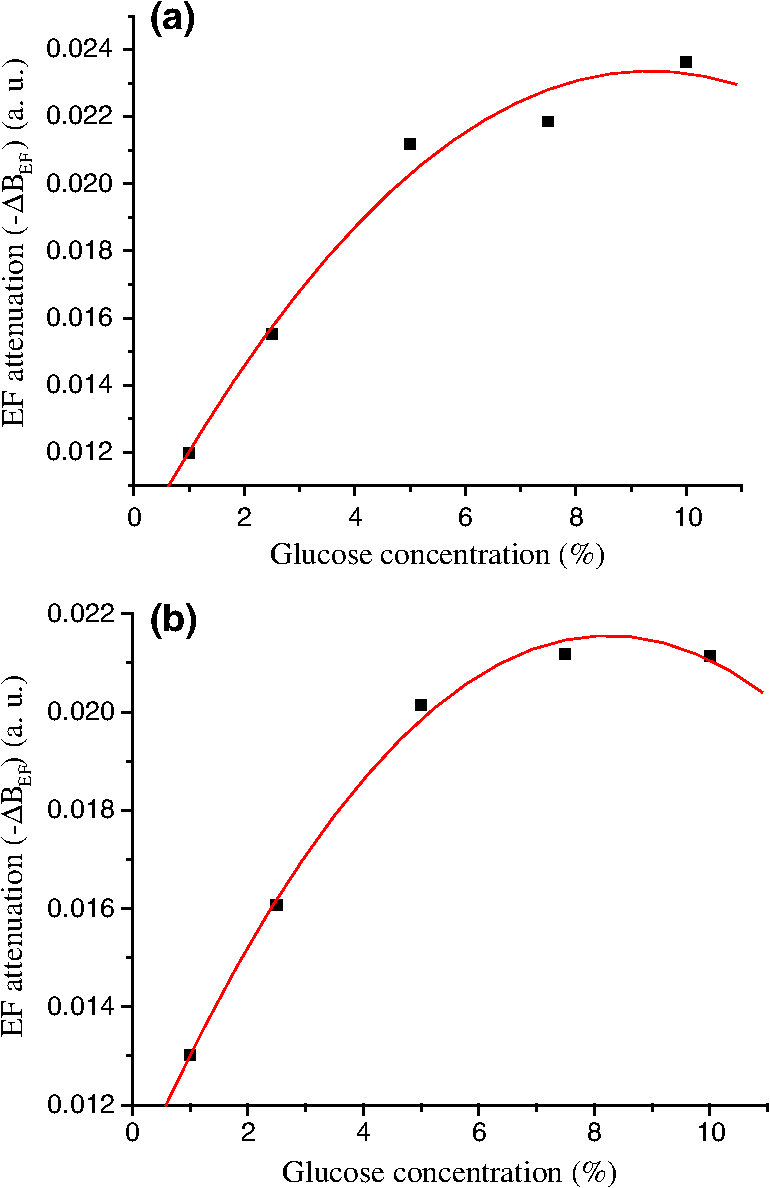 In order to compare the effects of the GOD coatings on the performance of the FLRD glucose sensors, two additional FLRD glucose sensors were fabricated using an etched bare SMF as the sensor head, and their responses to different glucose concentrations were also investigated. Figures 5(a) and 5(b) show the responses of these FLRD glucose sensors. Figure 5(a) shows the sensor’s response when the sensor head was switched between an external medium, DI water or a glucose solution, and air. For each tested medium, DI water or a glucose solution, the sensor was tested twice. In each case, the sensor showed good reproducibility. The sensor’s overall behavior was similar to the ones shown in Fig. 3. For instance, clear differences in the observed ringdown times were observed when the sensor head was immersed in different concentrations of glucose solutions ranging from 1% to 10%. Similarly, the lower parts of the graph showed clear differences in the ringdown baseline, , when the sensor head was removed from a glucose solution to air. This behavior was the same as ones observed in the tests with the GOD-coated sensors. The similar response behavior of the sensors with and without the GOD coatings indicates that the different , observed after the sensor head was removed from different glucose solutions, was not due to the immobilized GOD but rather related to glucose and dependent on the glucose concentration. For example, when the sensor head was removed from a 1% glucose solution and placed in air, the observed ringdown time was clearly different from the observed ringdown time of the sensor head that was placed in air after removal of DI water. One possible explanation for this observed behavior is that when the sensor head was removed from a glucose solution, a very small amount of glucose solution remained on the surface of the sensor head to form a thin film. In the presence of atmospheric oxygen, this glucose film reacted with the atmospheric oxygen, changing the surface index of the sensor head. The change was even affected by the concentration of the glucose solution. The observed behavior in Fig. 5(a) was also repeated when the other FLRD glucose sensor, the second sensor without the GOD coatings, was tested with glucose solutions in much lower concentrations, 0.1–1% or . The results are shown in Fig. 5(b). Fig. 5Response behaviors of two EF-FLRD glucose sensors, which had no GOD coatings at the sensor heads. (a) Glucose concentration ranged from 1% to 10%; and (b) glucose concentration ranged from 0.1% to 1%.  Figures 6(a) and 6(b) show the curves of the measured EF attenuation versus glucose concentration. Similar to the results obtained with the sensors coated with GOD, non-linearity was shown in glucose concentrations ranging from 1% to 10% or from to . However, the experimental data shown in Fig. 6(b), in which the glucose concentration ranged from 0.1% to 1% gave a good linearity, . This result indicates that the FLRD glucose sensor has a linear response to the glucose concentration when the concentration is lower than 1%. This linear response to the low glucose concentration is consistent with the first order approximation of the expression given in Eq. (7b). Fig. 6The measured EF attenuation difference versus glucose concentration in glucose solutions. The dot denotes the experimental data and the line denotes the fittings. (a) The data was from Fig. 5(a); the sensor showed a non-linear relation between and in the glucose concentration range of 1% to 10%. (b) The data was from Fig. 5(b); the sensor showed a linear relation between and in the glucose concentration range of 0.1% to 1%.  Comparison of the results shown in Figs. 3 and 5 supports that FLRD glucose sensors, both with and without immobilized GOD on the surface of the sensor head, displayed similar performances in terms of reproducibility, response time, and the relationship between EF attenuation and glucose concentration. The sensors’ detection sensitivities will be discussed in Sec. 4.3. 4.2.Detections of Glucose in Synthetic Urine SamplesTwo additional FLRD glucose sensors were also fabricated for testing with synthetic urines. One of the sensors had a GOD coated sensor head and the other did not have a GOD-coated sensor head. In the experiments, the 10% standard glucose solution was added to the synthetic urine to form urine samples with different glucose concentrations ranging from 0.1% to 10%. The sensor with a GOD-coated sensor head was tested with glucose solutions in the concentration range of 0.1%–1%. The results of the sensor’s response are shown in Fig. 7. Clearly, similar response behavior was observed and the sensor could sense synthetic urine with a glucose concentration as low as 0.1%, . It should be noticed that the immobilization of GOD on this sensor head skipped the pre-treatment of 1% aldehyde groups, but it seemed that the GOD was effectively coated. Figure 8 shows the curve of the EF attenuation versus urine glucose concentration. The fitted result shows good linearity of the sensor’s response in the urine glucose concentration range of 0.1%–1%. This result further validated the first order approximation of Eq. (7b). Comparison of the results in Figs. 6 and 8 supports the notion that EF-FLRD glucose sensors with and without GOD coatings on the sensor head have a linear response to glucose concentration in the range of 0.1% to 1.0%. Fig. 7Response behavior of an EF-FLRD glucose sensor, which had GOD coatings at the sensor head. The sensor was tested with the synthetic urine samples in different glucose concentrations ranging from 0.1% to 1%. 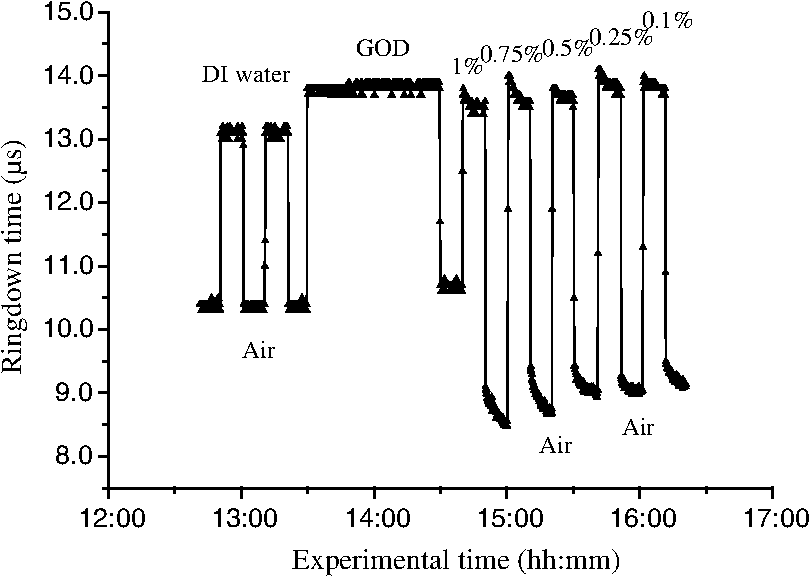 Fig. 8Linear response of an EF-FLRD glucose sensor to the synthetic urine samples in different glucose concentrations ranging from 0.1% to 1%. The dot denotes the experimental data and the line denotes a linear fitting. 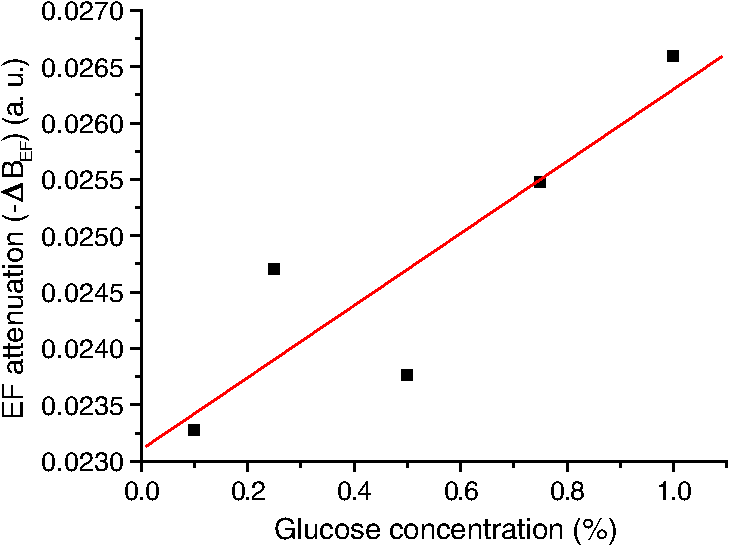 The other FLRD glucose sensor, which had no GOD coatings at the sensor head, was also tested with synthetic urine in urine-glucose concentrations of 1% to 10%. For each concentration, two tests were conducted and good reproducibility was obtained. The sensor demonstrated the behavior previously shown by other non-GOD- coated FLRD glucose sensors in glucose solutions, shown in Fig. 9. The results in Fig. 9 also yielded a nonlinear curve of the EF attenuation versus glucose concentration. That was similar to the curves shown in Figs. 4 and 6. This result further confirmed that the EF-FLRD glucose sensors gave a non-linear response for 1% to 10% glucose concentrations, as predicted by Eq. (7b). Fig. 9Response behavior of an EF-FLRD glucose sensor, which had no GOD coatings at the sensor head. The sensor was tested with the synthetic urine samples in different glucose concentrations ranging from 1% to 10%. 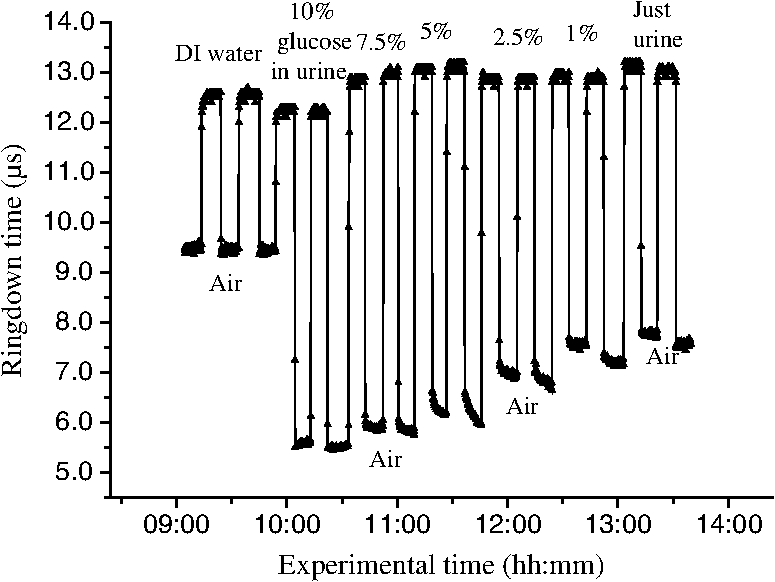 Comparison of the results shown in Figs. 7 and 9 suggests that FLRD glucose sensors both with and without the GOD coatings on the sensor head gave similar response behaviors when tested in synthetic urine samples in 0.1% to 10% glucose concentrations. Further comparison of the results obtained using the EF-FLRD glucoses sensors with and without GOD coatings suggests that for this particular type of index-based sensors, the GOD coatings on the sensor head were not crucial to their performance. 4.3.Detection Sensitivity of the EF-FLRD Glucose SensorsDetection sensitivity of the EF-FLRD glucose sensors was also investigated. Two additional EF-FLRD glucose sensors without GOD coatings at the sensor head were fabricated to investigate the best experimental detection sensitivity in glucose solutions and in artificial urines. These two sensor heads had an etched fiber length of 22.0 cm. As shown in Fig. 10, the sensor was first tested in DI water, which showed good reproducibility, before being switched between a 0.075% glucose solution and air. Reproducible ringdown signals were obtained and a difference between the sensor’s response to DI water-air and solution-air was noticeable. The result indicated that the detection sensitivity of this EF-FLRD sensor without GOD coatings was . The other EF-FLRD glucose sensor was tested in the synthetic urine with a glucose concentration of , and the results are shown in Fig. 11. The sensor gave reproducible results and had a fast response, as well as a detection sensitivity of . Fig. 10Detection sensitivity of an EF-FLRD glucose sensor in a glucose solution with a concentration of 0.075% or . 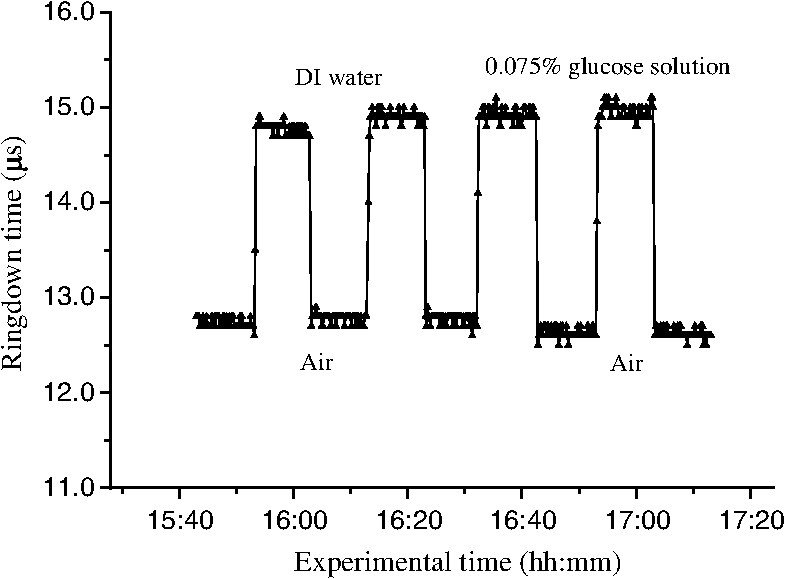 Current fiber optic glucose sensors using different sensing schemes and different sensing mechanisms, including a variety of GOD-based approaches, such as fluorescence,22 fluorescence quenching,23 sol-gel matrix,24 have achieved a wide range of experimental detection sensitivities, from to . The best experimental detection sensitivities of index-based fiber optic glucose sensors were in glucose solution samples and in serum based samples reported by Lin et al.15 Their sensor’s response time was less than 3 s. These experimental detection sensitivities can be potentially improved up to and in glucose solutions and serum based samples, respectively, if the minimum detectable phase difference is 0.02-deg. That corresponds to a minimum detectable refractive index unit of approximately , extrapolated from the reported data.15 A theoretical detection sensitivity of the refractive index-difference EF-FLRD glucose sensors can also be estimated. The detection sensitivity of the EF-FLRD sensors can be characterized by the minimum detectable EF attenuation. Rearranging Eq. (4), we have: where is the round trip time of the laser pulse in the fiber loop and is the number of round trips. Therefore, the minimum detectable optical loss , which is defined as the one- detection limit, is given by: where is the one- standard deviation of the ringdown time. can be experimentally achieved at , which is a typical level of the minimum detectable change in light intensity, , in a conventional intensity-based sensing scheme. For a 120 m long ringdown loop consisting of a standard telecommunications SMF-28e fiber with refractive indices of 1.4491 and 1.4441, respectively, for the fiber core and cladding at 1515.25 nm, the round trip time, , is 580 ns. If the measured ringdown time in the fiber loop is ,14 the number of multiple passes is 43. Thus, based on Eq. (9a), the minimum detectable change in the EF attenuation is: From Fig. 6(b), for example, we obtain a slope of the curve, (). Therefore, a detection sensitivity of glucose concentration based on the is determined by: The theoretical detection sensitivity is approximately 17-times lower than the blood glucose renal threshold, which is approximately .25 When the blood glucose exceeds this renal threshold value, the glucose becomes present in human urine. It must be noted that the glucose sensors studied in this work are based on sensing changes in the refractive index. At 20 °C, the refractive index of a glucose solution changes approximately 0.0000225 RIU for every 0.01% change in glucose concentration.26 When an index-based glucose sensor has a detection sensitivity that is better than 0.01% as estimated in Eq. (10), the temperature effect on the refractive index of glucose solutions or urine samples must be considered. The temperature coefficient of the refractive index of water at one atmospheric pressure in the temperature range of 10–30 °C in the near-infrared spectral region is approximately 0.000085 RIU/°C.27 This speculation suggests that a temperature control for glucose solutions or urine samples needs to be implemented when an index-based glucose sensor is employed to sense glucose concentrations lower than 0.01% or .4.4.DiscussionThere are numerous nonintrusive or minimal invasive optical techniques for glucose monitoring. These techniques include infrared absorption, near-infrared scattering, quantitative Raman spectroscopy, fluorescence, laser polarimetry, photonic crystal lens, pulsed photoacoustic spectroscopy, and optical coherent tomography. Although none of them have been clinically adopted for noninvasive glucose tests to replace blood glucose meters, many encouraging clinic testing results have been reported. Challenges in future development and technology advantages and limitations for each of the aforementioned techniques are comprehensively discussed in a recent update edited by Tuchin.28 The type of sensor or sensing technique that will be adopted for noninvasive glucose detection eventually depends on sensitivity, accuracy, costs, and user convenience. The terms of the high and low glucose concentrations, defined in Eq. (7b), refer to the glucose concentrations that are relevant to medical applications. The clinically relevant glucose concentration range is or 0–0.45%, which is covered in the lower concentration range, 0.1%–1%, studied in this work. The normal glucose level in human urine is . When the blood glucose level is higher than the renal threshold, , the corresponding glucose concentration in urine is approximately 19 times lower than the blood glucose concentration, depending on specific physiological and metabolic cases. Therefore, for potential medical applications of the sensors introduced in this work, the sensors’ performances in the higher concentration range of become less practical. As discussed in the previous section, the theoretical detection limit of the new glucose sensor is . This detection sensitivity satisfies the requirement of the sensitivity of a sensor to be useful for physiologically high urine glucose level screening. In addition to sensitivity, the accuracy of glucose sensors is a very critical parameter. Predominantly used for diabetic self-management, current blood glucose meters give a reading error of about 20–25%. Commercial urine glucose strips can only determine the qualitative level of glucose in urine via a displayed color, they have no quantitative accuracy in terms of an absolute blood glucose concentration. Accuracies of many other glucose monitoring techniques, methods, or sensors have not been clinically established because they are under development, testing, or commercialization processes. For example, the recent Raman spectroscopy-based glucose sensors tested in human forearm gave an error of 16.9% or in terms of the root mean square error of cross validation, RMSECV, in the glucose concentration range of .29 Optical coherent tomography is another promising technique that was recently tested in human skin and reported an error approaching 1%, corresponding to in terms of glucose concentration.30 An RMSECV of obtained in a recent human skin test using the NIR diffuse-reflectance spectroscopy was also reported.31 Details of other glucose sensors and sensing techniques accuracies can be seen elsewhere.28 The best accuracy of the FLRD glucose sensors described in this proof-of-the-concept study can be estimated. In Fig. 6, the linear fitting yielded the standard deviations of , the slope, and the intercept of the fitted line was a. u., , and a. u., respectively. These numbers determined a measurement accuracy of in the examined glucose concentration range of 0.1%–1% or . Reproducibility of the EF-FLRD glucose sensor can be viewed in two aspects. First, for a given EF-FLRD sensor, when it was tested in water, glucose solutions, or synthetic urine samples, the sensor read repeatable results. For instance, when the sensor was switched alternatively between air and water and between the 10% glucose solution and air in Fig. 5(a), the reproducibility was better than 99% in terms of ringdown time. This high reproducibility of a single EF-FLRD glucose sensor stems from the high ringdown baseline stability, , defined in Eq. (9a). Second, for different EF-FLRD sensors, when they were tested in the same medium of water, air, glucose solutions, and synthetic urine samples, they read different ringdown times. For example, different ringdown times, , different ringdown times, , were obtained in Figs. 3(a) and 3(b). These different data came from the physical differences of the different sensors. As shown in Eq. (3a), different fiber loops may have different fiber length and different splicing losses which yield a different , resulting in a different ringdown baseline . Similarly, after a series of lab-based fabrication processes including cutting, splicing, and etching, each sensor unit had a different sensing baseline, . Subsequently, each sensor had its own set data generated as shown in Figs. 3(a) and 3(b). Strictly speaking, this fabrication reproducibility may not be an issue with regard to the sensor’s performance reproducibility. The fabrication reproducibility in automated fiber fabrication industries can be readily up to 99%.32 In comparison, advantages of the FLRD glucose sensors include a high detection sensitivity, potentially reaching as discussed previously, near-real time response of , which is significantly faster than those of the Raman spectroscopy and Optical coherent tomography technique, a comparable to or better accuracy than those of the Raman spectroscopy, NIR, and OCT techniques. Another noteworthy point is that glucose sensors based on the Raman spectroscopy, near-infrared scattering, and optical coherent tomography techniques are suitable for point-of-care, POC, glucose self-measurements, yet they are not logistically and economically competitive for a large-scale glucose screening. For instance, the EF-FLRD glucose sensor proposed in this work, due to its advantageous features of low-cost, network capability,2 and near-real time measurement, can potentially be deployed in toilets in public facilities for rapid and convenient urine glucose screening where numerous sensors can be effectively powered by a single laser diode. An apparent advantage of the EF-FLRD glucose sensor over the urine strips for potential urine glucose monitoring is that the FLRD urine glucose sensors do not generate secondary test wastes that could even carry residual body fluids. Additionally, EF-FLRD glucose sensors are reusable and cost per measurement is significantly lower than that of the urine glucose strips. Certainly, there are some challenges to meet before the EF-FLRD glucose sensor is implemented for the aforementioned application. In the FLRD-based glucose sensing, the sensor head directly interacts with urine, so the sensor head will have to be chemically modified after a long-time use and minor baseline drifting may occur before the sensor head is replaced by a new one. Another issue for urine glucose monitoring in general is that the glucose levels in urine do not instantaneously reflect the blood glucose level. A time lag of 2 to 3 h is typical. These issues remain for future studies, which may involve research efforts in a broader biomedical engineering community. 5.ConclusionWe have investigated the proof-of-the-concept of fiber loop ringdown glucose sensors using the refractive index-difference EF attenuation as a sensing mechanism. Several EF-FLRD glucose sensors were fabricated with and without the immobilization of GOD on the partially-etched bare single mode fiber. Responses of the sensors to glucose solutions and synthetic urines in different glucose concentrations ranging from 0.05% to 10%, or , were investigated. The sensors gave data that showed linear responses to glucose concentrations in the lower concentration range, 0.1%–1.0%, but non-linear responses for glucose concentrations in the higher range, 1.0%–10%. The EF-FLRD glucose sensors demonstrated both good reproducibility and fast responses. The sampling rate of the sensors was 10 Hz, which can be up to 100 Hz when the laser pulse repetition rate is set to 100 Hz. Cross comparisons of the results obtained for the sensors with and without GOD coatings in glucose solutions and artificial urine samples indicate that the GOD coatings are not crucial to the performance of this type of index-based glucose sensor. The demonstrated detection sensitivities of the sensors in glucose solutions and artificial urines were and , respectively. Potential detection sensitivity of such sensors can reach up to 0.01% or . The theoretical consideration suggests that higher sensitivity, better than , detection of glucose using index-based optical sensors, including the EF-FLRD glucose sensors, is affected by the temperature effect on the refractive index of samples. This work has demonstrated a proof-of-the-concept, simple, low cost, and fast-response EF-FLRD glucose sensor, which may be potentially utilized for applications in near-real time glucose monitoring. AcknowledgmentsThis work is supported by the National Science Foundation through the Grant CMMI-0927539. ReferencesH. Waechteret al.,
“Chemical sensing using fiber cavity ring-down spectroscopy,”
Sensors, 10
(3), 1716
–1742
(2010). http://dx.doi.org/10.3390/s100301716 SNSRES 0746-9462 Google Scholar
C. Wang,
“Fiber loop ringdown–a time-domain sensing technique for multi-function fiber optic sensor platforms: current status and design perspectives,”
Sensors, 9
(10), 7595
–7621
(2009). http://dx.doi.org/10.3390/s91007595 SNSRES 0746-9462 Google Scholar
G. Stewartet al.,
“An investigation of an optical fibre amplifier loop for intra-cavity and ring-down cavity loss measurements,”
Meas. Sci. Technol., 12
(7), 843
–849
(2001). http://dx.doi.org/10.1088/0957-0233/12/7/316 MSTCEP 0957-0233 Google Scholar
Z. Tonget al.,
“Fiber-loop ring-down spectroscopy: a sensitive absorption technique for small liquid samples,”
Rev. Sci. Instrum., 74
(11), 4818
–4826
(2003). http://dx.doi.org/10.1063/1.1614877 RSINAK 0034-6748 Google Scholar
P. B. TarsaP. RabinowitzK. K. Lehman,
“Evanescent field absorption in a passive optical fiber resonator using continuous-wave cavity ring-down spectroscopy,”
Chem. Phys. Lett., 383
(3–4), 297
–303
(2004). http://dx.doi.org/10.1016/j.cplett.2003.11.043 CHPLBC 0009-2614 Google Scholar
J. A. Barneset al.,
“Chemical sensor based on a long period fibre grating modified by a functionalized polymethylsiloxane coating,”
Analyst, 133
(11), 1541
–1549
(2008). ANLYAG 0365-4885 Google Scholar
P. B. Tarsaet al.,
“Single-cell detection by cavity ring-down spectroscopy,”
Appl. Phys. Lett., 85
(19), 4523
–4525
(2004). http://dx.doi.org/10.1063/1.1819520 APPLAB 0003-6951 Google Scholar
C. WangS. T. Scherrer,
“Fiber ringdown pressure sensors,”
Opt. Lett., 29
(4), 352
–354
(2004). http://dx.doi.org/10.1364/OL.29.000352 OPLEDP 0146-9592 Google Scholar
C. WangA. Mbi,
“An alternative method to develop fiber grating temperature sensor using the fiber loop ringdown scheme,”
Meas. Sci. Technol., 17
(7), 1741
–1751
(2006). http://dx.doi.org/10.1088/0957-0233/17/7/012 MSTCEP 0957-0233 Google Scholar
N. Niet al.,
“Fiber cavity ring-down refractive index sensor,”
IEEE Photo. Technol. Lett., 20
(16), 1351
–1353
(2008). http://dx.doi.org/10.1109/LPT.2008.926866 IPTLEL 1041-1135 Google Scholar
T. von LerberM. W. Sigrist,
“Cavity ring-down principle for fiber-optic resonators: experimental realization of bending loss and evanescent-field sensing,”
Appl. Opt., 41
(18), 3567
–3575
(2002). http://dx.doi.org/10.1364/AO.41.003567 APOPAI 0003-6935 Google Scholar
J. B. Jensenet al.,
“Photonic crystal fiber based evanescent-wave sensor for detection of biomolecules in aqueous solutions,”
Opt. Lett., 29
(17), 1974
–1976
(2004). http://dx.doi.org/10.1364/OL.29.001974 OPLEDP 0146-9592 Google Scholar
M. Jianget al.,
“Investigation on an evanescent wave fiber-optic absorption sensor based on fiber loop cavity ring-down spectroscopy,”
Opt. Commun., 283
(2), 249
–253
(2010). http://dx.doi.org/10.1016/j.optcom.2009.07.015 OPCOB8 0030-4018 Google Scholar
C. Herathet al.,
“Fiber loop ringdown DNA and bacteria sensors,”
J. Biomed. Opt., 16
(5), 050501/1
–3
(2011). http://dx.doi.org/10.1117/1.3572046 JBOPFO 1083-3668 Google Scholar
T. Q. LinY. L. LuC. C. Hsu,
“Fabrication of glucose fiber sensor based on immobilized GOD technique for rapid measurement,”
Opt. Express, 18
(26), 27560
–27566
(2010). http://dx.doi.org/10.1364/OE.18.027560 OPEXFF 1094-4087 Google Scholar
K. V. Larinet al.,
“Noninvasive blood glucose monitoring with optical coherence tomography: a pilot study in human subjects,”
Diabetes Care, 25
(12), 2263
–2267
(2002). http://dx.doi.org/10.2337/diacare.25.12.2263 DICAD2 0149-5992 Google Scholar
A. W. SynderJ. D. Love, Optical Waveguide Theory, Kluwer Academic Publishers, Norwell, MA
(2000). Google Scholar
P. Polynkinet al.,
“Evanescent field-based optical fiber sensing device for measuring the refractive index of liquids in microfluidic channels,”
Opt. Lett., 30
(11), 1273
–1275
(2005). http://dx.doi.org/10.1364/OL.30.001273 OPLEDP 0146-9592 Google Scholar
C. WangC. Herath,
“High-sensitivity fiber-loop ringdown evanescent-field index sensors using single-mode fiber,”
Opt. Lett., 35
(10), 1629
–1631
(2010). http://dx.doi.org/10.1364/OL.35.001629 OPLEDP 0146-9592 Google Scholar
M. I. WhiteX. Fan,
“On the performance quantification of resonant refractive index sensors,”
Opt. Express, 16
(2), 1020
–1028
(2008). http://dx.doi.org/10.1364/OE.16.001020 OPEXFF 1094-4087 Google Scholar
S. Binuet al.,
“Fiber optic glucose sensor,”
Mater. Sci. Eng. C, 29
(1), 183
–186
(2009). http://dx.doi.org/10.1016/j.msec.2008.06.007 MSCEEE 0928-4931 Google Scholar
D. Jianget al.,
“Design and properties study of fiber optic glucose biosensor,”
Chin. Opt. Lett., 1
(2), 108
–110
(2003). 1671-7694 Google Scholar
A. B. GaneshT. K. Radhakrishnan,
“Employment of fluorescence quenching for the determination of oxygen and glucose,”
Sensors & Transducers, 60
(10), 439
–445
(2005). Google Scholar
M. Portaccioet al.,
“Fiber-optic glucose biosensor based on glucose oxidase immobilized in a silica gel matrix,”
Sol-Gel Sci. Technol., 50
(3), 437
–448
(2009). http://dx.doi.org/10.1007/s10971-009-1915-4 JSGTEC 0928-0707 Google Scholar
R. D. Lawrence,
“Renal threshold for glucose: normal and in diabetics,”
Br. Med. J., 1
(4140), 766
–768
(1940). BMJOAE 0007-1447 Google Scholar
“Relationship between salt solution and sugar concentration (brix) and reflective index at 20 °C,”
www.topac.com Google Scholar
K. KadoyaN. MatsunagaA. Nagashima,
“Viscosity and thermal conductivity of dry air in the gaseous phase,”
J. Phys. Chem. Ref. Data, 14 947
–970
(1985). http://dx.doi.org/10.1063/1.555744 JPCRBU 0047-2689 Google Scholar
V. V. Tuchin, Handbook of Optical Sensing of Glucose in Biological Fluids and Tissues, CRC Press, Taylor & Francis Group, London
(2009). Google Scholar
A. M. K. Enejderet al.,
“Raman spectroscopy for noninvasive glucose measurements,”
J. Biomed. Opt., 10
(3), 031114
(2005). http://dx.doi.org/10.1117/1.1920212 JBOPFO 1083-3668 Google Scholar
R. O. Esenalievet al.,
“Noninvasive monitoring of glucose concentration with optical coherence tomography,”
Opt. Lett., 26
(13), 992
–994
(2001). http://dx.doi.org/10.1364/OL.26.000992 OPLEDP 0146-9592 Google Scholar
Y. P. Duet al.,
“Removal of interference signals due to water from in vivo near-infrared (NIR) spectra of blood glucose by region orthogonal signal correction (ROSC),”
Anal. Sci., 20
(9), 1339
–1345
(2004). http://dx.doi.org/10.2116/analsci.20.1339 ANSCEN 0910-6340 Google Scholar
|


