
|
|
1.IntroductionPhotoplethysmography (PPG), as first described in the 1930s,1 is a simple, low-cost, and non-invasive optical technique used to measure the blood volume changes that occur in man and other animals due to the pulsatile nature of the circulatory system.2 Since its development decades ago, its ability to monitor vital physiological parameters in real-time, e.g., heart/respiration rates, blood oxygen saturation, has gained significant attention in the biomedical and clinical community and, in the case of pulse oximetry, made PPG the standard of monitoring blood oxygen saturation. However, the need to apply a PPG sensor directly to the skin constrains its practicability in situations such as the evaluation of skin healing, or when free movement is required. Recent studies have investigated the effect of contact force on the amplitude and timing of the PPG signal using spring-loaded conventional PPG probes3,4 and have shown that this force must be carefully controlled to obtain high-quality clinical data from the signals. One potential way to overcome these problems is to use the recently introduced technique of imaging PPG. This is a noncontact method that can detect the heart-generated pulse wave and can be used, for instance, to assess peripheral blood perfusion.5–12 Compared to conventional contact PPG, remote-sensing imaging has the advantage of offering detailed spatial information simultaneously from multiple sites of arbitrary size and location, thus allowing the derivation and mapping of physiological parameters and ultimately facilitating insights that would otherwise be difficult or even impossible to obtain from single point contact measurements. Moreover, as a noncontact technique, imaging PPG avoids the deformation of the arterial wall, typically caused by the compression of the spring-loaded clips in contact PPG finger probes or varying contact force in handheld probes, thereby providing more reliable signals for clinical applications. With significant achievements and improvements in imaging hardware and software, the past decade has witnessed a rapid growth in the literature pertaining to imaging PPG techniques. The use of an imaging sensor in a PPG system provides additional functionality with respect to a single diffuse sensor, particularly motion compensation and region of interest selection, both of which enable a robust and flexible noncontact PPG system. For instance, Wieringa and colleagues have introduced a complementary metal oxide semiconductor (CMOS) camera-based multiple wavelength imaging PPG device that provides a potential route toward contactless assessment of blood oxygen saturation,8 and Poh et al. have reported a webcam-based technique for remote acquisition of PPG signals that uses ambient light as a source of illumination.6 These examples indicate two research directions within imaging PPG: high-definition camera-based imaging PPG (iPPG) and webcam-based imaging PPG (wPPG). The first of these two examples, which typically comprises a high sample rate and is coupled with a custom light source, has proven to be superior in sensitivity and the ability to assess multiple physiological parameters, while the second, which normally uses ambient light as the illumination source, shows its advantage in terms of simplicity and low cost but lacks the ability to extract several clinically important parameters, including blood oxygen saturation. However successful it has been in acquiring physiological parameters, e.g., heart/respiration rate, a number of key questions still remain for the wPPG technique. Particularly, we have to address the practical issue of how variations in ambient light intensity could influence the performance of the system during physiological assessment. Moreover, compared to the accumulated literature regarding imaging PPG,5–12 there are few studies that compare these two techniques and appraise their performance within the same experiment. In our previous work,5,11 a high-resolution CMOS camera-based imaging PPG system has been introduced, and its practicability and reliability in terms of remote assessment of the cardiovascular system has been shown. Therefore, in the present study, the remote imaging PPG systems, including a high-speed CMOS color camera, a webcam, an optical spectrometer, and a contact PPG (cPPG) sensor, have been set up to compare the reliability and sensitivity of ambient light-based imaging PPG measurements in accessing the cardiovascular system. Measurements were taken from subjects undergoing various intensities of exercise in order to make these comparative assessments under different physiological conditions. 2.Methods and Materials2.1.SubjectsTen healthy male subjects recruited from Loughborough University were enrolled in this study, as summarized in Table 1. None of them had any known cardiovascular disease, and none were diabetic. The investigation conformed to the principles outlined in the Declaration of Helsinki (1989) of the World Medical Association and was approved by the local Ethical Committee. The nature of the research was explained to the subjects prior to the recordings, and informed consent was obtained. The subjects were asked to refrain from consuming caffeine or alcohol and not to smoke or undertake strenuous exercise for the two hours leading to the study. Table 1Subject characteristics and weather conditions.
2.2.Instrument SetupA schematic diagram of the validation platform is shown in Fig. 1. The subjects and all equipment were positioned in a room with no artificial light present. The high-speed color CMOS camera (Model: MC1311, Mikrotron GmbH, Unterschleissheim, Germany) with maximum resolution of was focused on the face of the participants using a standard C-mount lens (Model: M0814-MP Megapixel Lens 8 mm f1.4, Computar, New York). The distance between the camera and face was approximately 350 mm. A color video was also recorded from the face via a webcam (Model: Webcam Pro 9000, Logitech, Fremont, California) with embedded Carl Zeiss® optics lens. Because of the different camera focal length, the webcam was fixed about 200 mm in front of the face [Fig. 2(a)]. In all experiments, a commercial pulse oximetry contact sensor (Model: P871RA, Viamed, Keighley, United Kingdom) was placed on the index finger of the left hand to measure the participant’s pulse signal as a reference. The analog signals from the contact sensor were digitized using a DISCO4 (Dialog Devices, Loughborough, United Kingdom) data acquisition system incorporating a 12-bit A/D converter running at a sample rate of 128 Hz. To assess the influence of ambient light intensity, an optical spectrometer (Model: USB4000, Ocean Optics, Dunedin, Florida) was used. The recorded wavelength range was between 525 and 750 nm for consideration of the red and green parts of the visible spectrum, as they reportedly contain stronger plethysmographic signals than shorter wavelengths.7 The upper frequency limit was determined by the infrared cutoff filters in the webcam. The images captured from the CMOS camera were synchronized to the signals acquired from the contact sensor, spectrometer, and webcam via an additional signal from the camera. Specifically, when initiating the iPPG capture, a trigger signal was sent to initialize the recording of the spectrometer and cPPG subsystem, and a red light-emitting diode (LED) () placed within the field of view of the webcam was simultaneously turned on for synchronization of the wPPG sub-system [Fig. 2(d)]. Fig. 1Experimental setup. Two separate PCs were used to avoid potential losses when streaming data from multiple recording devices to a single hard drive.  Fig. 2A representative figure showing an example frame of a recording from (a) the CMOS camera (frame 49, ), (b) the decomposed RGB channels, and (c) the corresponding PPG (iPPG) signals. A similar approach has been adopted for exhibiting the results of the webcam (frame 29, ), panels d to f. The signal is from Sub #1 (male, age 27 years) obtained under resting conditions. The area of the image from which the PPG signal was obtained (iPPG and wPPG) is highlighted with a white box in the first frame of each recording [(a) & (d)]. A white arrow and a white dashed box show the back of the webcam in (a). The white arrow indicates the synchronization LED in (d). The axes of the frames show the pixel numbers, where in (a) and (d) the images contain four interlaced Bayer channels, and a single Bayer channel is shown in (b) and (e). 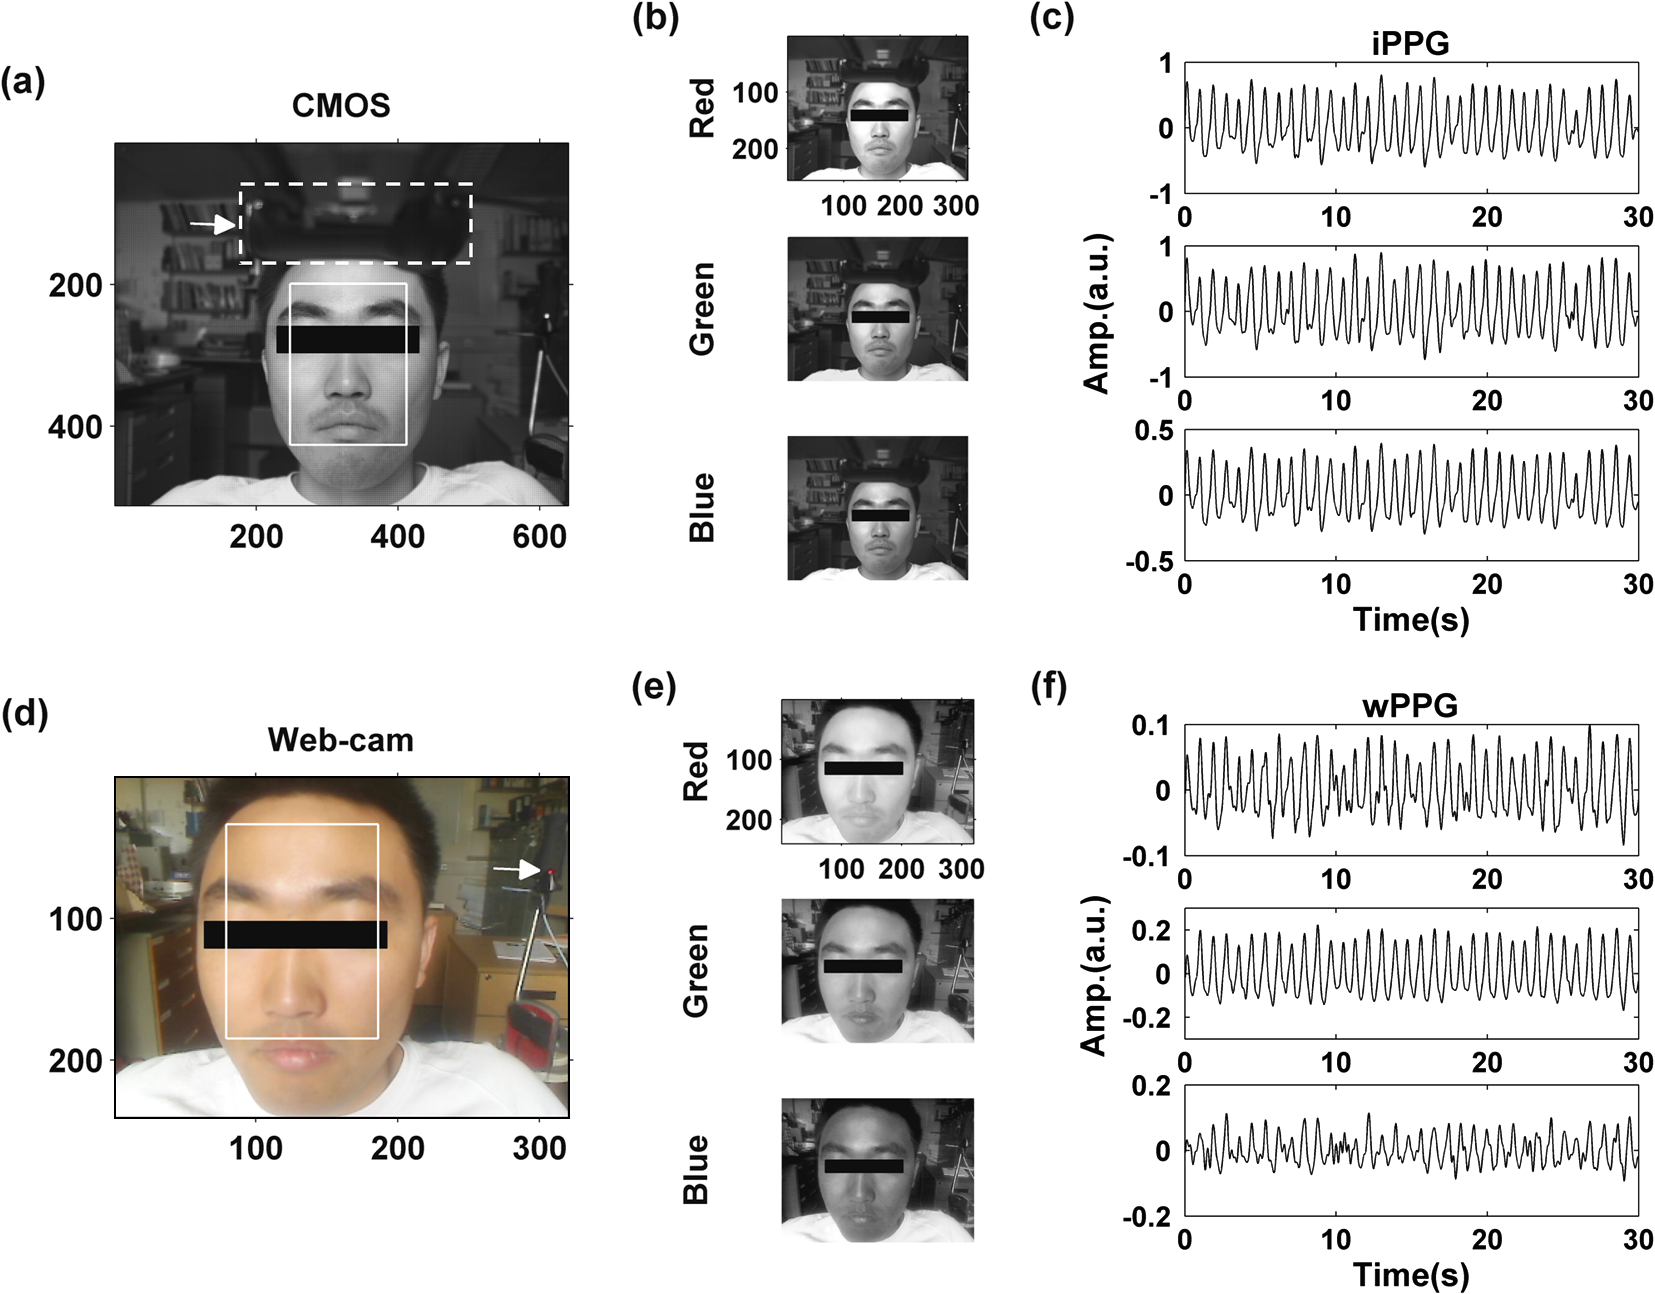 2.3.Experimental ProtocolA similar experimental protocol has been reported in more detail in our previous studies.5,11 Briefly, before commencing each experiment, the subject’s gender, age, height, weight, and body mass index, as well as the outside cloud cover and room temperature, were noted at the time of measurement. The participants were then required to sit on a stable chair and rest for at least 10 min, at which time blood pressure was measured in the right arm with a digital blood pressure monitor (Model: M6, Omron, Kyoto, Japan). The cPPG signal acquisition and ambient light intensity monitoring were then initialized to wait for the trigger signal from the CMOS camera. This was set to record with an image size of (raw image prior to Bayer filtering) at a frame rate of 50 Hz, for 30 s. On receiving the trigger signal from the CMOS camera, the webcam video, the cPPG signal, and the ambient light intensity spectrometer signal were captured for 180 s. The spectrometer was set at a fixed sample rate of 10 Hz, and video capture from the webcam was configured via custom-written software in MATLAB (MathWorks, Natick, Massachusetts), to give an image size of and a frame rate of 30 Hz. Additional measurements of 180-s duration were taken after two 10-min periods of exercise on a fixed bicycle (Model: XR-580, PowerTrek, United Kingdom), in order to assess the ability of the platform in obtaining the physiological parameters under various conditions, and to investigate the influence of different exercise levels on the cardiovascular system. The first exercise period was performed at a rate of (exercise 1), and the second at (exercise 2). Following the second exercise period, a final 180-s recording was made after an additional 10-min rest period (Fig. 3). Thus four sections of data were recorded from each of the 10 subjects. 2.4.Image ProcessingIn a previous study, we proposed a motion compensation technique for extraction of physiological parameters from measurements taken under conditions of motion due to exercise.5 In the present study, dual-channel images were recorded under postexercise conditions, where a simple yet efficient averaging approach7 was adopted and found adequate to attenuate these relatively small motion artifacts. After a set of recordings was acquired, a Bayer function was applied to extract the three channel images (red, green, and blue, per channel) from the CMOS camera. A manual procedure was then conducted to detect the face within the frames obtained from this camera and the webcam and to localize the measurement region of interest (ROI) [Figs. 2(a) and 2(d)]. This manual ROI determination approach was repeated for all subjects. The raw imaging PPG signals ( and components) were then derived from the average value of the pixels within the ROI. A fifth-order Butterworth bandpass filter with cutoff frequencies set at 0.5 and 4 Hz was employed to accommodate a wide range of heart rate measurements. The three PPG signals, from iPPG (CMOS camera), wPPG (webcam), and cPPG (contact PPG sensor), were then saved for postprocessing. 2.5.Signal AnalysisThe Fourier transform (FT) has been widely utilized in conventional PPG signal processing, because of its simplicity and ability to provide fundamental physiological information easily and directly.8,13 However successful, uncritical FT use may lead to ambiguous results, since it assumes that signals are steady-state when, in reality, physiological signals are often transient in nature. Recent imaging PPG studies have increasingly revealed that a combination of both time and frequency domain information can provide more reliable physiological assessments,5,7,9 especially under conditions of exercise or recovery from exercise, when the normal homeostatic control mechanisms are temporarily overridden. Therefore, a joint time-frequency analysis [i.e., time frequency representation (TFR)] has been performed in this study to analyze the time varying aspects of the signal’s frequency components following exercise. Based on our experience of iPPG signal processing,5 a smoothed pseudo-Wigner-Ville distribution (SPWVD) (for a review of this technique, see Refs. 14 and 15) was chosen for estimation of the TFR for the observed PPG signals: where and are the signal and its complex conjugate, respectively, and and are two smoothing windows whose effective lengths independently determine the time and frequency smoothing spread. A Kaiser-Bessel function was adopted in the present study for both the time and frequency smoothing windows. In this work, the TFR of the PPG signals were obtained with custom-written software in MATLAB 2008a (MathWorks, Natick, Massachusetts).2.6.Statistical AnalysisDifferences between the heart rate and blood pressure measurements obtained from the digital blood pressure meter under different conditions were assessed with one-way analysis of variance (ANOVA, ) to show the influence of exercise on blood pressure. The group differences were assessed by post hoc analysis using Fisher’s least significant difference (LSD), where the groups represent the stages of recording, i.e., rest, Ex1, Ex2, and recovery. Two-way ANOVA () was performed to assess differences between the two imaging PPG systems and cPPG under the testing conditions. To further test the performance of both imaging PPG systems, Bland-Altman16 and Pearson’s correlation analyses were performed to compare iPPG with cPPG and wPPG with cPPG. In addition, the Pearson’s correlation coefficients and the corresponding -values were calculated to estimate the relationship between the imaging PPG signals (wPPG) and the ambient light intensity for short-term recordings (). All analyses were performed with (Type I error) set at 0.05 using the statistical software program SPSS for Windows, version 17.0 (IBM, Armonk, New York). 3.Results3.1.Physiological MeasurementsIn the present study, a total of four sets of measurements were taken from each participant (Fig. 3). Table 2 summarizes the results of the measured variables: heart rate (HR), systolic blood pressure (SBP), and diastolic blood pressure (DBP). To statistically analyze the influence of exercise on the cardiovascular system, separate ANOVAs with post hoc tests were conducted on the obtained variables, as explained in the methods section. Significant effects of exercise were seen on HR and SBP (, ; , ). Additionally, post hoc tests revealed that the HR and SBP after both exercise periods were significantly higher than those during the initial resting condition (ex1 versus rest, , ex2 versus rest, ). A significant difference between exercise levels was also detected in HR and SBP, while all variables returned to resting levels after the final 10-min resting period, i.e., no statistical differences were uncovered between recovery and initial resting conditions. Under all conditions, the DBP did not change significantly. Table 2Effects of exercise on blood pressure and heart rate (values are mean±S.D.). 3.2.Heart Rate Measurement by Imaging PPGFigure 2 is an example image obtained from Fig. 2(a) CMOS camera and Fig. 2(d) webcam from a single subject (Sub #1, ) under resting condition. Additionally, three images are presented of the red, green, and blue channels for both cameras [Figs. 2(b) and 2(e)]. Separate plethysmographic waveforms obtained from each of these three channels are shown for Fig. 2(c) the CMOS camera and Fig. 2(f) the webcam. Physiological pulsations are more apparent in the green channel from the webcam, while the CMOS camera shows comparable PPG signals for all three channels. It has been reported that the green component of the plethysmographic signal is stronger than that of the red and blue channels.6,7 Therefore, in what follows, only the green channel PPG signals were further processed for HR detection. To further characterize the cardiac pulse, TFR traces (Fig. 4) derived from the plethysmographic waveforms from each type of measurement (Fig. 4) were used to obtain values of and . These values were calculated by averaging the traces for HR from each 30-s period where recordings were taken from both imaging devices simultaneously. The HR values showed close agreement between three measurements and were consistent with the physiological results obtained from the digital blood pressure meter. Two-way ANOVA was then applied to the HR values derived from the TFR in order to compare the performance of these two techniques and the (gold standard) contact measurements. ANOVA performed on the parameter HR shows significant difference for the exercise state factor (, ), while the measurement system and factors had no significant association with HR (, ; , ). Post hoc tests performed on the exercise state reveal a positive trend during increasing exercise and a negative trend toward recovery, as mentioned above in the physiological measurement section (Rest versus Ex1: ; Rest versus Ex2: ; Ex1 versus Ex2: ; and Rest versus Recovery: ), while there were no significant associations of HR with the measurement system factor (i.e., HR values did not depend on which measurement method was used). Fig. 4A representative figure showing (a) contact, CMOS camera (green channel), and webcam PPG (green channel) signals from Fig. 2 and (b) the corresponding TFR results with color bar indicating the absolute power intensity. The and signals show a high correspondence.  To further evaluate the performance of both imaging PPG systems, Bland-Altman analysis was employed to assess the agreement of HR between each imaging method and contact readings. The results are shown in Fig. 5. In no case did the mean difference between the two methods differ significantly from zero. Specifically, the mean bias between cPPG and iPPG was with 95% limits of agreement to in the resting state, while the mean biases for Ex1, Ex2, and recovery states are 0.27, 0.63, and 0.47 bpm, respectively. The corresponding 95% limits of agreement are from to 2.26 bpm, to 3.49 bpm, and to 4.3 bpm. Furthermore, there was a significant correlation of HR obtained from cPPG and iPPG under all resting and exercise conditions (, ) (Plots not shown). The heart rates obtained from the webcam showed a similar pattern. The mean bias between cPPG and wPPG for the four conditions were , , 0.55, and 0.16 bpm with the corresponding 95% confidence intervals: to 4.12, to 1.73, to 3.93, and to 3.73 bpm. Significant correlations between cPPG and wPPG were also found (, for all states). Fig. 5Bland-Altman plots showing (a) the average of the HR measured by the cPPG and iPPG and (b) the average of HR measured by the cPPG and wPPG, plotted against the difference between them for each subject at rest, post-ex1, post-ex2, and after the recovery period. In all cases, the mean difference did not differ significantly from zero. Neither was there a significant association between the mean of the two measurements and their difference. 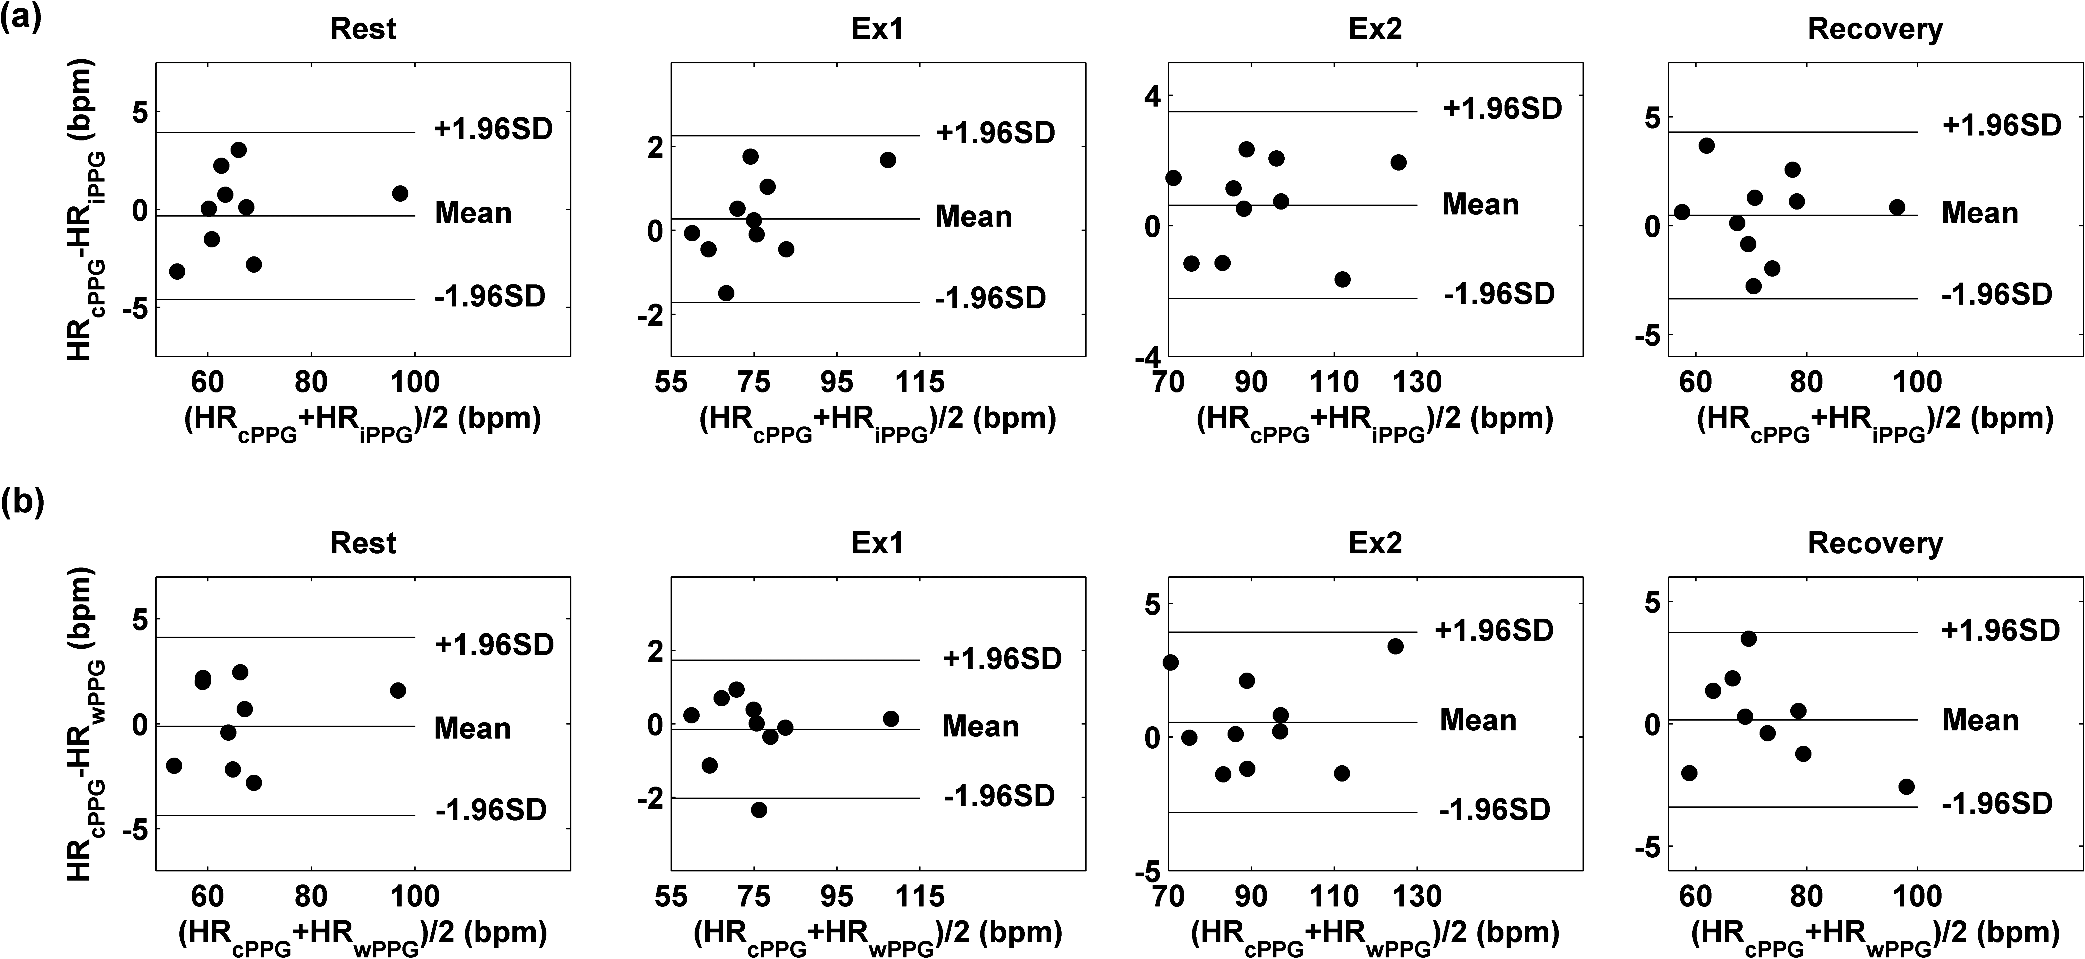 4.The Influence of Ambient Light IntensityFigure 6 shows the overall spectral characteristics of the ambient light encountered for all spectrometer measurements in this study, where six out of the 40 recorded segments of data were discarded due to partial saturation of the spectrometer. The highest intensities were seen in the red part of the spectrum. Figure 7 shows an example of a 120-s recording of the wPPG signal together with the average light intensity for Fig. 7(a) green (525 to 575 nm) and Fig. 7(b) red channels (620 to 750 nm). It can be seen that the ambient light intensity changed markedly even within the recording period. As expected, the mean level of the raw PPG signals from both channels (red and green) varied in concert with the ambient light intensity. Although the light intensity of the red channel was higher than that of the green channel, a more pronounced plethysmographic waveform was seen in the green channel [Fig. 7(a)]. To further analyze the relationship between the wPPG signals and ambient light intensity, the correlation coefficients between the ambient light intensity and the & components of the raw wPPG signals were calculated. Moreover, to eliminate the influence of the exercise dependent amplitude change, the analysis was conducted only under resting conditions. Here, the components of the wPPG signals were accessed via low pass filtering (), while the components were calculated via derivation of peak-to-peak amplitudes from the envelope of the PPG signals based upon the bandpass filter in the range of 0.5 to 4 Hz and normalized with respect to the corresponding components. The correlation analysis reveals different dependence of and components on the ambient light intensity. Specifically, significant positive correlations between the components and ambient light intensity have been identified in all subjects in both the red (, ) and green (, ) channels, whereas these correlations were absent in the normalized components of both channels (red and green). Fig. 6Box-and-whisker plot showing the overall spectral characteristics of ambient light across all spectrometer measurements in this study. Horizontal lines represent median value, and boxes encompass the two middle quartiles of the range. An even dispersion and positive skewness are consistent across the captured wavelength range.  Fig. 7A representative example of the influence of ambient light intensity on the obtained wPPG signals for (a) the green channel and (b) the red channel. The boxes show data at a magnified time scale (80 to 100 s), from which a more pronounced plethysmographic waveform is shown in the green channels, although the light intensity of the red channel is markedly higher than that of the green. The recordings are from subject #9 (male, ) under resting conditions.  5.Time-Varying HRThe relationships between HR and time under resting and exercise conditions are shown in Fig. 8. Following various conditions, the characteristics and trend of the HR are dynamic and consistent with the physiological results obtained from the digital blood pressure meter. Specifically, when compared to the resting condition (), the HR increases in both Ex1 and Ex2 states. The HR peaks at immediately after the Ex1 condition and returns to the resting value within 40 s. The higher-intensity exercise (Ex2) resulted in a higher HR and a pronounced recuperation, e.g., the HR reaches after the subject finished the exercise and decreases markedly to over the subsequent 100 s, after which it is maintained for the remaining 80 s of the monitoring period. Ten minutes after Ex2, the subject appeared to have fully recuperated, as HR had returned to its resting level (not shown). The results of the other subjects followed a similar pattern to those of subject #1, the exemplar. Fig. 8(a) Extracted webcam pulsatile signals (green channel) for resting conditions and the two levels of exercise and (b) the corresponding TFR results with color bar indicating the absolute power intensity. The return of HR toward resting levels is clearly visible following the second period of exercise (Ex2). The HR peaks at after the subject finished high-intensity physical exercise and decreases clearly to during the next 100 s, after which the HR remains steady for the rest of the monitoring period. Following the medium-intensity exercise (Ex1), a similar yet weaker recovery pattern is also seen, in that the HR decreased from to the resting rate of 1.2 Hz within 40 s. These representative signals are from subject #1 (male, ).  6.DiscussionThis study compares the quality of the physiological information that is available from a high-performance CMOS camera and a low-cost webcam using ambient light, where the influence of the ambient light intensity on the obtained plethysmographic signals has also been investigated. The webcam and high-performance camera-derived plethysmographic signals have been evaluated by comparing them to those from a commercial pulse oximeter sensor. The agreement between the results from these three methods (CMOS, webcam, and contact) indicates that both imaging PPG systems can successfully measure important physiological variables, i.e., heart rate. The influence of ambient light intensity on the raw PPG signals has revealed a significant positive correlation between the light intensity and the components obtained from iPPG, while such a correlation is absent for the components. This suggests that, under variable external weather conditions, information contained in the component of the PPG signal, such as heart rate, is not corrupted by changes in ambient light intensity. Since its conception decades ago, various imaging PPG systems have been proposed and validated for remote physiological assessments. Based upon their imaging devices, these systems can be divided into two categories: high-resolution camera-based or low-cost webcam-based. In the present imaging PPG setup, both systems have been tested and validated for noncontact physiological assessments (e.g., HR) under various exercise conditions in order to evaluate their feasibility and, more importantly, to compare their sensitivity. The PPG signals derived from both cameras have been compared with the recordings of a cPPG sensor. No statistical differences between the different monitoring techniques were found. Bland-Altman analysis showed that the heart rates derived from both imaging systems were comparable to the values obtained with the commercial contact sensor, the maximum HR difference being for both cameras under resting and exercise conditions. All three techniques revealed the expected association between exercise and increased heart rate, which echoes the changes in blood pressure and agrees well with previous studies.5,17,18 Thus in all respects, the results from both cameras were comparable to those of the reference contact probe. From the clinical point of view, the word “comparable” means that measurements by different instruments/techniques should be sufficiently close so as not to change the actions and decisions regarding the patient.10 For instance, in the Emergency Severity Index triage, an adult patient with a heart rate over 100 bpm is considered to be tachycardic.19 In this scenario, a difference of <5 bpm (<5% error) obtained from both imaging PPG systems could be acceptable, especially given that the measurements can be performed remotely using ambient light and without the need for specialized illuminators. Due to the historical emphasis of PPG on pulse oximetry and the need to sample relatively deep microvascular tissue beds, the pioneering imaging PPG systems were always coupled with dedicated light sources, typically in the red to near-infrared wavelength range.8–10 Recently, a substantial body of work has accumulated regarding the applicability of ambient light in remote plethysmographic imaging,6,7 and its effectiveness in the context of physiological assessments has been shown. For instance, Verkruysse et al. have demonstrated that heart and respiration rates may be remotely obtained using a simple digital camera and ambient light,7 and Poh et al. have reported a methodology combining of automatic facial recognition and blind source separation for reliable cardiac pulse measurement using a webcam.6 Though these devices have successfully obtained useful physiological information, the relationship between the ambient light intensity and the obtained plethysmographic signals is far from well understood. In the present study, continuous measurements of ambient light intensity have been synchronized with the recorded images, providing essential information for investigating such a relationship. The spectrometric data presented in Fig. 6 show the overall spectral characteristics of the ambient light encountered in all recording sessions, where a positive skewness and even dispersion are consistent across the captured wavelength range. The skewness reflects an exponential decay of ambient light intensity in the presence of decreased visibility due to clouds. The standard deviations of the intensities are proportional to the mean intensities, exhibiting a positive linear relationship when normalized with respect to these. The latter linear characteristic is most likely to reflect the increase in optical absorption of water with respect to wavelength in the visible range.20 The average intensity of the red (625 to 675 nm) band was found to be around 1.4 times larger than that of the green (525 to 575 nm) band, and the average values of the red band show a 2% variability with respect to wavelength, in contrast to a 13% variability in the green band. The ambient light intensity of both the red and green bands and the obtained components of the corresponding plethysmographic signals can be seen to significantly and positively correlate. However, we observed no correlation between the ambient light intensity and the amplitude of the normalized components, e.g., Fig. 7 illustrates the pronounced and clear signals uncovered in the green channel, while the ambient light intensity is relatively higher in the red channel. The high amplitude of signals in the green channel is expected, as the maximum absorbance of hemoglobin in the visible part of the spectrum is in the range of 510 to 590 nm. This finding also agrees well with previous imaging PPG studies.6,7 The ideal amount of exercise needed to maintain fitness and reduce mortality from cardiovascular disease remains a matter of debate.21–26 For example, Lee et al. showed that moderate-intensity exercise training was sufficient to generate substantial benefits,23 and similar results have been reported elsewhere,24,26 while Williams argued that high-intensity training produced proportionally greater effects,22 which agrees well with a 20-year study regarding the reduction of premature mortality by high physical activity.25 Therefore, to help clinicians and researchers to evaluate and optimize the effects of exercise, it is clear that there is a need for a simple remote, reliable, and low-cost technique, ideally one that does not require a dedicated illumination source. To this end, the performance of our webcam-based imaging PPG system has been further validated by assessing its ability to measure heart rate reliably under various conditions. As can be seen in Fig. 8, a clear recuperation can be seen in the signals obtained by the webcam using ambient light, supporting its applicability in sports training and, more generally, in the evaluation of the physiological and pathological response to exercise. PPG is susceptible to motion-induced signal corruption, making the attenuation of motion artifacts one of the most challenging issues in all PPG signal processing.6 This paper verifies the performance of both imaging PPG systems (CMOS & webcam) for remote physiological assessment and investigates the relationship between the ambient light intensity and the obtained plethysmographic signals. A simple spatial averaging approach was used to attenuate the minor motion artifacts in the present study. Nevertheless, the use of sophisticated and more effective motion artifact compensation methodologies is encouraged, and more generalized imaging registration27,28 and blind source separation5,6 methods should be used in the future. The scope of this study is limited to the effects of exercise on measurements of heart rate. Therefore, consideration of respiration rate and blood oxygen saturation is the subject of a future study. Another improvement is to investigate the correlation between the plethysmographic signals derived from a CMOS camera and the ambient light intensity. In this study, the impact of the ambient light intensity on the iPPG signals was not addressed due to the short duration of the measurement period. A further study with an extended monitoring duration and a wider wavelength range (450 to 1000 nm) will be considered to further describe and understand the performance of CMOS camera-based imaging PPG system under different ambient light conditions. 7.ConclusionThe emerging field of imaging PPG technologies has provided some of the first quantitative insights into effective and comprehensive interpretation of remote physiological assessments. In this study, we have shown that a high-sensitivity CMOS camera and low-cost webcam exhibited comparable capabilities in measuring heart rate and the effect of exercise on this variable. Moreover, the results revealed an independent relationship between the ambient light intensity and the amplitude of normalized plethysmographic signals. Nevertheless, variations in ambient light intensity did not affect the ability of both camera systems to track remotely and accurately heart rate at rest and changes in heart associated with exercise. The results of this study thereby provide further support for the applicability of webcam-based imaging PPG systems in the remote assessment of physiological parameters such as heart and respiration rate, indicating a promising alternative to conventional cPPG with clear applications in triage and home-based monitoring systems. AcknowledgmentsThis work was supported by the National Institute for Health Research under Grant No. PD1: II–FS–0109–11005. The authors are grateful to The Research School of Systems Engineering, Loughborough University and Shanghai Jiao Tong University for their support. ReferencesA. B. Hertzman,
“Photoelectric plethysmography of the fingers and toes in man,”
Exp. Biol. Med., 37
(3), 529
(1937). http://dx.doi.org/10.3181/00379727-37-9630 EBMMBE 1535-3702 Google Scholar
J. Allen,
“Photoplethysmography and its application in clinical physiological measurement,”
Physiol. Meas., 28
(3), R1
–39
(2007). http://dx.doi.org/10.1088/0967-3334/28/3/R01 PMEAE3 0967-3334 Google Scholar
X. F. TengY. T. Zhang,
“The effect of contacting force on photoplethysmographic signals,”
Physiol. Meas., 25
(5), 1323
–1335
(2004). http://dx.doi.org/10.1088/0967-3334/25/5/020 PMEAE3 0967-3334 Google Scholar
X. F. TengY. T. Zhang,
“The effect of applied sensor contact force on pulse transit time,”
Physiol. Meas., 27
(8), 675
–684
(2006). http://dx.doi.org/10.1088/0967-3334/27/8/002 PMEAE3 0967-3334 Google Scholar
Y. Sunet al.,
“Motion-compensated noncontact imaging photoplethysmography to monitor cardiorespiratory status during exercise,”
J. Biomed. Opt., 16
(7), 077010
(2011). http://dx.doi.org/10.1117/1.3602852 JBOPFO 1083-3668 Google Scholar
M. Z. PohD. J. McDuffR. W. Picard,
“Non-contact, automated cardiac pulse measurements using video imaging and blind source separation,”
Opt. Express, 18
(10), 10762
–10774
(2010). http://dx.doi.org/10.1364/OE.18.010762 OPEXFF 1094-4087 Google Scholar
W. VerkruysseL. O. SvaasandJ. S. Nelson,
“Remote plethysmographic imaging using ambient light,”
Opt. Express, 16
(26), 21434
–21445
(2008). http://dx.doi.org/10.1364/OE.16.021434 OPEXFF 1094-4087 Google Scholar
F. P. WieringaF. MastikA. F. W. van der Steen,
“Contactless multiple wavelength photoplethysmographic imaging: a first step toward 'SpO(2) camera' technology,”
Ann. Biomed. Eng., 33
(8), 1034
–1041
(2005). http://dx.doi.org/10.1007/s10439-005-5763-2 ABMECF 0090-6964 Google Scholar
M. HulsbuschV. Blazek,
“Contactless mapping of rhythmical phenomena in tissue perfusion using PPGI,”
Proc. SPIE, 4683 110
–117
(2002). http://dx.doi.org/10.1117/12.463573 PSISDG 0277-786X Google Scholar
K. HumphreysT. WardC. Markham,
“Noncontact simultaneous dual wavelength photoplethysmography: a further step toward noncontact pulse oximetry,”
Rev. Sci. Instrum., 78
(4), 044304
(2007). http://dx.doi.org/10.1063/1.2724789 RSINAK 0034-6748 Google Scholar
Y. Sunet al.,
“Detection of physiological changes after exercise via a remote optophysiological imaging system,”
Proc. SPIE, 7891 78910E1
–78910E7
(2011). http://dx.doi.org/10.1117/12.872723 PSISDG 0277-786X Google Scholar
M. Z. PohD. J. McDuffR. W. Picard,
“Advancements in noncontact, multiparameter physiological measurements using a webcam,”
IEEE Trans. Biomed. Eng, 58
(1), 7
–11
(2011). http://dx.doi.org/10.1109/TBME.2010.2086456 IEBEAX 0018-9294 Google Scholar
G. Cenniniet al.,
“Heart rate monitoring via remote photoplethysmography with motion artifacts reduction,”
Opt. Express, 18
(5), 4867
–4875
(2010). http://dx.doi.org/10.1364/OE.18.004867 OPEXFF 1094-4087 Google Scholar
F. HlawatschG. F. Boudreaux-Bartels,
“Linear and quadratic time-frequency signal representations,”
IEEE Signal Proc. Magn., 9
(2), 21
–67
(1992). http://dx.doi.org/10.1109/79.127284 INSPEC 1053-5888 Google Scholar
S. QianD. Chen,
“Joint time-frequency analysis,”
IEEE Signal Proc. Magn., 16
(2), 52
–67
(1999). http://dx.doi.org/10.1109/79.752051 INSPEC 1053-5888 Google Scholar
J. M. BlandD. G. Altman,
“Statistical methods for assessing agreement between two methods of clinical measurement,”
Lancet, 327
(8476), 307
–310
(1986). http://dx.doi.org/10.1016/S0140-6736(86)90837-8 LANCAO 0140-6736 Google Scholar
L. WangC. C. Y. PoonY. T. Zhang,
“The non-invasive and continuous estimation of cardiac output using a photoplethysmogram and electrocardiogram during incremental exercise,”
Physiol. Meas., 31
(5), 715
–726
(2010). http://dx.doi.org/10.1088/0967-3334/31/5/008 PMEAE3 0967-3334 Google Scholar
M. S. Laueret al.,
“Impaired heart rate response to graded exercise—prognostic implications of chronotropic incompetence in the Framingham Heart Study,”
Circulation, 93
(8), 1520
–1526
(1996). http://dx.doi.org/10.1161/01.CIR.93.8.1520 CIRCAZ 0009-7322 Google Scholar
P. Tanabeet al.,
“Reliability and validity of scores on the emergency severity index version 3,”
Acad. Emerg. Med., 11
(1), 59
–65
(2004). http://dx.doi.org/10.1197/j.aem.2003.06.013 AEMEF5 1069-6563 Google Scholar
R. M. PopeE. S. Fry,
“Absorption spectrum (380-700 nm) of pure water, II. integrating cavity measurements,”
Appl. Opt., 36
(33), 8710
–8723
(1997). http://dx.doi.org/10.1364/AO.36.008710 APOPAI 0003-6935 Google Scholar
K. Iwasakiet al.,
“Dose–response relationship of the cardiovascular adaptation to endurance training in healthy adults: how much training for what benefit?,”
J. Appl. Physiol., 95
(4), 1575
–1583
(2003). http://dx.doi.org/10.1152/japplphysiol.00482.2003 JAPYAA 0021-8987 Google Scholar
P. T. Williams,
“Relationships of heart disease risk factors to exercise quantity and intensity,”
Arch. Intern. Med., 158
(3), 237
–245
(1998). http://dx.doi.org/10.1001/archinte.158.3.237 AIMDAP 0003-9926 Google Scholar
I. M. LeeC. C. HsiehR. S. Paffenbarger Jr.,
“Exercise intensity and longevity in men. The Harvard Alumni Health Study,”
JAMA, 273
(15), 1179
–1184
(1995). http://dx.doi.org/10.1001/jama.1995.03520390039030 JAMAAP 0098-7484 Google Scholar
T. A. Lakkaet al.,
“Relation of leisure-time physical activity and cardiorespiratory fitness to the risk of acute myocardial infarction,”
N. Engl. J. Med., 330
(22), 1549
–1554
(1994). http://dx.doi.org/10.1056/NEJM199406023302201 NEJMAG 0028-4793 Google Scholar
J. Pekkanenet al.,
“Reduction of premature mortality by high physical activity: a 20-year follow-up of middle-aged Finnish men,”
Lancet, 329
(8548), 1473
–1477
(1987). LANCAO 0140-6736 Google Scholar
J. N. Morriset al.,
“Vigorous exercise in leisure-time: protection against coronary heart disease,”
Lancet, 316
(8206), 1207
–1210
(1980). http://dx.doi.org/10.1016/S0140-6736(80)92476-9 LANCAO 0140-6736 Google Scholar
D. I. BarneaH. F. Silverman,
“A class of algorithms for fast digital image registration,”
IEEE Trans. Comput., 100
(2), 179
–186
(1972). http://dx.doi.org/10.1109/TC.1972.5008923 ITCOB4 0018-9340 Google Scholar
L. Brown,
“A survey of image registration techniques,”
ACM Comput. Surv. (CSUR), 24
(4), 325
–376
(1992). http://dx.doi.org/10.1145/146370.146374 Google Scholar
|
||||||||||||||||||||||||||||||||||||||||||||||||||||||||||||||||||||||||||||||||||||||||||||||||||||||||||||||||||||||||||||||||||


