|
|
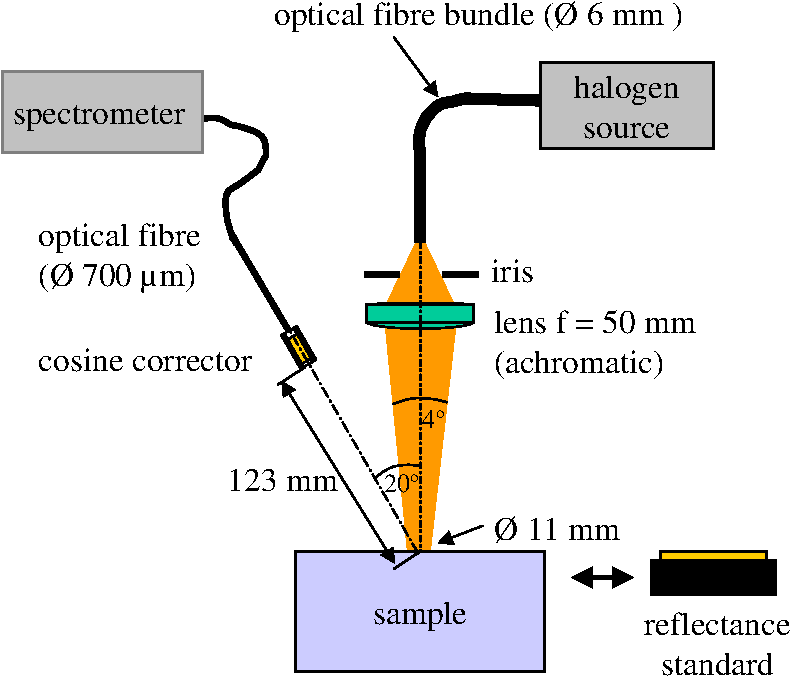
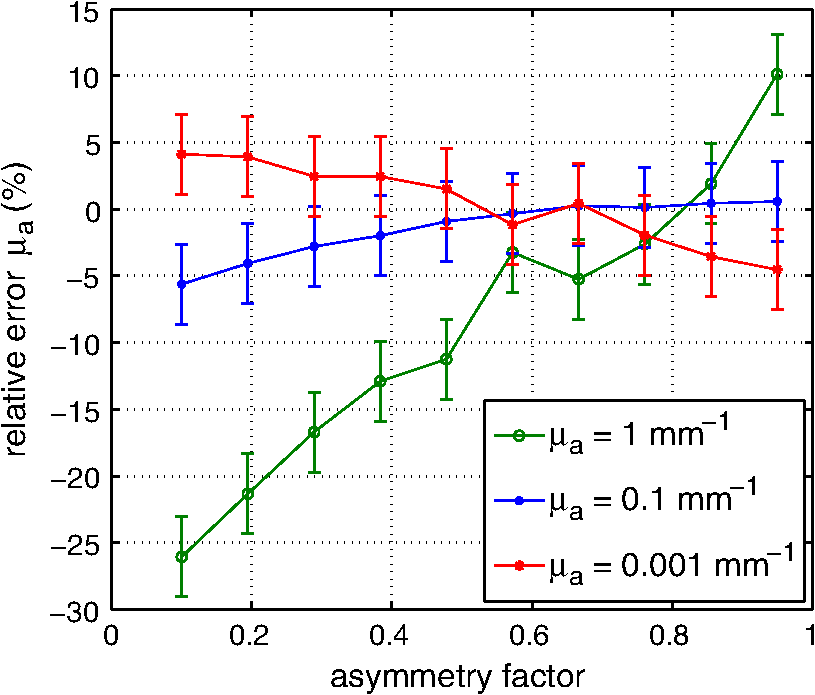
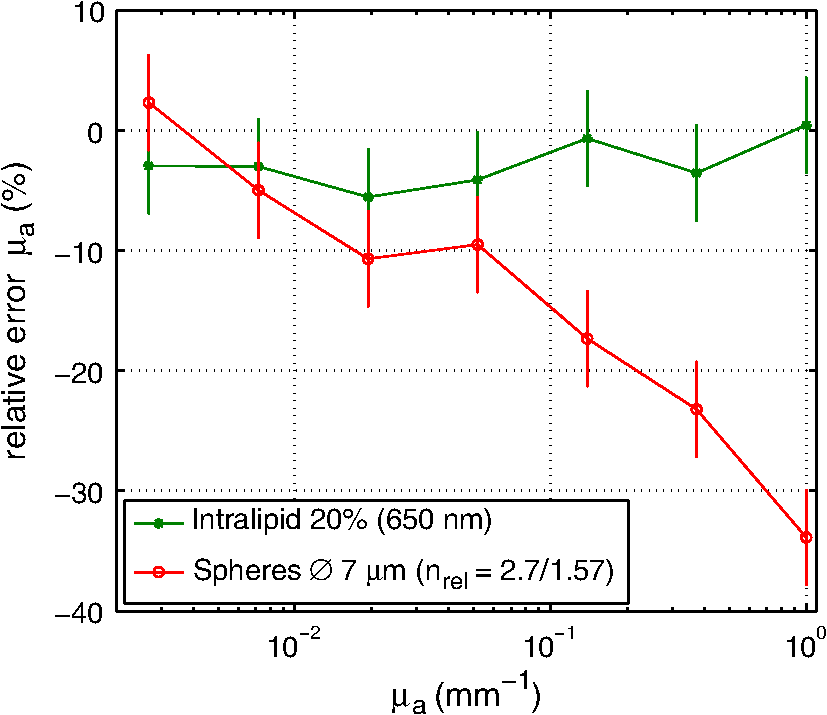
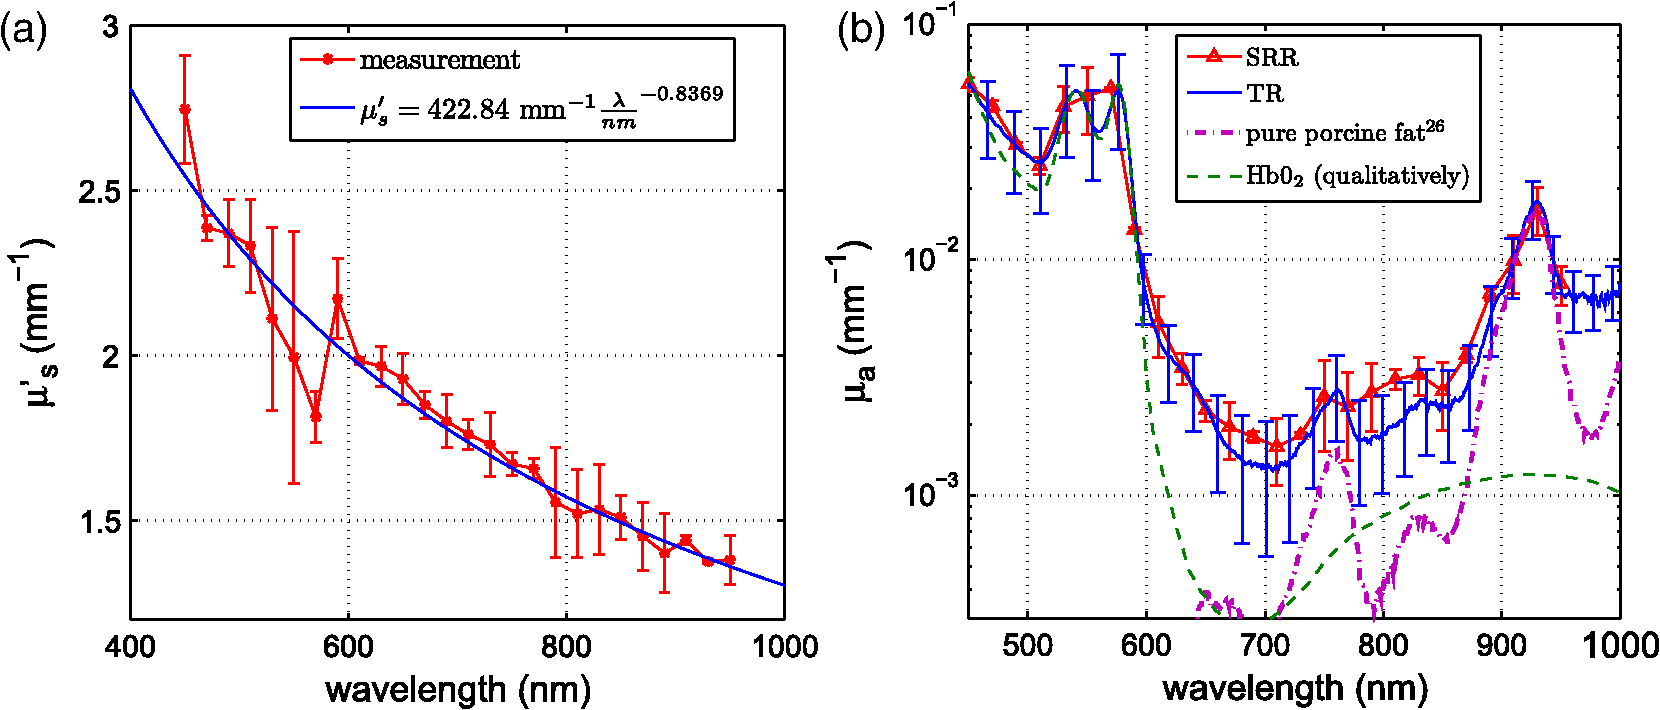
1.IntroductionCalculations of the light propagation in turbid media depend on the optical properties and, thus, their precise determination is important, such as for applications in biophotonics. In addition, the spectrally resolved absorption coefficient carries information about the ingredients of the turbid medium, which can be used for process control. In the past, different methods measuring the reflected light from turbid samples were used for the determination of the absorption and the reduced scattering coefficients. Using methods like the measurement of the time-resolved reflectance,1,2 the frequency-domain reflectance3–5 or the spatially resolved reflectance,6–10 both coefficients can be obtained. As most of these methods determine the optical properties only for a few wavelengths, the spectral information cannot be fully exploited. However, the spectral resolution can be included in the fiber-based spatially-resolved reflectance if a spectrometer is used for detection.11,12 Alternatively, the measurement of the frequency-domain reflectance at several wavelengths can be combined with the steady-state reflectance determined at one distance with a high-spectral resolution.13 In this work, we present a method for the determination of the absorption coefficient of homogeneous, quasi semi-infinite turbid media combining the measurement of the spatially resolved reflectance (SRR) and of the total reflectance (TR). Using a recently described SRR setup,14 the reduced scattering coefficient and absorption coefficient is determined in the spectral range from 450 to 950 nm. This measurement is especially sensitive to the determination of . As the measurements have to be performed successively, only a poor wavelength resolution can be obtained within a reasonable measurement time. Based on the flat curve shape of the spectrum of many turbid media the dependence of the reduced scattering coefficient versus wavelength can often be described by a power law. Therewith can be interpolated for any wavelength. In a second step the scattered light from an illuminated sample in a certain direction is measured with the TR method, achieving a high spectral resolution with a white light source for illumination and a spectrometer as a detector. As we cannot distinguish between scattering and absorption with this method, we use the a priori information of the reduced scattering coefficient measured with the SRR method to determine the absorption coefficient. The evaluation is performed by means of Monte Carlo (MC) simulations considering the setup geometry. The absorption coefficients obtained with the dual step method can be compared with those determined within the SRR method. Especially in turbid tissue, for which the phase function and the refractive index is often not exactly known, this helps confirm the measured coefficients. The scope of this technique is the determination of the optical properties of homogeneous media, which can be assumed to be semi-infinite. For example, in the process control, as well as for characterization of optical phantoms, this geometry is often applicable. The literature describes another two-step method for determination of the optical properties in the steady state domain. Patterson et al.15 presented a combination of a spatially resolved and a total reflectance method for a single wavelength. The total reflectance was measured using an integrating sphere accepting the re-illumination of the sample by the integrating sphere. The reflectance was analyzed by means of a solution of the diffusion theory. Wilson et al.16 used the same setup again at a single wavelength and improved the theory using MC simulations, but they did not regard the exact geometry of the setup in the simulations. 2.Experimental Setup2.1.Spatially Resolved ReflectanceIn our recent article14 a fully automated SRR spectrometer is described. A CCD camera is used to measure the intensity profile on the surface of a point-like illuminated sample at distances up to 25 mm with a resolution of approximately 90 μm. We showed that it is very important to take the characteristics of the setup into account, for example, the optical transfer function of the system and the dependence of the background on the time elapsed since the last picture. Systematic errors caused by using the diffusion theory to determine the optical properties were estimated. Using liquid phantoms we showed with this setup that it is possible to determine the reduced scattering and absorption coefficients with an error smaller than 6% and 20%, respectively. 2.2.Total ReflectanceIn the TR method the sample is illuminated by applying a white light source. A scheme of the setup is shown in Fig. 1. A tungsten halogen light source is coupled into a optical fiber bundle () where the sample-sided end is imaged perpendicularly onto the surface of the sample. The incident power on the sample surface is about 60 mW for the whole spectrum. An aperture between the fiber bundle and the imaging lens (, achromatic, VIS AR coated) avoids the illumination of the lens mount. The spot size on the surface is 11 mm in diameter with a maximum angle of incidence of 2 deg with respect to the surface normal. The light, scattered from all positions at the surface in the direction of the detector, is measured using a spectrometer (BTC112E TE, Polytec GmbH, Waldbronn, Germany). With this spectrometer the reflectance can be measured from 450 to 1000 nm with a resolution of 0.5 nm. We used an integration time of 2.5 sec per scan and averaged the signal over 30 scans. The light is collected by means of a optical fiber (). To mix the angles coupled into the optical fiber a cosine corrector (CC-3, Ocean Optics, Dunedin, USA) is used in front of the optical fiber. The cosine corrector () is mounted with an inclination angle of 20 deg with respect to the surface normal of the sample at a distance of 123 mm to the surface pointing to the center of the illumination spot. The use of the cosine corrector is essential, because the light from all locations of the sample surface has to be coupled into the optical fiber with almost the same probability and angular distribution. The specular reflex of smooth sample surfaces is not detected, as it is back-reflected to the illumination optics. The incident light power is measured indirectly using a white standard (Spectralon SRS-75 to 010, Labsphere, North Sutton, USA) instead of the sample. For the perpendicularly illuminated reflectance standard the angular distribution of the reflected light was measured with a goniometer showing roughly a cosine dependence. The reflectance at the detection angle of 20 deg with respect to the surface normal of the sample was approximately 5% higher than the expected cosine dependence which is used in the evaluation process. 3.TheoryTo analyze the TR measurements, we solved the radiative transfer equation (RTE) by means of MC simulations for the given setup geometry. For calculations of the light propagation in the turbid sample, a self-written MC code whose principles are similar to those described by Wang et al.17 was used. A scheme of the setup geometry as regarded in the simulations is shown in Fig. 2. In these simulations the illumination spot was included by starting the photons equally distributed in a circle with a diameter of 11 mm. The incident cone was modeled by launching each photon with a randomly chosen starting angle between 0 and 2 deg with respect to the surface normal of the sample. The reflection on the surface is considered according to Fresnel’s law. The sample geometry was assumed to be semi-infinite with a plain surface between the scattering and the non-scattering layer. To check the influence of the lateral surface boundaries absorbing borders are included at the position of the sample container. For the propagation procedure the medium is described by its reduced scattering coefficient , absorption coefficient , refractive index and its phase function . For the phase function the Henyey-Greenstein18 function was used, which includes as parameters the anisotropy factor , defined as the average cosine of the scattering angles. For all reflected photons we calculate (considering refraction) if they reach the detector. As the detector is relatively small only a few photons are collected by the detector and thereby the computing time is large. For isotropic light propagation in the sample and perpendicular light incidence the angle of the detector is irrelevant. Therefore we can collect all photons that hit the spherical zone containing the detector which leads to a better performance of the MC simulations. Fig. 2Scheme of the setup geometry as used for the Monte Carlo simulations to analyze the measured data. 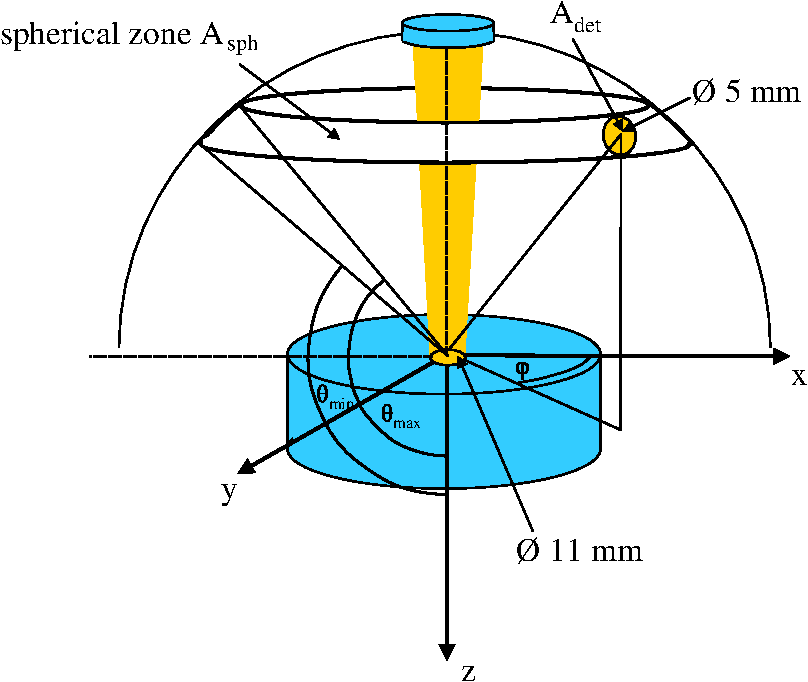 The reflectance calculated from the simulation is the ratio of the detected photons within the spherical zone and the incident photons as measured with the used detector considering the fraction of the area of the detector and the area of the spherical zone We note that if the spherical zone and the ratio of the areas are considered this is not the exact solution for the circular detector, as we create a trapezoidal area of the same size as the circular detector. But as the reflected light changes very slightly over the -angle this is an acceptable approximation.In order to compare the reflectance of the simulation with that of the measurements the following steps have to be carried out to normalize the measurements. The reflectance of the sample is given by where is the measured power of the light reflected from the sample and the incident power. As the incident power is determined indirectly using a reflectance standard, the power reflected from this into the detector has to be calculated. Assuming a cosine dependence of the reflected light from the standard the reflected power per solid angle can be expressed as Using the same spherical zone as in the simulations and considering the ratio of the areas leads to the power measured with the detector from the reflection standard of by integrating between and of the spherical zone (see Fig. 2). Thereby the total reflection coefficient of the reflection standard is given by the manufacturer and is the measured deviation to the cosine dependence at the given detection angle (1.05). After inserting Eq. (4) into Eq. (2) the reflectance from the sample can be expressed by As the ratio of the areas appears in the reflectance term of the simulation [Eq. (1)] as well as in the reflectance term of the measurement [Eq. (5)] it is not to necessary to calculate this ratio explicitly in order to compare measurement and simulation.For the calibration a set of MC simulations was run. We fixed the reduced scattering coefficient to a certain value and calculated the reflectance measured within the spherical zone for absorption coefficients between . The refractive index was set to and the anisotropy factor to using the Henyey-Greenstein phase function as a mean value expected for measurements on Intralipid phantoms.19 We repeated this procedure for different that are given in Fig. 3 using photons in the MC simulation. The ratio of is plotted against the simulated reflectance in Fig. 3. Fig. 3Calibration curves for the determination of the optical properties simulated for the geometry of the described setup. The ratio (using a polynomial interpolation) is plotted versus the reflectance measured within the spherical zone for different reduced scattering coefficients.  Figure 3 shows that for a ratio smaller than 100 the reflectance is almost independent of the reduced scattering coefficient and depends just on the ratio of . For higher ratios the reflectance also depends on . This means that for low absorption (high ratio) the actual reduced scattering coefficient in the phantom has to be regarded, whereas in media with a higher absorption (low ratio) one simulation with an arbitrary is sufficient for the evaluation. This effect is caused by photons exiting the medium far from the source and entering the detector mainly within higher angles. For these photons the probability of hitting the detector is reduced. As a consequence, this effect reduces the reflectance especially if and are both low, which can be observed in Fig. 3. To analyze the measured reflectance values the simulated reflectance curves were fitted with a 13th order polynomial. With this polynomial the ratio for a measured reflectance can be quickly determined. As for lower the reflectance depends on the , we simulated the calibration curves for seven different reduced scattering coefficients between and interpolated for the actual in the sample. With the a priori information of the reduced scattering coefficient, we calculate the absorption coefficient of the turbid medium. Based on the flat curve shape of the reduced scattering coefficient, it can even be extrapolated with good accuracy. In addition, in turbid media with high absorption it is often possible to find a spectral region in which the absorption is relatively low and where can be determined using the SRR. By extrapolating the absorption coefficient can then be determined for the whole spectral range. 3.1.Other Approaches for AnalysisTwo alternative approaches can be used to obtain the TR. First, in order to improve the velocity of the MC simulations all photons reflected from the medium can be collected and the reflectance is calculated assuming a cosine dependence of the measured signal. Thereby the distance of the detector to the sample is assumed to be infinite and just the solid angle is considered. Second, an even faster approach to calculate the total reflectance of a turbid medium can be found within the diffusion theory (DT). The reflectance can be expressed by following Patterson et al.15 Thereby is the transport albedo and . The diffuse reflection coefficient is with the refractive index of the turbid medium. In Fig. 4 the two methods are compared to our method for a reduced scattering coefficient of .Fig. 4Comparison of different methods for the evaluation of the absorption coefficient. The total reflectance calculated with the Monte Carlo method considering the setup geometry (MC setup) is shown next to the total reflectance calculated by Monte Carlo simulations where all photons are detected (MC all) and the solution of the diffusion theory (DT all). 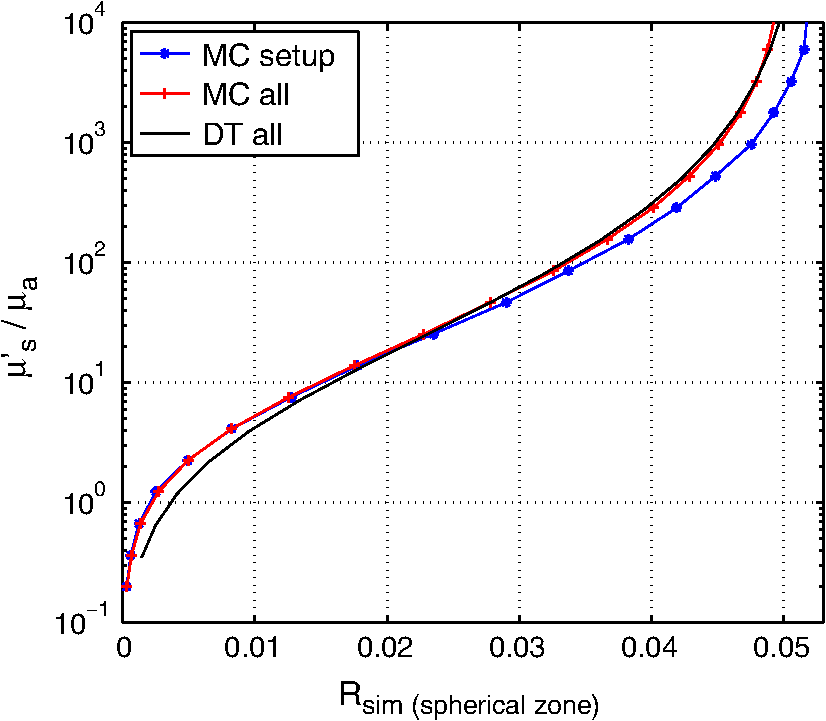 For low ratios there is almost no difference between the two MC methods. As for these ratios the photons propagate only short distances through the medium and leave it close to the source, so the influence of the detector geometry is low. The DT differs from both MC simulations as the DT is not valid for low ratios. For high ratios the MC simulation in which all photons are collected agrees with the DT as both methods consider all photons that leave the medium. In summary, the MC simulation including the setup geometry differs from both alternative methods and therefore the latter cannot be used for the evaluation of the absorption coefficient. 3.2.Systematic ErrorsThe refractive index and the phase function of turbid media are often unknown. For data analysis these coefficients have to be estimated. Furthermore, both coefficients depend on the wavelength. In Secs. 3.2.1 to 3.2.3 we investigate the influence on the determination of the absorption coefficient if a fixed refractive index, -factor, and phase function are used for the spectral evaluation. 3.2.1.Refractive indexFor studying the influence of the unknown refractive index the reflectance was calculated with the MC simulation method considering the setup geometry. The parameters for the simulation were and using the Henyey-Greenstein phase function. We run two sets of simulations with and , respectively. In each set the refractive index of the medium was varied between . The absorption coefficient was determined from these reflectance values using the calibration polynomial (see Sec. 3) of the simulations with , and an anisotropy factor of . The relative errors of the determined absorption coefficients are shown in Fig. 5. The study was repeated three times with photons in all MC simulations. The error bars show the standard deviation of these three simulations. The relative error caused by the refractive index mismatch is almost independent of the absorption. For a deviation of 0.01 from the actual refractive index to the assumed one we obtained a relative error of about 2% in the determination of the absorption coefficient. Assuming a constant refractive index at all wavelengths for water-based phantoms in which the refractive index varies by 0.02 over the wavelength range between 450 and 950 nm we expect a maximum error of 4%. 3.2.2.Asymmetry factorWe calculated similar sets of simulations as in Sec. 3.2.1 fixing the refractive index to and varying the asymmetry factor between assuming the Henyey-Greenstein function. An additional set of simulations using was simulated. The relative errors are presented in Fig. 6. Here, a clear dependence on the absorption coefficient can be seen. If the absorption coefficient is large then the influence of the asymmetry factor on the determination of is also large. But as the asymmetry factor in biological tissue is usually between 0.6 and 0.95, we expect errors of less than 5% if the wavelength dependence of the asymmetry factor is ignored in the evaluation. 3.2.3.Phase functionIn a further study the Henyey-Greenstein function in the simulations was changed to a more realistic one. On the one hand we used the measured phase function of Intralipid 20%19 and on the other hand the phase function for spheres with a diameter of 7 μm () in epoxy resin () calculated with the Mie theory was applied. The asymmetry factor of both phase functions is . We calculated simulations with , and varied the absorption coefficient between . The absorption coefficient is determined using a calibration polynomial calculated from simulations with the same reduced scattering coefficient, refractive index, and g-factor applying the Henyey-Greenstein phase function. The relative errors of are shown in Fig. 7. From the reflectance calculated with the Intralipid 20% phase function, which is similar to the Henyey-Greenstein function, the absorption coefficient is determined to be approximately 4% too low for all absorption coefficients. Conversely, for the reflectance calculated with the phase function of the spheres larger relative errors are determined for the absorption coefficient. This is caused by the differences between the Henyey-Greenstein function and the phase function of the spheres that show a peak in backward direction. Especially for large relative errors up to 30% occur. In summary, in media with Henyey-Greenstein- like phase functions this method provides good results, but when the phase function differs this has to be regarded in the theory. 4.Measurements on Phantom MediaIn order to test the setup, measurements on liquid phantoms made of Intralipid 20%20,21 (Fresenius Kabi, Bad Homburg, Germany), Ink (Pelikan, black ink, Hannover, Germany), and buffer solution pH 8.0 (Merck, Darmstadt, Germany) were performed. The buffer was used in the phantoms to stabilize the absorber avoiding a spectral shift of the absorption band when the pH changes. In contrast to India ink (suspended carbon particles) the used ink is a solution of different dyes. As it is a molecular absorber with negligible scattering, the absorption coefficient was measured with a spectrophotometer (Cary 5000, Varian/Agilent Technologies, Santa Clara, USA) for comparison with the TR measurements. The absorption in the phantom is caused by ink, water,22,23 and soy oil in the Intralipid 20%.14 For this study, five phantoms were produced with a concentration of of Intralipid 20% resulting in a reduced scattering coefficient of about at 500 nm. The concentration of ink was varied from (V1 to V5). The samples were measured in a cylindrical container with 90 mm in diameter and 50 mm in height. Thus, the medium can be considered as optically semi-infinite for the used parameters. For each phantom we determined the wavelength dependent reduced scattering coefficient using the SRR method and fitted the power law equation to the values. The determined reduced scattering coefficient is not shown as it fits the power law excellently. The absorption coefficient was calculated using the reduced scattering coefficient measured before as described in Sec. 2.1. In the calibration simulation a constant refractive index of and anisotropy factor of were assumed. Figure 8 shows the determined absorption coefficients of the phantoms together with the expected values. The expected absorption coefficient is the combination of the water absorption, the soy oil absorption, and the ink absorption considering the concentrations of these absorbers. Each phantom has been measured three times and the standard deviation is represented with error bars. The absorption coefficient determined for the five phantoms agrees well with the predicted absorption spectra. Figure 8 shows that we are able to measure the absorption coefficient over a range of more than four orders of magnitude due to the use of the MC simulations. Large absorption coefficients in comparison with the reduced scattering coefficient can also be determined precisely. The absorption of ink, soy oil, and water can be resolved. Also, with this method the absorption of the Intralipid 20% dilution without ink (V1), as investigated in our earlier paper,14 can be confirmed. The mean error between the predicted and the determined absorption is lower than 10%. 5.Measurements on Biological TissueAs one example for measurements on biological tissue we present the determination of and of the fat layer of porcine rind. The skin and the meat have been removed from the rind in order to perform only measurements of the fat layer. As the fat layer from the back of the pig was only approximately 1 cm thick we piled five pieces on top of each other to get a sample of by with a height of 5 cm to obtain a optically semi-infinite medium. Because of the softness of the tissue the single pieces fit tightly together without a remaining air gap. Using the SRR method we first determined the reduced scattering and absorption coefficients between 450 and 950 nm with a step size of 20 nm. After interpolating the with the power law we determined the absorption coefficient with the TR method again with higher spectral resolution. The results are shown in Fig. 9. For the evaluation a refractive index of 24 and an asymmetry factor of were assumed. We performed three measurements on different pieces of the rind. The standard deviation is represented in the error bars. The determined reduced scattering coefficient shows the expected behavior that can be well described by the power law, [see Fig. 9(a)]. The absorption coefficients of the rind measured with both methods show a good agreement within the error bars [compare Fig. 9(b)]. Several features can be observed in the absorption spectrum. In the wavelength range between 500 and 600 nm the absorption of oxi-haemoglobin25 can be seen. The qualitative comparison with the oxi-haemoglobin spectrum identifies both peaks. Furthermore, the absorption peaks in the spectral range between 700 and 950 nm can be identified as those of pure porcine fat.26 As the combination of the absorption of oxi-haemoglobin and porcine fat is not identical to the measured spectrum, other absorbers such as deoxi-haemoglobin must be comprised in the fat sample. 6.ConclusionIn summary, we presented a dual step method for the determination of the absorption coefficient of turbid media in a broad spectral range with high spectral resolution. In order to determine the absolute absorption coefficient of turbid media with the measurement of the total reflectance, the knowledge of the reduced scattering coefficient is required. This coefficient was determined with spatially resolved reflectance measurements. The total reflectance was evaluated using MC simulations in which the setup geometry was considered. We showed that the average error of the determined absorption coefficient is smaller than 10%, assuming that the refractive index and the phase function is approximately known for the spectral evaluation. The TR method can be further improved if the wavelength dependence of the refractive index and the phase function is considered in the evaluation. The measurements on Intralipid/ink phantoms verified that the absorption coefficient can be obtained with an average error of less than 10% for a range of four orders of magnitude. The determination of the absorption coefficient of the fat layer of porcine rind showed absorption peaks that can be associated with the absorption of oxi-haemoglobin and pure porcine fat. ReferencesM. PattersonB. ChanceB. Wilson,
“Time resolved reflectance and transmittance for the non-invasive measurement of tissue optical properties,”
Appl. Opt., 28
(12), 2331
–2336
(1989). http://dx.doi.org/10.1364/AO.28.002331 APOPAI 0003-6935 Google Scholar
A. Pifferiet al.,
“Fully automated time domain spectrometer for the absorption and scattering characterization of diffusive media,”
Rev. Sci. Instrum., 78
(5), 053103
(2007). http://dx.doi.org/10.1063/1.2735567 RSINAK 0034-6748 Google Scholar
M. Pattersonet al.,
“Frequency-domain reflectance for the determination of the scattering and absorption properties of tissue,”
Appl. Opt., 30
(31), 4474
–4476
(1991). http://dx.doi.org/10.1364/AO.30.004474 APOPAI 0003-6935 Google Scholar
B. Tromberget al.,
“Non-invasive measurements of breast tissue optical properties using frequency-domain photon migration,”
Phil. Trans. Roy. Soc. Lond. B: Biol. Sci., 352
(1354), 661
–668
(1997). http://dx.doi.org/10.1098/rstb.1997.0047 PTRBAE 0962-8436 Google Scholar
J. Fishkinet al.,
“Frequency-domain photon migration measurements of normal and malignant tissue optical properties in a human subject,”
Appl. Opt., 36
(1), 10
–20
(1997). http://dx.doi.org/10.1364/AO.36.000010 APOPAI 0003-6935 Google Scholar
T. FarrellM. PattersonB. Wilson,
“A diffusion theory model of spatially resolved, steady-state diffuse reflectance for the noninvasive determination of tissue optical properties in vivo,”
Med. Phys., 19
(4), 879
–888
(1992). http://dx.doi.org/10.1118/1.596777 MPHYA6 0094-2405 Google Scholar
A. Kienleet al.,
“Spatially resolved absolute diffuse reflectance measurements for noninvasive determination of the optical scattering and absorption coefficients of biological tissue,”
Appl. Opt., 35
(13), 2304
–2314
(1996). http://dx.doi.org/10.1364/AO.35.002304 APOPAI 0003-6935 Google Scholar
R. GroenhuisH. FerwerdaJ. Bosch,
“Scattering and absorption of turbid materials determined from reflection measurements. 1: theory,”
Appl. Opt., 22
(16), 2456
–2462
(1983). http://dx.doi.org/10.1364/AO.22.002456 APOPAI 0003-6935 Google Scholar
R. GroenhuisJ. BoschH. Ferwerda,
“Scattering and absorption of turbid materials determined from reflection measurements. 2: measuring method and calibration,”
Appl. Opt., 22
(16), 2463
–2467
(1983). http://dx.doi.org/10.1364/AO.22.002463 APOPAI 0003-6935 Google Scholar
S. Andreeet al.,
“Evaluation of a novel noncontact spectrally and spatially resolved reflectance setup with continuously variable source detector separation using silicone phantoms,”
J. Biomed. Opt., 15
(6), 067009
(2010). http://dx.doi.org/10.1117/1.3526367 JBOPFO 1083-3668 Google Scholar
M. NicholsE. HullT. Foster,
“Design and testing of a white-light, steady-state diffuse reflectance spectrometer for determination of optical properties of highly scattering systems,”
Appl. Opt., 36
(1), 93
–104
(1997). http://dx.doi.org/10.1364/AO.36.000093 APOPAI 0003-6935 Google Scholar
R. Doornboset al.,
“The determination of in vivo human tissue optical properties and absolute chromophore concentrations using spatially resolved steady-state diffuse reflectance spectroscopy,”
Phys. Med. Biol., 44
(4), 967
–981
(1999). http://dx.doi.org/10.1088/0031-9155/44/4/012 PHMBA7 0031-9155 Google Scholar
F. Bevilacquaet al.,
“Broadband absorption spectroscopy in turbid media by combined frequency-domain and steady-state methods,”
Appl. Opt., 39
(34), 6498
–6507
(2000). http://dx.doi.org/10.1364/AO.39.006498 APOPAI 0003-6935 Google Scholar
F. FoschumM. JägerA. Kienle,
“Fully automated spatially resolved reflectance spectrometer for the determination of the absorption and scattering in turbid media,”
Rev. Sci. Instrum., 82 103104
(2011). Google Scholar
M. PattersonE. SchwartzB. Wilson,
“Quantitative reflectance spectrophotometry for the noninvasive measurement of photosensitizer concentration in tissue during photodynamic therapy,”
Proc. SPIE, 1065 115
–122
(1989). Google Scholar
B. WilsonS. Jacques,
“Optical reflectance and transmittance of tissues: principles and applications,”
IEEE J. Quant. Electron., 26
(12), 2186
–2199
(1990). http://dx.doi.org/10.1109/3.64355 IEJQA7 0018-9197 Google Scholar
L. WangS. JacquesL. Zheng,
“MCML-monte carlo modeling of light transport in multi-layered tissues,”
Comput. Meth. Programs Biomed., 47
(2), 131
–146
(1995). http://dx.doi.org/10.1016/0169-2607(95)01640-F CMPBEK 0169-2607 Google Scholar
L. HenyeyJ. Greenstein,
“Diffuse radiation in the galaxy,”
Astrophys. J., 93
(1), 70
–83
(1941). http://dx.doi.org/10.1086/144246 ASJOAB 0004-637X Google Scholar
R. MichelsF. FoschumA. Kienle,
“Optical properties of fat emulsions,”
Opt. Express, 16
(8), 5907
–5925
(2008). http://dx.doi.org/10.1364/OE.16.005907 OPEXFF 1094-4087 Google Scholar
H. Van Staverenet al.,
“Light scattering in intralipid-10% in the wavelength range of 400–1100 nm,”
Appl. Opt., 30
(31), 4507
–4514
(1991). http://dx.doi.org/10.1364/AO.30.004507 APOPAI 0003-6935 Google Scholar
F. MartelliG. Zaccanti,
“Calibration of scattering and absorption properties of a liquid diffusive medium at NIR wavelengths. cw method,”
Opt. Express, 15
(2), 486
–500
(2007). http://dx.doi.org/10.1364/OE.15.000486 OPEXFF 1094-4087 Google Scholar
L. KouD. LabrieP. Chylek,
“Refractive indices of water and ice in the 0.65-to 2.5-μm spectral range,”
Appl. Opt., 32
(19), 3531
–3540
(1993). http://dx.doi.org/10.1364/AO.32.003531 APOPAI 0003-6935 Google Scholar
R. PopeE. Fry,
“Absorption spectrum (380–700 nm) of pure water. ii. integrating cavity measurements,”
Appl. Opt., 36
(33), 8710
–8723
(1997). http://dx.doi.org/10.1364/AO.36.008710 APOPAI 0003-6935 Google Scholar
G. Baumert,
“Das butter-refraktometer,”
Z. Lebensm. Unters. Forsch., 9
(3), 134
–137
(1905). Google Scholar
W. GratzerA. Allison,
“Multiple haemoglobins,”
Biol. Rev., 35
(4), 459
–503
(1960). http://dx.doi.org/10.1111/brv.1960.35.issue-4 1464-7931 Google Scholar
R. Van Veenet al.,
“Determination of visible near-ir absorption coefficients of mammalian fat using time- and spatially resolved diffuse reflectance and transmission spectroscopy,”
J. Biomed. Opt., 10
(5), 054004
(2005). http://dx.doi.org/10.1117/1.2085149 JBOPFO 1083-3668 Google Scholar
|