|
|
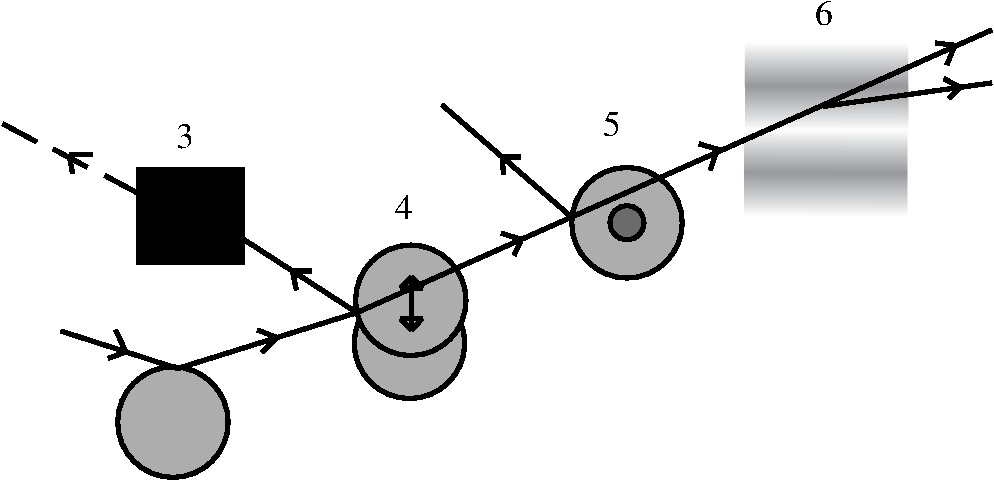
1.IntroductionNoninvasive diagnostic imaging technologies to detect cancer and other diseases come in a wide variety. Most of these technologies like MRI and x-ray lack optical contrast that can be beneficial for detection of small lesions without the use of contrast agents or ionizing radiation.1 Optical techniques such as optical coherence tomography (OCT) and diffuse optical tomography (DOT) show good contrast, but the measuring depth and resolution, respectively, are limited by the strong scattering of tissue. Measuring with high resolution at penetration depths larger than 1 mm is challenging due to the high optical scattering that induces a strong attenuation of ballistic photons. These optical techniques are noninvasive and use nonionizing radiation in contrast to x-ray. The absorption coefficient of light is wavelength dependent, making spectroscopy possible, which can be used to determine blood oxygenation levels. Ultrasound (US) in the few MHz ranges has a scattering coefficient two to three orders of magnitude2 less than light, which comparatively allows for superior penetration depth while retaining spatial resolution. There is, however, a drawback in which US lacks the benefits of optical contrast. Two hybrid forms of imaging techniques that use the interplay of sound and light are emerging: acousto-optics (AO) and photoacoustics (PA). These techniques combine the high resolution of US with the strong contrast found in purely optical techniques while remaining noninvasive in nature. The principle of PA relies on a light pulse irradiating an object of interest. Some parts of the object will absorb this light and will expand thermoelastically. The resulting expansion causes an US wave that is detected by a broadband US probe.3 The resolution is limited by the light pulse duration, the acoustic tissue properties, and the frequency transfer function of the US detection. The higher the detected frequencies the higher the resolution will be. The longer the light pulse duration, the lower the frequencies of the PA signal and the lower the resolution. The acoustic attenuation typically increases with the acoustic frequency, therefore the resolution deteriorates with increasing depth. Typical resolutions are micrometers for PA microscopy with a measuring depth of millimeters4 and up to millimeters for PA mammography5 on a measuring depth of centimeters. While the resolution is achieved by the ultrasound, the contrast is provided by optical absorption; the amount of detected pressure depends on the optical absorption inside the object under investigation. A second technique that combines ultrasound and light is AO. The possibility of tagging light was investigated by Marks et al.6 Leutz and Maret,7 Wang et al.8 and by a patent from Dolfi and Micheron.9 The sample is illuminated with coherent light, and hence a speckle pattern is formed due to complete randomization of the phases of the electric field of the light escaping from the medium. To measure only photons that traveled through a volume of interest, ultrasound (US) is employed to encapsulate this bounded region from the characteristic focal zone of the transducer. The photons passing through the US focus will be frequency shifted or, in other words, phase modulated and thus tagged by the US. A variety of tagging strategies have been developed, along with different detection schemes to find the tagged photons in the sea of untagged photons. The tagged photons detected after exiting the medium provide information on the optical properties present in the vicinity of the volume of interest. When the tagging zone is placed in a tissue volume with high optical absorption compared with the rest of the object, less tagged photons will be detected. This in contrast with when the ultrasound focus is placed in the neighboring tissue. In this review we describe the progress made in AO imaging since the previous review by Wang10 in 2003: theoretical models, the detection methods to detect the tagged photons, and applications of AO imaging. For further reading, are view by Elson et al.11 is also focusing on the detection methods, scanning, and applications. They give, however, no equations from the models in the modeling section. In recent years, considerable improvements in AO have been realized. Some groups developed a method to use AO in a reflection mode setup.12–15 Others16,17 investigated the decay of the modulation of the signal as function of the imaging depth and enhancement of AO with micro bubbles, which can be important in the development of new applications. 2.Acousto-Optic Tagging MechanismsLight can be modulated in a scattering medium using ultrasound by sixdifferent mechanisms. The relative influence of each of these mechanisms depends on the optical properties of the sample and light source and the acoustic properties of sample and transducer. The first two mechanisms (see Fig. 1) require light to have a sufficient coherence length. The first mechanism relies on the modulation of the optical path length. The scatterers inside the medium are assumed to oscillate with the US frequency at the US focus due to the pressure wave. The optical path length varies with the distance between the scatterers, and therefore the speckle pattern will vary with the applied US frequency.7 This mechanism is thus equivalent to Doppler scattering and relies on coherent light with a long coherence length to obtain a clear speckle pattern. The mean optical path length is, depending on the optical properties, in the order of 10 to 30 cm for an object with a thickness of 3 cm.18,19 The coherence length must be at least in the same order of magnitude. Leutz and Maret7 have developed a theory that partially modeled this mechanism. The theory is only valid when the mean free path is much greater than the light wavelength, and the particle displacement must be much smaller than the light wavelength. Unfortunately, the second mechanism is dominant in this case. Fig. 1Coherent modulation mechanisms: oscillation of scattering particles modulate the photon optical path length (1) and optical path length variation due to refractive index changes (2).  The second mechanism is based on refractive index variations due to the acoustic pressure wave. As a result the optical path lengths, and therefore the phases, are modulated. Consequently, the intensity of the resulting speckle pattern is also modulated.10 The relative influence of particle vibration and refractive index changes on the induced phase change depends on the optic and acoustic properties of the medium and the used waves.20–22 Properties such as scattering coefficient and the wavelengths of the ultrasound and probing light change the relative influence of the first and second mechanisms. The strengths of both mechanisms are comparable up to a critical point from where the acoustic wave vector becomes larger than a critical fraction of the mean free path of the photons and the second mechanism becomes dominant.20 The otherfourmechanisms (see Fig. 2) are incoherent phenomena. As a result of US associated local pressure variations, the medium is continuously locally compressed and decompressed. Local optical properties such as absorption (mechanism 3), position, and scattering cross-section of scattering particles (4 and 5) and the refractive index6 of the medium will oscillate with the US frequency due to variations in density.10 The four mechanisms each result in variation of the fluence distribution inside the object. In many situations the associated variation in signal strength is too low to be measured.10 However, Krishnan23 proposed a theory that fluorescent light is modulated by the gradient of the refractive index by an acoustic lens effect (mechanism 6). Kobayashi et al.24 showed the feasibility of detecting this modulated intensity in fluorescence. 3.Theoretical ModelingTo understand AO modulation, and to explore the relative importance of the above mechanisms for modulating the light, different theoretical models have been developed. Most models use the more classical approach of phase changes induced by ultrasound, as described by Secs. 3.2 and 3.3. A different approach used by Mahan et al.25 is more from a quantum mechanics perspective. Here the fraction of tagged and untagged photons is calculated (see Sec. 3.1). 3.1.Fraction of Tagged Light by Brillouin ScatteringMahan et al.25 used the mechanism of refractive index changes due to the ultrasound to model the tagged light. The periodic refractive index changes causes Brillouin scattering of the photon stream. A small fraction of these photons will scatter inelastic and are frequency shifted with the US frequency. The intensity of the tagged photon stream is a fraction of the untagged photon stream. They start by deriving an expression for the signal strength of the untagged photons. Step two is calculating the fraction for different geometries. For a slab with thickness where the ultrasound is uniformly distributed this fraction is given by: where is the volume of the ultrasound pulse, the anisotropy factor, the absorption coefficient the variation in scattering coefficient due to refractive index changes (tagging mechanism 2 and 5). This fraction of tagged photons is coupled to the signal strength for an AO measurement. The measured signal strength depends on this fraction and the type and quality of the setup. When this signal is compared with the noise, it can be decided whether there is enough signal for imaging purposes.3.2.Theoretical Predictions of Observable Optical Quantities During US ModulationThe ultrasound modulation of light has been modeled for its consequence for two observable aspects of speckle patterns: temporal fluctuations and reduction of speckle contrast, which are coupled to one another. The modulation of the speckle pattern formed at the detector is often calculated by using the temporal autocorrelation function of the electric field. The intensity of a speckle consists of a large DC component and a smaller component, the one in which we are interested, that varies in time with the US frequency. Leutz et al.7 and others10,20,21,26,27 expressed this autocorrelation function as: with the distribution function of paths with length through the sample and the electric field. The < > denote averaging over time. This equation is related to the speckle power spectrum through a Fourier transformation based on the Wiener-Khinchin theorem: where is relative to the optical frequency and thus equal to the frequency of the oscillating speckles or beat frequency of the light.10 Point-like scatterers are undergoing a collective motion due to the ultrasound and Brownian motion. The autocorrelation function length can be split in one part describing the exponential decay due to Brownian motion and a second part that describes the autocorrelation as a function of the periodic ultrasound wave. When both effects are assumed independent from the other then the properties of both factors can be explored separately.The scatterers in the medium may tend to diffuse due to the Brownian motion. The single particle relaxation time is given by where is the particle diffusion constant and the wave vector of the light. The autocorrelation of the electric field with a single path length will decay exponentially in time according to:7 where is the mean free path.This decay time limits the time in which an accurate AO measurement can be performed in most situations. The Brownian motion can be neglected for time scales in the order of the cycle time of the ultrasound.28 Wang20,21 investigated the contribution of phase modulation by refractive index changes and scatterer displacement induced by the ultrasound. He concluded that both effects have a similar contribution up to a critical point. When the mean free paths of the photons between two scattering events become small compared with the acoustic wavelength, the second mechanism becomes increasingly more important. This was verified with a Monte Carlo simulation.20 Sakadžić et al.26,29–31 and Wang20 developed an analytical solution for this autocorrelation function Eq. (2), mostly focusing on the first two mechanisms. For a single pathlength the contribution to the autocorrelation function is given by:20 where denotes the total phase shift of the light due to path length and refractive index variations and is thus a function of , (mechanism 1 and 2) of the object. After some lengthy algebra10,26 and the assumption of weak modulation, the modulation depth, defined as ratio of the intensity at the signal frequency and the unmodulated intensity,10 is found to be proportional to the acoustic amplitude squared.10 In general the maximum variation of the autocorrelation function will increase with increasing acoustic power and decrease with increasing US frequency while keeping the US power constant. Increasing the optical absorption coefficients will lead to a smaller variation according to:22,26 where the distance between the extrapolated slab boundaries, is the location of the isotropic light source, the term due to ultrasound influence, the term for Brownian motion, the absorption coefficient and the diffusion constant.The intensity and variation of the speckle contrast, which is related to the autocorrelation function, are derived by Zemp et al.27 The statistical properties of this speckle pattern are derived from the autocorrelation function. The first order statistics describe the time average intensity and is approximately equal to . The second order statistics describe the variation in speckle contrast. The variation is approximately This variation is a function of the average optical pathlength , the optical index of refraction , the magnitude of the optical wave vector , the acoustic pressure , the mass density of the medium , the ultrasound velocity , the elasto-optic coefficient which has a value of approximately 0.32 and the acoustic frequency . This equation is valid under the assumption of weak scattering i.e., where is the ultrasonic wave vector magnitude and is the transport mean free path. The model predicts a linear relation between the acoustic power and the speckle contrast, which is verified experimentally in Ref. 27. All these theories assume homogeneous acoustic waves, except for Sakadžić et al.29–31 in which localized acoustic waves were used.3.3.Monte Carlo SimulationsBesides the analytical solutions Monte Carlo (MC) simulations are used to gain more insight into the principles of AO. These models simulate photon distributions inside the medium and include scattering and absorption of the light. One or more of the tagging mechanisms can be implemented, and the refractive index and scatterer motion can be modulated. The results of measurements and analytical models are often compared and tested with MC simulation results.32–34 Wang20 and others33 developed and modified MC models for AO applications. Especially the model of Wang et al. is widely used in Biomed.Op. i.e.,35,36 and is supported by an analytical model.21,26,29,30 Leung et al.37 compared the speed of this model implemented on both central processing unit (CPU) and graphics processing unit (GPU, Nvidia GeForce 9800) with Compute Unified Device Architecture (CUDA). They found an increase in speed, depending on simulation settings and hardware, of a factor 72 for the CUDA implementation. 4.Detection of Tagged PhotonsA detection technique must be able to distinguish the tagged or modulated photons from the untagged or unmodulated photons to obtain information from the US focus. Longer integration times will lead to higher signal-to-noise ratios. However, speckle decorrelation alters the speckle pattern and destroys the correlation of this pattern between the start and end of the detection time. Sources of speckle decorrelation are small changes in the optical paths inside the object, i.e., Brownian motion of scatterers and blood flow or muscular activity in living tissues. This decorrelation diminishes the detectability of tagged photons. Developed detection techniques can be divided in time- and frequency domain techniques. 4.1.Time-Based MethodsWang et al.8 measured light modulated at a US frequency of 1 MHz with a photomultiplier. The intensity of a single speckle will oscillate with the US frequency of 1 MHz, and this frequency is observed by recording the light flux with the photomultiplier tube. They used a 1.1-mm aperture at 5-cm distance from the object and a photomultiplier tube at a distance of 10 cm from this aperture. The advantage of a photomultiplier tube is the speed and sensitivity, so the modulation of a speckle can be detected real time at the US frequency and well within the speckle decorrelation time. The disadvantage is the small detection surface, which in turn reduces the number of tagged photons that can be detected, leading to small signal-to-noise ratio due to the influence of shot noise. In a nutshell: increasing the number of speckle grains on the same single detector increases the random modulated signal standard deviation (signal of interest) as and the average power impinging the detector by . If the detection is shot noise limited (that is rather unlikely to happen) the noise is proportional to , and the signal-to-noise ratio is not increased by increasing the number of speckle grains on the detector. If the noise is linked to the laser fluctuations it is proportional to and the signal-to-noise ratio will decrease when increasing the number of speckle grains on the detector. A parallel speckle detection technique was developed by Leveque et al.38 Instead of a single detector element, a CCD camera is used in which the illumination pulses and the ultrasound are timed with a fixed phase delay. The system was designed to make speckle size comparable to the pixel size. The SNR is improved by averaging the signal from all CCD pixels, making it a larger detector surface. The major disadvantage of a CCD camera as a detector is the reduced frame rate, hence the intensity of a speckle cannot be followed in time at the US frequency. However, by recording the light intensity for different phases of the ultrasound, the modulated intensity and the unmodulated intensity can be estimated. This can be achieved by varying the delay between US and the start of the exposure of the camera. In the case of four-phase measurement the exposure time of the camera is up to one quarter of the US period time. The signal for each phase from Fig. 3 is given by: From these intensities the AC intensity and phase can be calculated using these relations: where is the modulated part of the intensity for a single pixel, the total integration time, and the phase of the acousto-optic signal. Li et al.39 showed similar relations for two and three phases.Fig. 3Integrated light for each of the four quarters (S1, S2, S3, and S4) of the US period for a single pixel where the curved line denotes the instantaneous light intensity of this pixel.18,38,40  Parallel speckle detection is an efficient technique for detecting modulated light. However, this detection method is sensitive tospeckle decorrelation, which lowers the SNR by lowering the signal and increasing the noise.18 Li et al.41 showed a laser speckle contrast detection scheme that is less sensitive for speckle decorrelation when short integration times are used. The speckle contrast is defined as the standard deviation of the intensity in the pattern divided by the average intensity of this pattern.42 Kothapalli et al.43 tested their Monte Carlo implementation and measured with a speckle contrast setup; they further investigated the linear relation between speckle contrast and the local scattering coefficient at the US focus and found a good agreement between simulation and experiment. 4.2.Interferometric-Based MethodsInstead of following the intensity of the speckles in time domain, it is possible to filter out the modulated light with interferometers. The Fabry-Perot interferometer and Mach-Zehnder based techniques are used to detect, or select, only the modulated light at the US frequency. By optically removing noninteresting frequencies, the SNR should be increased. Leutz et al.7 used a Fabry-Perot interferometer in combination with a photomultiplier tube to detect photons with a frequency shift of 2.17 and 27.3 MHz from a laser source with a wavelength of 514.5 nm. To resolve this relative small frequency difference, they used a FP etalon (mirror reflectivity: 99.3%) with a mirror separation distance of 15 cm, obtaining a resolution of 12 MHz. The disadvantage of this technique is the great loss of signal photons due to the small etendue (the product of the solid angle and area of an aperture) when pinholes are used to select a parallel light beam with a certain frequency. However long-cavity44 confocal Fabry-Perot interferometers are used, which have a high etendue. Double-pass confocal45 Fabry-Perot interferometers are also used to separate the faint spectral line of the tagged photons from the strong untagged spectral line. The heterodyne parallel speckle detection method adds a reference beam or local oscillator (LO) beam to the standard parallel speckle detection scheme,46–48 making it a Mach-Zehnder interferometer, as depicted in Fig 4. This technique is shot-noise limited when using a large heterodyne reference intensity. When the signal beam is in phase with the reference beam the intensity on the detector is given by:49 where is the detected intensity, is the intensity of the signal beam and the intensity of the reference beam; the last term in this equation is the heterodyne gain.Fig. 4Heterodyne parallel speckle detection, the light beam enters at the upper left beam splitter (BS) and illuminates the object. The ultrasound beam (US) is focused inside the object. The reference arm consists of twoprisms, two Bragg cells (BC), and a lens to expand the beam. Both arms are combined in the second beam splitter and the resulting interference pattern is detected by the CCD array.  The light in the sample arm is modulated as it propagates through the sample, and the reference arm is modulated with two acousto-optic frequency shifters (Bragg cells) or acousto-optic modulators. The speckle pattern from the sample interferes with the reference beam on the CCD camera, which is placed under a small tilt angle . The reference light with the modulated part of the sample generates a static speckle pattern, which can be detected by the CCD camera. Interference of the nonmodulated sample light with the reference light leads to a dynamic speckle pattern, which in the CCD image will be smeared out. The spatial frequency domain (-space) of the recorded interference pattern reveals the level of the shot noise, the speckle decorrelation noise, and the tagged photons in different regions, due to spatial filtering associated with tilt angle . The sensitivity of this technique is limited by the shot noise of the reference light46,47 and setup limitations such as dynamic range and sensitivity of the camera.From the four frames of the CCD array, representing the four phases of the reference beam, a four-phase complex signal can be calculated. This complex signal in -space shows interesting properties. The heterodyne signal forms a narrow band of spatial frequencies at a position determined by tilt angle (region A in Fig 5), the decorrelation noise is relatively slow, and its fringes consists of the lower spatial frequencies (region B and C). The shot noise is represented by region D. Fig. 5-space image (a) and column average of this image (b) with the regions: signal (A), decorrelation noise (B and C), and shot noise (D).46  For example, the laser light is modulated at 85 MHz up and 80 MHz down with the use of two acousto-optic modulators. For practical reasons, two modulators are used instead of one at 5 MHz; that is the difference of both used modulators. The laser light inside the sample is modulated in the focus of a US transducer at 5 MHz. This is known as single-phase detection; four-phase detection can be achieved by tuning one of the AO modulators slightly higher, 85.0000075 instead of 85 MHz. This way each next frame of the CCD array receives a reference beam with a phase shift of compared with the current frame assuming a frame rate of 30 frames per second. The advantage of using multiple-phase detection is the higher SNR because the DC component is canceled out. All frames of the one to four phases should be taken within the speckle decorrelation time, making one or two phase imaging the better choice where this decorrelation time is short. Atlan et al.48 give an equation to calculate the complex signal for an arbitrary number of phases. Another technique uses the same heterodyne setup with the addition of a photo refractive crystal (PRC) in front of the detector. The principle is to store intensity and phase information of the speckle pattern inside a hologram and readout this hologram with a CCD. The advantage of this self-adapting wave-front holography is a larger etendue than most CCDsand possibly a larger SNR. Bloningen et al.50,51 investigated the expected AO signal and phase shifts of the photons for photo-refractive-based detection by utilizing Monte Carlo simulations. They show that the average photon phase shift contains a DC phase shift, which is dominant over the usually used AC phase shift. This offers a possibility to compliment the AC data. The crystal consists of a photorefractive material and thus has a refractive index that depends on the light intensity. The two beams, signal and reference, illuminate the crystal. The two interfering beams construct a three-dimensional (3-D) intensity profile in the crystal thus writing, using the photo refractive principle, a 3-D grating or hologram in the crystal within the response time. Typical response times are 100 µs for a multiple quantum well crystal (850-nm excitation wavelength),520.3 to 100 ms for GaAs (1064 nm),47,53–58 less than 10 ms for SPS:Te (790 nm)59 and 150 ms for .51,60,61 Changes in the speckle pattern slower than this response time are not recorded, making the detection insensitive for slow speckle decorrelation. The photo-refractive effect selects only optical frequencies from the signal beam, which are close to the reference-beam frequency. During readout of the hologram, the reference beam is diffracted by the holographic grating. This way the wavefront of the reference beam is shaped in the signal wavefront, but now with a larger intensity. This constructed speckle pattern can be detected by a detector such as a CCD. Chi et al.62 describes this two wave mixing process in more detail. Gross et al.53 give a detailed description of detecting tagged light with a PRC. This self-adapting wavefront holography is a promising technique, but the typical response time is too slow for in vivo use where the speckle decorrelation times () are in general much shorter than the crystal response time ().57 4.3.Other MethodsSpectral hole burning (SHB) is another crystal-based technique developed by Li et al.57,63 where the PRC is replaced by a SHB crystal. This technique has also a large etendue and is insensitive for speckle decorrelation. The crystal acts as a narrow optic bandpass filter where most optical frequencies are absorbed and only one specific frequency band is transmitted. The reference beam burns a spectral hole in the crystal at the same frequency as the tagged photons. The crystal is an inhomogeneously broadened optical absorber that can be modeled as a two-level system. The spectral line width is typically sub-MHz when cryogenically cooled and depends on the intensity of the reference beam. During the burning process only the crystal ions inside the crystal that are sensitive for this specific optical frequency are excited from the ground state. This makes the crystal transparent for this optical frequency, the nontagged photons are absorbed by the crystal. After burning the spectral hole, the reference beam is switched off and the signal beam is switched on, the tagged photons can be detected by a photo detector such as a CCD. The cryogenic cooling () is the main disadvantage of this technique. 5.ResolutionThe lateral resolution of acousto-optic imaging is obtained by focusing the ultrasound, and its size is comparable with the width of the US focus when the weight of the unfocused part does not play a major role. The axial resolution is worse than the lateral resolution due to the elongated focus of the ultrasound transducer (Rayleigh length). The axial resolution can be improved in several ways by changing frequency, amplitude, or phase in time in order to get a resolution equivalent to the pulse-echo in US tomography. The first method that was implemented is the frequency sweep technique.64,65 In this method the ultrasound transducer generates a short chirped signal. The light along the acoustic axis is modulated with a different frequency for each depth. By using the Fourier transform on the detected signal, information in the axial direction is retrieved. Yao et al.65 combined this chirp technique with a parallel detection scheme. They also showed that this technique does not rely purely on ballistic light by using an obliquely incident laser beam. Wang et al.64 showed an axial resolution of approximately 1 mm;however, this resolution depends on the chirp rate. In chicken-breast tissue they achieved 4-mm resolution.65 Lesaffre et al.58 showed a different approach by making the phase of the US and the optical illumination random. Both use the same data set of typical 512 random phases with each of these phases set to either 0 or . This set of random phases has a typical period time 1 ms. The phase of the optical illumination is modulated with a delay relative to the modulation of the US. At a distance of times the speed of sound along the acoustic axis, both the optical illumination and US phase are correlated. Therefore only tagged photons from this position are detected using the heterodyne detection scheme with a photo refractive GaAs crystal. The resolution in the axial direction depends on the speed of sound and the time it takes to change phase, which in this case is () roughly 3 mm. Gross et al. give more theoretical background66 in regarding this technique. A third method to increase the axial resolution uses short US pulses.44,48,51,67 These pulses consist of a few US cycles and thus modulate the light only locally in the axial direction. The US pulse reaches the point of interest after time , where is the distance from the transducer and the point of interest and the speed of sound (SOS). At this time () the sample is illuminated with pulse duration , and the modulated photons are recorded. The minimally resolvable size in the axial direction depends linearly on the SOS and pulse duration, assuming a short enough light pulse. Achieving high resolution thus requires short US pulses. The smaller the pulse duration, the bigger the spread of acoustic energy in the frequency domain. Detection schemes, which are only sensitive for a single frequency, require a longer US burst and thus a smaller US bandwidth to optimize the SNR.67 Atlan et al.48 used an US burst of 3 µs and the axial resolution is 5 mm. Li et al.68 investigated the influence of amplitude modulated US on the speckle contrast in a parallel detection setup. In this case the US amplitude was modulated with a 250-Hz-to-16-KHz cosine envelope. They show that amplitude modulated US can outperform continuous wave US in signal strength. Weng69 investigated the relation between US pulse duration and amplitude on the AO signal and concluded that the imaging depth can be increased when reducing pulse duration and increasing the US peak amplitude. Above methods all describe a way to improve the axial resolution by shaping the acoustic wave. The lateral resolution, however, is achieved by focusing the US transducer on the volume of interest. A different approach is suggested by Kuchment70 where an unfocused US transducer is used. An unfocused transducer has spherical wavefronts in the far field. When the US transducer emits a small US wave train, a small circular shaped region is tagged. By repeating these measurements for different positions of the US transducer, a synthetic focus is constructed on the positions where these circular regions intersect. Another example of what could be seen as synthetic focusing is used by Li et al.71 Sakadžić et al.44 used tomography to achieve very high resolutions in the order of 100 µm. Let us underline that whatever is the technique that led to reduce the resolution it has to involve signal variation shorter than the decorrelation time. This is obviously realized for short pluses but must also be done for other approaches such as the chirpsor the random sequences. 6.Applications of Acousto-Optic Imaging6.1.Measuring Optical PropertiesWhile it is still unknown what the measured quantity is in AO, its signal probably holds information on the local fluence rate. Lev and Sfez12 showed the possibility of measuring the local fluence rate using AO between two optodes. This local fluence rate depends on position of illumination and detection and the optical properties distribution in the object such as the absorption coefficient. A map of the estimation of the optical absorption is obtained by scanning the US focus through the object and estimate the absorption coefficient for each position from the modulated fluence rate.42 The AO signal is affected not only by optical absorption and scattering in the US focus but also in the rest of the object. Therefore quantitative estimation of the absorption coefficient requires the number of tagged and untagged photons and an algorithm that solves the inversion problem as in DOT.30,33,54,72–74 Gunadi and Leung75 investigated the sensitivity of AO for the application of spectroscopy. From the spatial distribution of AO sensitivity they derived a penetration depth for AO of 14.8 mm for an intralipid solution with a µs’ of and absorption of µa of . The absorption coefficient is in most cases dependent of the wavelength of the used light source, making functional imaging possible. For instance, chromophores such as hemoglobin and oxy-hemoglobin have distinct absorption spectra. This creates the possibility of determining the oxygenation levels of blood in biological tissues.33 6.2.Acousto-Optic Modulated FluorescenceFluorescence is often used to label particles and cells and enables the study of biological processes on the molecular and cellular level. However, light scattering makes it difficult to determine the origin of the fluorescent light in vivo. Efforts similar to DOT have to be made to perform optical tomography with fluorescent light.76 Kobayashi et al.,24 Hall et al.,77 and Yuan et al.76,78–81 investigated techniques to modulate and thereby localize this fluorescent light in turbid media. The fluorescent light is noncoherent, and modulation has to come from modulation of optical properties of the sample. The US field causes variation in the density and, consequently, induces a gradient of the refractive index based upon the localized pressure variations in the medium. On these gradients the light is deflected, which leads to variations in photon density in the fluorophores (mechanism 6 in Fig. 2), therefore the intensity of the fluorescence is modulated. Also, the scattering coefficient is modulated (mechanism 5), which causes fluorescence intensity modulation by variation of the photon density distribution.24 Yuan et al.76,78–81 investigated the combination of fluorescence with AO and derived a mathematical model. They proposed two mechanisms that can explain the modulation of fluorescence. The first mechanism for low concentrations is similar to the explanation of Kobayashi et al.,24 the excitation light is modulated and thus also the fluorescent light. For high concentrations, they propose a modulation in quenching rate and thus in detected intensity. At high concentrations the variation in distance between fluorophores leads to variations in quenching, giving a modulation of fluorescence that is inverted compared to lower concentrations where quenching is absent. The signal strength found by Yuan80 shows a linear relation with the applied voltage on the ultrasound transducer, which is usually linear with the US pressure, and the signal was much weaker than found by Kobayashi et al. Yuan et al. used a photo-multiplier tube to detect the modulation of the fluorescence and found that this signal depends quadratic on the acoustic pressure. Hall et al.77 showed a parallel detection scheme to detect the modulation in fluorescence by modulating the gain of the CCD with the US frequency. The phase difference between the US and CCD gain modulation was 0 and 180 deg. 6.3.Acousto-Optic Assisted ElastograpyAO elastography is an imaging modality for quantifying mechanical properties. Kirkpatrick et al.82 stimulated tissue with a low frequency acoustic force (1 to 5 Hz), which induces a strain. The surface of the tissue, in their case the skin, will give a dynamic shift in the speckle pattern in the back-reflected laser light with this low frequency. The stiffer the material, the less shift in the speckle pattern is observed. Bossy et al.83 and Daoudi et al.84 used a different approach to measure the elasticity of a material by use of AO. A high-intensity US burst is focused into the object on the region of interest. Inside the focus a shear wave is generated that radiates away from the focal point with a speed of typically 1 to , which depends on the viscoelastic properties of the medium. This low speed causes a speckle decorrelation on ms time scale in transverse direction. This technique has a lateral resolution in the order of mm and is not limited to use at the surface. Li et al.85 showed that by using the acoustic radiation force the resolution of a measurement can be increased by 40% to 110%. Sing et al.86 used two transducers, which caused a beat and shear wave frequency of 250 Hz. This low frequency shear wave was detectable with a speckle contrast measurement. 6.4.Acousto-Optic Assisted Light Focusing in Turbid MediaXu et al.87 presented another detection technique called time-reversed ultrasonically encoded (TRUE) optical focusing based of a PRC used as a phase-conjugate mirror. The setup uses three arms: one signal arm where the object is located and two reference arms. The first reference arm is used for the creation of the hologram inside the PRC; the second illuminates the crystal from the opposite direction. By the hologram inside the crystal, the light is focused inside the object with the focal point inside the US focus region. This increases the local fluence at the US focus; in the future one can expect a significant improvement of the light level at the focus if the phase conjugate mirror exhibits a noticeable gain. This method makes AO the only technique that can create a guide star, which makes direct focusing of light possible in turbid media. Inside the US focus, this light is tagged and detected outside the medium. A second benefit from using this phase conjugate PRC setup is the improved spatial resolution with a factor of . 6.5.Ex Vivo and In Vivo ExperimentsVarious groups report measurements ex and in vivo with the use of AO.Kim et al.13 showed an image of chicken breast tissue with an embedded methylene-blue-dyed sentinel lymph node. Another ex vivo measurement on chicken breast is performed by Hisaka and Sasakura;88 they also used a reflection mode AO setup. Both experiments show the feasibility of a reflection mode AO setup on real tissue. Kothapalli and Wang89 embedded mouse and rat blood vessels in tissue mimicking phantom material at a depth of 3 mm and imaged these vessels with an AO microscopy setup. They also tested the AO microscopy setup on a phantom.90 These experiments were performed ex vivo and show the possibility of measurements on tissue and have thus the correct scattering and absorption coefficients. Recently Lai et al.91 showed an ex vivo measurement on an HIFU induced lesion and compared the result with B-mode ultrasound. They concluded that AO sensing can follow the formation of the induced lesion in real time, and for noncavitating lesions AO gives a more robust signal compared with B-mode ultrasound. Murray et al.92 further investigated the changes in AO response of ex vivo chicken breast while elicited by a high-intensity ultrasound field. They concluded that with the use of AO it is possible to probe in real time the formation of a HIFU lesion. In vivo experiments are performed by Lev et al.93,94 They demonstrate that ex vivo measurements suffer much less from speckle decorrelation than in vivo experiments. Further, they demonstrated the first AO tomography measurements on both mice and humans. 7.Discussion and OutlookTagged photons can be detected with several techniques. The photodetectors, which are fast enough to match the frequency of the US, have, in general, small detector surfaces. To avoid loss of SNR, averaging over multiple speckles must be avoided. These properties lead to a small etendue and thus a low count of tagged photons. CCD arrays can detect light from thousands of speckles in parallel and collect more light, resulting in an expected higher SNR. Unfortunately, these detectors are slow, therefore a lock-in detection is used, and only a few phases of the US are sampled. Compared to untagged photons, tagged photons have a shifted optical frequency. Several spectrometer-based techniques are described in literature and have the advantage of greater stability. Small fluctuations in power, wavelength, and phase are canceled out assuming a long coherence length of the laser light. By using heterodyne detection it is possible to distinguish between speckle decorrelation by Brownian motion, shot-noise level, and the signal strength. Heterodyne detection also amplifies the signal optically to rise the signal above the level of the untagged photons. PRC-based detection has a large etendue and the advantage of signal amplification. The disadvantage is the low response time of typical crystals, which makes it sensitive to speckle decorrelation. Spectral hole burning or confocal Fabry-Perot filters are insensitive to speckle decorrelation because they act as band pass filters and have the largest etendue.57 Crystal must be cryogenically cooled in order to achieve a narrow bandwidth in the MHz range, and Fabry-Perot need to be stabilized with a high precision feedback loop and isolated from mechanical vibrations. To achieve high resolution in lateral direction, an ultrasound transducer with a small focal spot size is required. To achieve good axial resolution the frequency, phase and/or amplitude of the ultrasound can be made time dependent. This way only in a small part of the column, defined by the US beam, the light is tagged with these specific properties. The main advantage of giving a short US burst (amplitude) is the high acoustic peak pressure and therefore large modulation of light. The advantage of giving a chirped US pulse is the amount of information that is received in a single measurement; instead of measuring a single point, information can be extracted along the line in the US propagation direction. The major challenges in in vivo AO applications are speckle decorrelation and low light levels. In general a detection method that detects as many tagged photons as possible is desired to obtain a good SNR. One strategy would be longer integration times; however, in vivo speckle decorrelation occurs on time scales of 1 ms. Most PRC have a response time orders of magnitude longer than 1 ms and are therefore not suitable for in vivo measurements. CCD-based techniques must acquire all light within the speckle decorrelation time, increasing shot noise and decreasing SNR. Spectral hole burning and Fabry-Perot interferometers are insensitive for speckle decorrelation and thus have none of these disadvantages; however, it is difficult to make sufficiently large etendue. Therefore these techniques are likely to be most suitable for in vivo imaging. Another more fundamental aspect in the introduction of acousto-Op. for in vivo application is the uncertainty regarding the exact information that is provided by AO. Although the spatial resolution of AO is potentially good, the property that it samples is related to the local fluence rate, which usually exhibits variations over a larger spatial scale. This aspect can be investigated using the new technologies that have been described in this review. AcknowledgmentsThis work is performed under grant 09NIG01 of the Foundation for Fundamental Research on Matter (FOM), which is part of the Netherlands Organisation for Scientific Research (NWO). ReferencesM. Heijblomet al.,
“Imaging tumor vascularization for detection and diagnosis of breast cancer,”
Techn. Canc. Re. Treat., 10
(6), 607
–623
(2011). Google Scholar
F. A. Duck, Physical Properties of Tissue, Academic Press, London
(1990). Google Scholar
C. G. A. HoelenF. F. M. de Mul,
“A new theoretical approach to photoacoustic signal generation,”
J. Acoust. Soc. Am., 106
(2), 695
–706
(1999). http://dx.doi.org/10.1121/1.427087 JASMAN 0001-4966 Google Scholar
H. F. Zhanget al.,
“Functional photoacoustic microscopy for high-resolution and noninvasive in vivo imaging,”
Nat. Biotechnol., 24
(7), 848
–851
(2006). http://dx.doi.org/10.1038/nbt1220 NABIF9 1087-0156 Google Scholar
S. Manoharet al.,
“The twente photoacoustic mammoscope: system overview and performance,”
Phys. Med. Biol., 50
(11), 2543
–2557
(2005). http://dx.doi.org/10.1088/0031-9155/50/11/007 PHMBA7 0031-9155 Google Scholar
F. A. MarksH. W. TomlinsonG. W. Brooksby,
“Comprehensive approach to breast cancer detection using light: photon localization by ultrasound modulation and tissue characterization by spectral discrimination,”
Proc. SPIE, 1888 500
–510
(1993). https://doi.org/DOI: 10.1117/12.154670 Google Scholar
W. LeutzG. Maret,
“Ultrasonic modulation of multiply scattered-light,”
Phys. B-Cond. Matt., 204
(1–4), 14
–19
(1995). http://dx.doi.org/10.1016/0921-4526(94)00238-Q PHYBE3 0921-4526 Google Scholar
L. H. WangS. L. JacquesX. M. Zhao,
“Continuous-wave ultrasonic modulation of scattered laser-light to image objects in turbid media,”
Optic. Lett., 20
(6), 629
–631
(1995). http://dx.doi.org/10.1364/OL.20.000629 OPLEDP 0146-9592 Google Scholar
L. H. V. Wang,
“Ultrasound-mediated biophotonic imaging: a review of acousto-optical tomography and photo-acoustic tomography,”
Disease Markers, 19
(2–3), 123
–138
(2003). DMARD3 0278-0240 Google Scholar
D. S. Elsonet al.,
“Ultrasound-mediated optical tomography: a review of current methods,”
Inter. Fo., 1
(4), 632
–648
(2011). Google Scholar
A. LevB. G. Sfez,
“Direct, noninvasive detection of photon density in turbid media,”
Optic. Lett., 27
(7), 473
–475
(2002). http://dx.doi.org/10.1364/OL.27.000473 OPLEDP 0146-9592 Google Scholar
C. Kimet al.,
“Ultrasound-modulated optical tomography in reflection mode with ring-shaped light illumination,”
J. Biomed. Optic., 14
(2), 024015
(2009). http://dx.doi.org/10.1117/1.3088224 JBOPFO 1083-3668 Google Scholar
A. LevZ. KotlerB. G. Sfez,
“Ultrasound tagged light imaging in turbid media in a reflectance geometry,”
Optic. Lett., 25
(6), 378
–380
(2000). http://dx.doi.org/10.1364/OL.25.000378 OPLEDP 0146-9592 Google Scholar
H. B. Fuet al.,
“Ultrasound-modulated optical tomography in reflective and coaxial configuration,”
Chinese Phys. Lett., 20
(12), 2165
–2168
(2003). http://dx.doi.org/10.1088/0256-307X/20/12/022 CPLEEU 0256-307X Google Scholar
E. Granotet al.,
“Detection of inhomogeneities with ultrasound tagging of light,”
J. Optical Soc. Am. A—Optic. Image Sci. Vis., 18
(8), 1962
–1967
(2001). http://dx.doi.org/10.1364/JOSAA.18.001962 JOAOD6 0740-3232 Google Scholar
G. YaoL. H. V. Wang,
“Theoretical and experimental studies of ultrasound-modulated optical tomography in biological tissue,”
Appl. Optic., 39
(4), 659
–664
(2000). http://dx.doi.org/10.1364/AO.39.000659 APOPAI 0003-6935 Google Scholar
S. Lévéque-Fort,
“Three-dimensional acousto-optic imaging in biological tissues with parallel signal processing,”
Appl. Optic., 40
(7), 1029
–1036
(2001). http://dx.doi.org/10.1364/AO.40.001029 APOPAI 0003-6935 Google Scholar
F. Martelli, Light Propagation Through Biological Tissue and Other Diffusive Media: Theory, Solutions, and Software, SPIE Press, Bellingham, Wash.
(2010). Google Scholar
L. H. V. Wang,
“Mechanisms of ultrasonic modulation of multiply scattered coherent light: a Monte Carlo model,”
Optic. Lett., 26
(15), 1191
–1193
(2001). http://dx.doi.org/10.1364/OL.26.001191 OPLEDP 0146-9592 Google Scholar
L. H. V. Wang,
“Mechanisms of ultrasonic modulation of multiply scattered coherent light: an analytic model,”
Phys. Rev. Lett., 8704
(4), 043903
(2001). https://doi.org/10.1103/PhysRevLett.87.043903 PRLTAO 0031-9007 Google Scholar
S. SakadzicL. V. Wang,
“Modulation of multiply scattered coherent light by ultrasonic pulses: an analytical model,”
Phys. Rev. E, 72
(3), 036620
(2005). http://dx.doi.org/10.1103/PhysRevE.72.036620 PLEEE8 1063-651X Google Scholar
K. B. Krishnanet al.,
“A theory for the ultrasonic modulation of incoherent light in turbid medium,”
Proc. SPIE, 6009 60090V
(2005). http://dx.doi.org/10.1117/12.630819 Google Scholar
M. Kobayashiet al.,
“Fluorescence tomography in turbid media based on acousto-optic modulation imaging,”
Appl. Phys. Lett., 89
(18), 181102
(2006). http://dx.doi.org/10.1063/1.2364600 APPLAB 0003-6951 Google Scholar
G. D. Mahanet al.,
“Ultrasonic tagging of light: theory,”
Proc. Natl. Acad. Sci. U. S. A., 95
(24), 14015
–14019
(1998). http://dx.doi.org/10.1073/pnas.95.24.14015 1091-6490 Google Scholar
S. SakadzicL. H. V. Wang,
“Ultrasonic modulation of multiply scattered coherent light: an analytical model for anisotropically scattering media,”
Phys. Rev. E, 66
(2),
(2002). http://dx.doi.org/10.1103/PhysRevE.66.026603 PLEEE8 1063-651X Google Scholar
R. ZempS. SakadzicL. V. Wang,
“Stochastic explanation of speckle contrast detection in ultrasound-modulated optical tomography,”
Phys. Rev. E, 73
(6), 061920
(2006). http://dx.doi.org/10.1103/PhysRevE.73.061920 PLEEE8 1063-651X Google Scholar
M. AllmarasW. Bangerth,
“Reconstructions in Ultrasound Modulated Optical Tomography,”
(2010). http://arxiv.org/abs/0910.2748v3 Google Scholar
S. SakadzicL. H. V. Wang,
“Correlation transfer equation for ultrasound-modulated multiply scattered light,”
Phys. Rev. E, 74
(3),
(2006). http://dx.doi.org/10.1103/PhysRevE.74.036618 PLEEE8 1063-651X Google Scholar
S. SakadzicL. H. V. Wang,
“Correlation transfer and diffusion of ultrasound-modulated multiply scattered light,”
Phys. Rev. Lett., 96
(16),
(2006). http://dx.doi.org/10.1103/PhysRevLett.96.163902 PRLTAO 0031-9007 Google Scholar
L. V. WangS. Sakadzic,
“Correlation transfer equation for multiply scattered light modulated by an ultrasonic pulse,”
J. Opt. Soc. Am. A—Optic. Image Sci. Vis., 24
(9), 2797
–2806
(2007). http://dx.doi.org/10.1364/JOSAA.24.002797 JOAOD6 0740-3232 Google Scholar
J. Lauferet al.,
“In vitro measurements of absolute blood oxygen saturation using pulsed near-infrared photoacoustic spectroscopy: accuracy and resolution,”
Phys. Med. Biol., 50
(18), 4409
–4428
(2005). http://dx.doi.org/10.1088/0031-9155/50/18/011 PHMBA7 0031-9155 Google Scholar
A. BratcheniaR. MolenaarR. P. H. Kooyman,
“Feasibility of quantitative determination of local optical absorbances in tissue-mimicking phantoms using acousto-optic sensing,”
Appl. Phys. Lett., 92
(11), 113901
(2008). http://dx.doi.org/10.1063/1.2898884 APPLAB 0003-6951 Google Scholar
M. S. Singhet al.,
“Assessment of ultrasound modulation of near infrared light on the quantification of scattering coefficient,”
Med. Phys., 37
(7), 3744
–3751
(2010). http://dx.doi.org/10.1118/1.3456441 MPHYA6 0094-2405 Google Scholar
J. M. ElazarO. Steshenko,
“Doppler effect’s contribution to ultrasonic modulation of multiply scattered coherent light: Monte Carlo modeling,”
Optic. Lett., 33
(2), 131
–133
(2008). http://dx.doi.org/10.1364/OL.33.000131 OPLEDP 0146-9592 Google Scholar
C. H. KimL. V. Wang,
“Multi-optical-wavelength ultrasound-modulated optical tomography: a phantom study,”
Optic. Lett., 32
(16), 2285
–2287
(2007). http://dx.doi.org/10.1364/OL.32.002285 OPLEDP 0146-9592 Google Scholar
T. S. LeungS. Powell,
“Fast Monte Carlo simulations of ultrasound-modulated light using a graphics processing unit,”
J. Biomed. Optic., 15
(5), 055007
(2010). http://dx.doi.org/10.1117/1.3495729 JBOPFO 1083-3668 Google Scholar
S. Levequeet al.,
“Ultrasonic tagging of photon paths in scattering media: parallel speckle modulation processing,”
Optic. Lett., 24
(3), 181
–183
(1999). http://dx.doi.org/10.1364/OL.24.000181 OPLEDP 0146-9592 Google Scholar
J. LieL. V. Wang,
“Methods for parallel-detection-based ultrasound-modulated optical tomography,”
Appl. Optic., 41
(10), 2079
–2084
(2002). http://dx.doi.org/10.1364/AO.41.002079 APOPAI 0003-6935 Google Scholar
J. Selbet al.,
“3-D acousto-optic modulated-speckle imaging in biological tissues,”
Comptes Rendus De L Academie Des Sciences Serie Iv Physique Astrophysique, 2
(8), 1213
–1225
(2001). Google Scholar
J. LiG. KuL. H. V. Wang,
“Ultrasound-modulated optical tomography of biological tissue by use of contrast of laser speckles,”
Appl. Optic., 41
(28), 6030
–6035
(2002). http://dx.doi.org/10.1364/AO.41.006030 APOPAI 0003-6935 Google Scholar
A. Bratcheniaet al.,
“Millimeter-resolution acousto-optic quantitative imaging in a tissue model system,”
J. Biomed. Optic., 14
(4), 034031
(2009). http://dx.doi.org/10.1117/1.3223332 JBOPFO 1083-3668 Google Scholar
S. R. Kothapalliet al.,
“Imaging optically scattering objects with ultrasound-modulated optical tomography,”
Optic. Lett., 32
(16), 2351
–2353
(2007). http://dx.doi.org/10.1364/OL.32.002351 OPLEDP 0146-9592 Google Scholar
S. SakadzicL. H. V. Wang,
“High-resolution ultrasound-modulated optical tomography in biological tissues,”
Optic. Lett., 29
(23), 2770
–2772
(2004). http://dx.doi.org/10.1364/OL.29.002770 OPLEDP 0146-9592 Google Scholar
G. RousseauA. BlouinJ. P. Monchalin,
“Ultrasound-modulated optical imaging using a high-power pulsed laser and a double-pass confocal Fabry-Perot interferometer,”
Optic. Lett., 34
(21), 3445
–3447
(2009). http://dx.doi.org/10.1364/OL.34.003445 OPLEDP 0146-9592 Google Scholar
M. GrossP. GoyM. Al-Koussa,
“Shot-noise detection of ultrasound-tagged photons in ultrasound-modulated optical imaging,”
Optic. Lett., 28
(24), 2482
–2484
(2003). http://dx.doi.org/10.1364/OL.28.002482 OPLEDP 0146-9592 Google Scholar
M. Grosset al.,
“Detection of the tagged or untagged photons in acousto-optic imaging of thick highly scattering media by photorefractive adaptive holography,”
Euro. Phys. J. E, 28
(2), 173
–182
(2009). http://dx.doi.org/10.1140/epje/i2008-10408-2 EPJSFH 1292-8941 Google Scholar
M. Atlanet al.,
“Pulsed acousto-optic imaging in dynamic scattering media with heterodyne parallel speckle detection,”
Optic. Lett., 30
(11), 1360
–1362
(2005). http://dx.doi.org/10.1364/OL.30.001360 OPLEDP 0146-9592 Google Scholar
K. Creath,
“Phase-shifting speckle interferometry,”
Appl. Optic., 24
(18), 3053
–3058
(1985). http://dx.doi.org/10.1364/AO.24.003053 APOPAI 0003-6935 Google Scholar
F. J. Blonigenet al.,
“Computations of the acoustically induced phase shifts of optical paths in acoustophotonic imaging with photorefractive-based detection,”
Appl. Optic., 44
(18), 3735
–3746
(2005). http://dx.doi.org/10.1364/AO.44.003735 APOPAI 0003-6935 Google Scholar
T. W. Murrayet al.,
“Detection of ultrasound-modulated photons in diffuse media using the photorefractive effect,”
Optic. Lett., 29
(21), 2509
–2511
(2004). http://dx.doi.org/10.1364/OL.29.002509 OPLEDP 0146-9592 Google Scholar
M. Tzirakiet al.,
“Short-coherence photorefractive holography in multiple-quantum-well devices using light-emitting diodes,”
Appl. Phys. Lett., 75
(10), 1363
–1365
(1999). http://dx.doi.org/10.1063/1.124694 APPLAB 0003-6951 Google Scholar
M. Grosset al.,
“Theoretical description of the photorefractive detection of the ultrasound modulated photons in scattering media,”
Optic. Ex., 13
(18), 7097
–7112
(2005). http://dx.doi.org/10.1364/OPEX.13.007097 OPEXFF 1094-4087 Google Scholar
P. X. LaiR. A. RoyT. W. Murray,
“Quantitative characterization of turbid media using pressure contrast acousto-optic imaging,”
Optic. Lett., 34
(18), 2850
–2852
(2009). http://dx.doi.org/10.1364/OL.34.002850 OPLEDP 0146-9592 Google Scholar
F. Ramazet al.,
“Photorefractive detection of tagged photons in ultrasound modulated optical tomography of thick biological tissues,”
Optic. Ex., 12
(22), 5469
–5474
(2004). http://dx.doi.org/10.1364/OPEX.12.005469 OPEXFF 1094-4087 Google Scholar
G. RousseauA. BlouinJ. P. Monchalin,
“Ultrasound-modulated optical imaging using a powerful long pulse laser,”
Optic. Ex., 16
(17), 12577
–12590
(2008). http://dx.doi.org/10.1364/OE.16.012577 OPEXFF 1094-4087 Google Scholar
Y. Z. Liet al.,
“Pulsed ultrasound-modulated optical tomography using spectral-hole burning as a narrowband spectral filter,”
Appl. Phys. Lett., 93
(1), 011111
(2008). http://dx.doi.org/10.1063/1.2952489 APPLAB 0003-6951 Google Scholar
M. Lesaffreet al.,
“Acousto-optical coherence tomography using random phase jumps on ultrasound and light,”
Optic. Ex., 17
(20), 18211
–18218
(2009). http://dx.doi.org/10.1364/OE.17.018211 OPEXFF 1094-4087 Google Scholar
S. Farahiet al.,
“Photorefractive acousto-optic imaging in thick scattering media at 790 nm with a Sn2P2S6:Te crystal,”
Optic. Lett., 35
(11), 1798
–1800
(2010). http://dx.doi.org/10.1364/OL.35.001798 OPLEDP 0146-9592 Google Scholar
E. Bossyet al.,
“Fusion of conventional ultrasound imaging and acousto-optic sensing by use of a standard pulsed-ultrasound scanner,”
Optic. Lett., 30
(7), 744
–746
(2005). http://dx.doi.org/10.1364/OL.30.000744 OPLEDP 0146-9592 Google Scholar
L. Suiet al.,
“Imaging in diffuse media with pulsed-ultrasound-modulated light and the photorefractive effect,”
Appl. Optic., 44
(19), 4041
–4048
(2005). http://dx.doi.org/10.1364/AO.44.004041 APOPAI 0003-6935 Google Scholar
M. J. ChiJ. P. HuignardP. M. Petersen,
“A general theory of two-wave mixing in nonlinear media,”
J. Opt. Soc. Am. B-Opt. Phys., 26
(8), 1578
–1584
(2009). http://dx.doi.org/10.1364/JOSAB.26.001578 JOBPDE 0740-3224 Google Scholar
Y. Z. Liet al.,
“Detection of ultrasound-modulated diffuse photons using spectral-hole burning,”
Optic. Ex., 16
(19), 14862
–14874
(2008). http://dx.doi.org/10.1364/OE.16.014862 OPEXFF 1094-4087 Google Scholar
L. H. V. WangG. Ku,
“Frequency-swept ultrasound-modulated optical tomography of scattering media,”
Optic. Lett., 23
(12), 975
–977
(1998). http://dx.doi.org/10.1364/OL.23.000975 OPLEDP 0146-9592 Google Scholar
G. YaoS. L. JiaoL. V. Wang,
“Frequency-swept ultrasound-modulated optical tomography in biological tissue by use of parallel detection,”
Optic. Lett., 25
(10), 734
–736
(2000). http://dx.doi.org/10.1364/OL.25.000734 OPLEDP 0146-9592 Google Scholar
M. Grosset al.,
“Theoretical study of acousto-optical coherence tomography using random phase jumps on ultrasound and light,”
J. Opt. Soc. Am. A-Optic. Image Sci. Vis., 28
(7), 1436
–1444
(2011). http://dx.doi.org/10.1364/JOSAA.28.001436 JOAOD6 0740-3232 Google Scholar
A. LevB. G. Sfez,
“Pulsed ultrasound-modulated light tomography,”
Optic. Lett., 28
(17), 1549
–1551
(2003). http://dx.doi.org/10.1364/OL.28.001549 OPLEDP 0146-9592 Google Scholar
R. Liet al.,
“Parallel detection of amplitude-modulated, ultrasound-modulated optical signals,”
Optic. Lett., 35
(15), 2633
–2635
(2010). http://dx.doi.org/10.1364/OL.35.002633 OPLEDP 0146-9592 Google Scholar
C. C. Weng,
“Noninvasive determination of optical properties of scattering media,”
Euro. Phys. J. App. Phys., 50
(3), 31401
(2010). http://dx.doi.org/10.1051/epjap/2010057 EPAPFV 1286-0050 Google Scholar
P. KuchmentL. Kunyansky,
“Synthetic focusing in ultrasound modulated tomography,”
In. Probl. Imag., 4
(4), 665
–673
(2010). http://dx.doi.org/10.3934/ipi 1930-8337 Google Scholar
J. LiL. H. V. Wang,
“Ultrasound-modulated optical computed tomography of biological tissues,”
Appl. Phys. Lett., 84
(9), 1597
–1599
(2004). http://dx.doi.org/10.1063/1.1651330 APPLAB 0003-6951 Google Scholar
G. BalJ. C. Schotland,
“Inverse scattering and acousto-optic imaging,”
Phys. Rev. Lett., 104
(4), 043902
(2010). http://dx.doi.org/10.1103/PhysRevLett.104.043902 PRLTAO 0031-9007 Google Scholar
A. Bratcheniaet al.,
“Acousto-optic-assisted diffuse optical tomography,”
Optic. Lett., 36
(9), 1539
–1541
(2011). http://dx.doi.org/10.1364/OL.36.001539 OPLEDP 0146-9592 Google Scholar
A. BratcheniaR. MolenaarR. Kooyman,
“Towards quantitative acousto-optic imaging in tissue,”
Laser Phys., 21
(3), 1
–7
(2011). DOI: http://dx.doi.org/10.1134/s1054660x11050033 LAPHEJ 1054-660X Google Scholar
S. GunadiT. S. Leung,
“Spatial sensitivity of acousto-optic and optical near-infrared spectroscopy sensing measurements,”
J. Biomed. Optic., 16
(12), 127005
(2011). http://dx.doi.org/10.1117/1.3660315 JBOPFO 1083-3668 Google Scholar
B. H. YuanJ. GamelinQ. Zhu,
“Mechanisms of the ultrasonic modulation of fluorescence in turbid media,”
J. Appl. Phys., 104
(10), 103102
(2008). http://dx.doi.org/10.1063/1.3021088 JAPIAU 0021-8979 Google Scholar
D. J. HallU. SunarS. Farshchi-Heydari,
“Quadrature detection of ultrasound-modulated photons with a gain-modulated, image-intensified, CCD camera,”
Open Optic. J., 2
(1), 75
–78
(2008). http://dx.doi.org/10.2174/1874328500802010075 1874-2432 Google Scholar
B. H. Yuan,
“Ultrasound-modulated fluorescence based on a fluorophore-quencher-labeled microbubble system,”
J. Biomed. Optic., 14
(2), 024043
(2009). http://dx.doi.org/10.1117/1.3120493 JBOPFO 1083-3668 Google Scholar
B. H. Yuan,
“Sensitivity of fluorophore-quencher labeled microbubbles to externally applied static pressure,”
Med. Phys., 36
(8), 3455
–3469
(2009). http://dx.doi.org/10.1118/1.3158734 MPHYA6 0094-2405 Google Scholar
B. H. YuanY. A. Liu,
“Ultrasound-modulated fluorescence from rhodamine B aqueous solution,”
J. Biomed. Optic., 15
(2), 021321
(2010). http://dx.doi.org/10.1117/1.3333546 JBOPFO 1083-3668 Google Scholar
B. H. Yuanet al.,
“Microbubble-enhanced ultrasound-modulated fluorescence in a turbid medium,”
Appl. Phys. Lett., 95
(18), 181113
(2009). http://dx.doi.org/10.1063/1.3262959 APPLAB 0003-6951 Google Scholar
S. J. Kirkpatricket al.,
“Imaging the mechanical stiffness of skin lesions by in vivo acousto-optical elastography,”
Optic. Ex., 14
(21), 9770
–9779
(2006). http://dx.doi.org/10.1364/OE.14.009770 OPEXFF 1094-4087 Google Scholar
E. Bossyet al.,
“Transient optoelastography in optically diffusive media,”
Appl. Phys. Lett., 90
(17), 174111
(2007). http://dx.doi.org/10.1063/1.2733604 APPLAB 0003-6951 Google Scholar
K. DaoudiA. C. BoccaraE. Bossy,
“Detection and discrimination of optical absorption and shear stiffness at depth in tissue-mimicking phantoms by transient optoelastography,”
Appl. Phys. Lett., 94
(15), 154103
(2009). http://dx.doi.org/10.1063/1.3120552 APPLAB 0003-6951 Google Scholar
R. Liet al.,
“Effects of acoustic radiation force and shear waves for absorption and stiffness sensing in ultrasound modulated optical tomography,”
Optic. Ex., 19
(8), 7299
–7311
(2011). http://dx.doi.org/10.1364/OE.19.007299 OPEXFF 1094-4087 Google Scholar
M. S. SinghK. RajanR. M. Vasu,
“Estimation of elasticity map of soft biological tissue mimicking phantom using laser speckle contrast analysis,”
J. Appl. Phys., 109
(10), 104704
(2011). http://dx.doi.org/10.1063/1.3592352 JAPIAU 0021-8979 Google Scholar
X. XuH. LiuL. V. Wang,
“Time-reversed ultrasonically encoded optical focusing into scattering media,”
Nat. Photon., 5
(3), 154
–457
(2011). http://dx.doi.org/10.1038/nphoton.2010.306 1749-4885 Google Scholar
M. HisakaY. Sasakura,
“Light scattering characteristics of biological tissues in coaxial ultrasound-modulated optical tomography,”
Jap. J. Appl. Phys., 48
(6), 067002
(2009). http://dx.doi.org/10.1143/JJAP.48.067002 JJAPA5 0021-4922 Google Scholar
S. R. KothapalliL. H. V. Wang,
“Ex vivo blood vessel imaging using ultrasound-modulated optical microscopy,”
J. Biomed. Optic., 14
(1), 014015
(2009). http://dx.doi.org/10.1117/1.3076191 JBOPFO 1083-3668 Google Scholar
S. R. KothapalliL. H. V. Wang,
“Ultrasound-modulated optical microscopy,”
J. Biomed. Optic., 13
(5), 054046
(2008). http://dx.doi.org/10.1117/1.2983671 JBOPFO 1083-3668 Google Scholar
P. X. Laiet al.,
“Real-time monitoring of high-intensity focused ultrasound lesion formation using acousto-optic sensing,”
Ultrasound Med. Biol., 37
(2), 239
–252
(2011). http://dx.doi.org/10.1016/j.ultrasmedbio.2010.11.004 USMBA3 0301-5629 Google Scholar
T. MurrayP. LaiR. Roy,
“Measuring tissue properties and monitoring therapeutic responses using acousto-optic imaging,”
Ann. Biomed. Eng., 40
(2), 474
–485
(2012). ABMECF 0090-6964 Google Scholar
A. Levet al.,
“Ultrasound-modulated light tomography assessment of osteoporosis,”
Optic. Lett., 30
(13), 1692
–1694
(2005). http://dx.doi.org/10.1364/OL.30.001692 OPLEDP 0146-9592 Google Scholar
A. LevB. Sfez,
“In vivo demonstration of the ultrasound-modulated light technique,”
J. Opt. Soc. Am. A-Opt. Image Sci. Vis., 20
(12), 2347
–2354
(2003). http://dx.doi.org/10.1364/JOSAA.20.002347 JOAOD6 0740-3232 Google Scholar
|