|
|
|
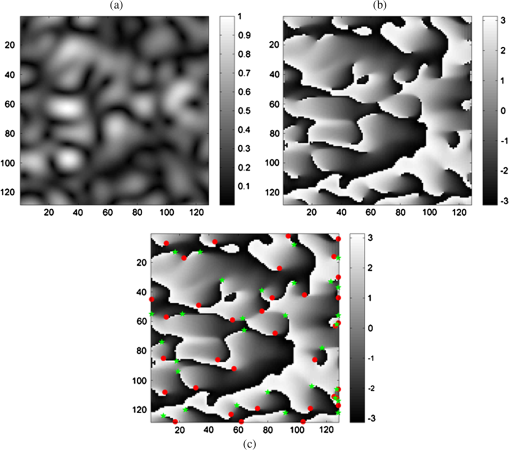
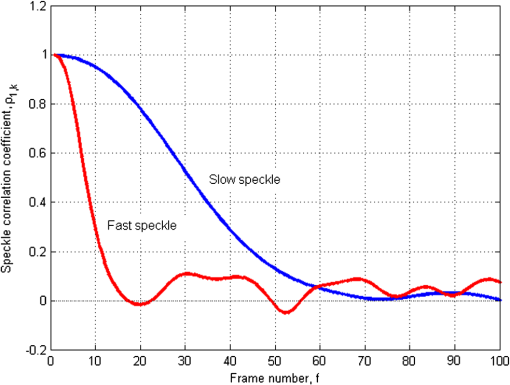
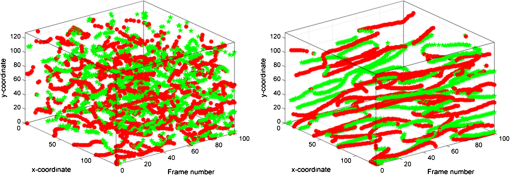
Speckle fields arising from scattering media such as biological tissue contain locations of zero intensity and undefined phase. The phase in the immediate vicinity of these singular points rotates through a full radians along a circular path surrounding these points. This spiral behavior of the phase values has lead to these singular points being referred to as optical vortices. Optical vortices may be described in terms of topological charge with each vortex typically possessing a topological charge of , depending upon the direction of rotation of the phase values;1,2 however, higher order charges are possible. As a direct outcome of the principle of conservation of charge, vortices only appear in pairs, with one member of the pair possessing a topological charge of and the other pair member possessing a topological charge of . This further implies that optical vortices can only be created and destroyed in pairs. As the scattering particles in the dynamic media move, the phase in the scattered field, and therefore the locations of the optical vortices, also change in a related fashion. The behavior of optical vortices and beams that contain optical vortices has received much attention lately.2–4 Much of this attention has focused on the density and behavior of the optical vortices as the field propagates through a turbulent atmosphere.2,4 Sendra et al.5 evaluated vortex behavior in dynamic speckle images, and pointed to the biological and industrial applications of analyzing vortex activity. They note there is a strong relationship between the motion of a scattering diffuser and the resultant motion of the optical vortices in the observed dynamic speckle pattern. The apparent robustness of optical vortices combined with the observation that vortices in a dynamic, stochastic optical field move in a manner that correlates with the motion of scattering particles (or medium) implies that optical vortex behavior may be used as a surrogate for understanding the dynamic behavior of scattering media. Particular applications in biomedicine, where vortex analysis may be of use, include investigating the dynamic behavior of scattering suspensions, particle sizing, monitoring cellular activity, and microcirculation studies, for example. The purpose of this letter is to demonstrate one approach to studying optical vortex behavior in simulated speckle intensity patterns that exhibit dynamic behavior similar to that observed when coherent light is scattered by biological tissues. To investigate the spatio-temporal behavior of optical vortices in dynamic speckle patterns, we generated sequences of band-limited dynamic speckle patterns in the Matlab environment using the numerical method we described in an earlier publication.6 Using this approach, we were able to generate fully developed, dynamic speckle patterns with very well-controlled first and second order statistics, and also with prescribed decorrelation behavior. Following the generation of the speckle sequences, the pseudo-phase 7 of the speckle patterns was generated using a two-dimensional (2-D) Hilbert transformation of the speckle patterns. This representation of is not unique, and an entirely different representation of the pseudo-phase can be generated if, for example, one were to employ a 2-D Fourier transformation in place of the Hilbert transformation. This is the classic phase-retrieval problem. Regardless of the numerical method used to generate the pseudo-phase, the operation simply exploits information already present in the signal without adding any new information.5 Once a 2-D representation of is generated, the singular points which identify the optical vortices can be located. These points then can be tracked as the speckle pattern dynamically evolves. We begin our formal discussion of the problem by noting that the complex representation of an optical field and its relationship to the intensity image is given by where the phasor amplitude of the field, , is itself a complex-valued function of space. The local true phase of the field is defined as usual as . To generate a 2-D representation of the pseudo-phase from we use a Hilbert transform in two dimensions, such that andThe phase singularities are defined in terms of : where is the local phase gradient, and the contour integral is taken over path on a closed loop around the vortex. It is clear that everywhere is differentiable, except at the singularity where the phase is undefined. Since is a continuous function, and has continuous first derivatives, by Stokes theorem we can see that where is a disc of radius enclosing the circular path over which is evaluated.8,9 This formulation suggests the locations of the optical vortices can be determined efficiently through a series of convolution operations: whereand is the convolution operator. Figure 1(a)–1(c) displays a numerically synthesized speckle pattern, its pseudo-phase representation, and the pseudo-phase representation with the optical vortices indicated by the superimposed stars and circles, respectively. Here, the vortices with positive topological charge are indicated by green stars and those with a negative topological charge by red circles.Fig. 1Example of a band-limited numerically generated speckle pattern (a), its pseudo-phase representation (b), and the pseudo-phase representation with the positively charged (green stars) and negatively charged (red circles) optical vortices identified (c).  Two sequences of 100 dynamic speckle patterns each were generated numerically. These speckle sequences displayed temporal decorrelation behavior, as shown in Fig. 2. From this figure, we see that both sequences exhibited Gaussian decorrelation behavior, but with drastically different characteristic times. The ‘fast’ sequence was defined by a time constant of frames, while the ‘slow’ sequence was characterized by a longer time constant frames. For both sequences, pseudo-phase representations were generated for each frame, and the locations of the vortices identified. These locations were then plotted in , where is frame number in the sequence. Following the convention of Fig. 1(c), the positively charged vortices were plotted in green stars, and the negatively charge vortices were plotted in red circles. Fig. 2Autocorrelation functions of the rapidly decorrelating speckle sequence versus the more slowly decorrelating speckle sequence used in this study.  The results of this operation are shown in Fig. 3(a) and 3(b). Several observations can be made regarding these figures. A key observation is the vortices are robust. That is, individual vortices persist through at least several frames, even in the rapidly decorrelating speckle example. The locations of the individual vortices over several frames trace a path, or a vortex trail. In the rapidly decorrelating speckle sequence, the vortex trails are relatively short and tortuous [Fig. 3(a)]; however, in the slowly varying sequence, the vortex trails are quite long, and trace a much straighter path [Fig. 3(b)]. It is clear that in the limit of a truly static speckle sequence, the vortices would maintain their positions through all frames . Careful examination of Fig. 3(a) and 3(b) also reveals locations where positively and negatively charged optical vortices annihilate each other. Elsewhere, new vortices are formed. These events always occur in pairs (i.e., both a positively and a negatively charged vortex is either destroyed or created), and arise because of the conservation of charge principle.4 Fig. 3Three-dimensional representation of the vortex trails for the rapidly decorrelating speckle sequence (a), and the more slowly decorrelating speckle sequence (b). The green stars represent the positively charged vortices and the red circles represent the negatively charged vortices.  In an actual, physical setting, the motion of the speckles arising from scatter from biological tissues arises from numerous sources, including the random motion of cellular activity, and from the more-ordered motion of red blood cells, for example. We may generalize and simply say that motion in these speckle patterns is from biological activity. From this discussion, it becomes apparent that the spatio-temporal behavior of optical vortex trails is an indicator of biological activity, and specific imaging configurations and experiments could be designed to focus on one particular type of motion. For example, one could coherently image cell sheets, and use the above vortex analysis to quantify cellular metabolic activity. Alternatively, it is feasible that one could coherently image the microcirculation, and use vortex analysis to study microcirculatory flow. ReferencesM. S. Soskinet al.,
“Topological charge and angular momentum of light beams carrying optical vortices,”
Phys. Rev. A, 56
(5), 4064
–4075
(1997). http://dx.doi.org/10.1103/PhysRevA.56.4064 PLRAAN 1050-2947 Google Scholar
M. ChenC. DaintyF. S. Roux,
“Speckle evolution with multiple steps of least-squares phase removal,”
Phys. Rev. A, 84 023846
(2011). http://dx.doi.org/10.1103/PhysRevA.84.023846 PLRAAN 1050-2947 Google Scholar
G. H. Kimet al.,
“Propagation dynamics of optical vortices with anisotropic phase profiles,”
J. Opt. Soc. Am. B, 20
(2), 351
–359
(2003). http://dx.doi.org/10.1364/JOSAB.20.000351 JOBPDE 0740-3224 Google Scholar
G. GburR. K. Tyson,
“Vortex beam propagation through atmospheric turbulence and topological charge conservation,”
J. Opt. Soc. Am. A, 25
(1), 225
–230
(2008). http://dx.doi.org/10.1364/JOSAA.25.000225 JOAOD6 0740-3232 Google Scholar
G. H. Sendraet al.,
“Vortex analysis in dynamic speckle images,”
J. Opt. Soc. Am. A, 26
(12), 2634
–2639
(2009). http://dx.doi.org/10.1364/JOSAA.26.002634 JOAOD6 0740-3232 Google Scholar
D. D. DuncanS. J. Kirkpatrick,
“The copula: a tool for simulating speckle dynamics,”
J. Opt. Soc. Am. A, 25
(1), 231
–238
(2008). http://dx.doi.org/10.1364/JOSAA.25.000231 JOAOD6 0740-3232 Google Scholar
W. Wanget al.,
“Optical vortex metrology for nanometric speckle displacements,”
Opt. Express, 14
(1), 120
–127
(2006). http://dx.doi.org/10.1364/OPEX.14.000120 OPEXFF 1094-4087 Google Scholar
M. A. Brayet al.,
“Experimental and theoretical analysis of phase singularity dynamics in cardiac tissue,”
J. Cardiovasc. Electrophysiol., 12
(6), 716
–722
(2001). http://dx.doi.org/10.1046/j.1540-8167.2001.00716.x JCELE2 1045-3873 Google Scholar
E. G. AbramochkinV. G. Volostnikov,
“Relationship between two-dimensional intensity and phase in a Fresnel diffraction zone,”
Opt. Commun., 74
(3–4), 144
–148
(1989). http://dx.doi.org/10.1016/0030-4018(89)90337-4 OPCOB8 0030-4018 Google Scholar
|

