|
|
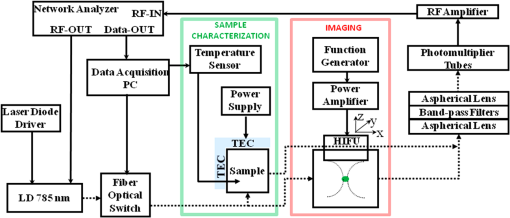
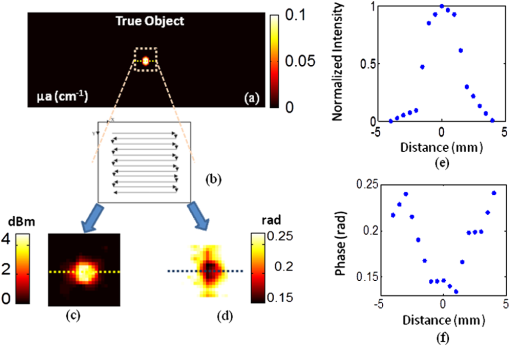
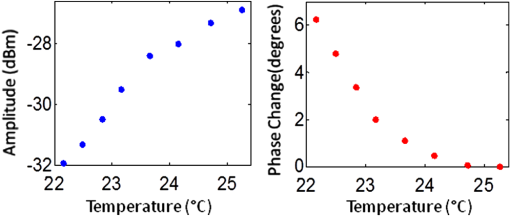
1.IntroductionFluorescence imaging is becoming an important molecular imaging tool to identify biomarker distributions in vivo.1–5 It can potentially play an important role in preclinical and clinical studies because of its high sensitivity to exogenous contrast agent. There are essentially two fluorescence parameters that can be spatially resolved with this technique, namely fluorescence concentration and lifetime. Most fluorescence imaging systems, especially commercial ones, focus on the measurement of the fluorophore concentration alone. On the other hand, fluorescence lifetime imaging holds promise in investigating the micro-environment of a lesion as demonstrated in the fluorescence lifetime imaging microscope.6–8 To resolve the lifetime information, a time-dependent measurement technique such as a frequency-domain or a time-domain system is required. Recently, there has been a great interest in developing fluorescence imaging systems based on lifetime contrast.9–11 Despite the exciting development of highly sensitive and versatile fluorescence probes, the main barrier in widespread use of fluorescence imaging in vivo, including in tomographic mode, is the low spatial resolution caused by strong tissue scattering. The recovered fluorescence parameters highly depend on the size and depth of the fluorescence source. For that reason, a fluorescence imaging system that can resolve both fluorescence concentration and lifetime with high resolution in deep tissue is highly desired. Recently, temperature-sensitive fluorescence contrast agent has been reported with use of indocyanine green (ICG)-loaded pluronic nanocapsules.12,13 As the temperature changes, the interiors of nanocapsules change their hydrophobicity/hydrophilicity, which in turn changes the quantum efficiency of the loaded ICG. It has been reported that fluorescence lifetime is also sensitive to the solvent polarity.14 Therefore, it is expected that the lifetime of pluronic-ICG is also responsive to temperature change. Such temperature dependence of these contrast agents provides a major opportunity to overcome the spatial resolution limitation of conventional fluorescence imaging by using temperature modulation. In this letter, we demonstrate a temperature-modulated fluorescence tomography (TM-FT) system, which utilizes the temperature dependence of ICG-loaded pluronic nanocapsules and achieves fluorescence imaging at focused ultrasound resolution. The medium is irradiated by both excitation light and a high intensity focused ultrasound (HIFU) wave. The HIFU scans through the medium with low power and sequentially generates a hot spot to elevate the temperature of a small area a few degrees. When the temperature-sensitive fluorescence agent presents within a HIFU focal zone, the local temperature increase in turn changes the fluorescence quantum efficiency and lifetime inside the focal zone. We have previously demonstrated a similar system that only monitors the change in quantum efficiency;15 however, the TM-FT system presented here operates in the frequency domain, which is essential for lifetime imaging. In this work, we experimentally demonstrate imaging fluorescence objects in scattering tissue through several centimeters based on both fluorescence intensity and lifetime contrast, yet both parameters can be resolved at focused ultrasound resolution ( a millimeter) with our TM-FT system. 2.MethodA temperature-sensitive fluorescence probe was prepared by encapsulating ICG in polymeric micelles (Pluronic-127). ICG is an FDA-approved near-infrared (NIR) dye that has potential for tumor detection. However, because of it thermal instability, its current applications are limited to monitoring blood flow. Pluronic-127 polymers are FDA-approved block copolymers of ethylene and propylene oxide. These polymers have shown thermo-reversible behavior and are reported as promising drug carriers for cancer therapy.16,17 Our collaborators from InnoSense LLC have produced ICG-loaded pluronic nanocapsules that respond to temperature modulation. Nanocapsules of pluronic-ICG were prepared with a micro-emulsification process. The nanocapsules were isolated by centrifugation and washed with deionized water. Besides the strong temperature dependence of the agent, ICG-loaded pluronic nanocapsules have improved fluorescence stability, thermal stability, and bio-conjugation ability compared to free ICG.18,19 2.1.Characterization of the ICG-Loaded Pluronic NanocapsulesA frequency-domain system has been constructed to measure both fluorescence intensity and lifetime as a function of temperature. As a first step to verify the responsiveness of pluronic-ICG to temperature change, the sample is heated and cooled in a controlled manner by a thermoelectric cooler. The change in fluorescence signal is recorded, together with the temperature of the contrast agent solution. A diagram of the measurement system and experimental setup is shown in Fig. 1. The pluronic-ICG is placed in a 1-cm-wide cuvette, while the source and detector fibers are placed at 90 deg with respect to each other for fluorescence measurements. A custom metal holder is used to fix the cuvette, and the TEC is attached on two sides of the metal plate as shown in Fig. 1. A maximum 3 A of current is provided to the TEC through a power supply. A fiber-optic temperature sensor (FTC-DIN-ST-GE, Photon Control, Inc. British Columbia, Canada) is inserted in the cuvette to monitor the sample temperature. A 785-nm laser diode (80 mW, Thorlabs, Newton, New Jersey) is utilized for fluorescence excitation, while a fiber optic switch is used to switch the laser on and off. For fluorescence light detection, a photomultiplier (PMT) detection unit is used. More details on the detection unit can be found in our previous publication.11 A 65-dB RF amplifier was used to amplify the output signal of the PMT. Two cascaded band-pass filters (830 nm, MK Photonics, Albuquerque, New Mexico) and two aspheric lenses for collimation were used to efficiently eliminate excitation light leakage. A network analyzer (Agilent Technologies, Palo Alto, California) provides 100 MHz RF signal for the laser-diode amplitude modulation and also measures the amplitude and phase of the detected fluorescence signal. The change in amplitude and phase indicates variation in fluorescence quantum efficiency and fluorescence lifetime, respectively.20–22 Fig. 1Diagram of the frequency domain TM-FT system. The same instrumentation is used both for characterizing the sample agent and for imaging experiments. The sample characterization setup is indicated by the green box, while the imaging setup is indicated by the red box.  The sample is heated slowly for about 1 min, and the temperature increase is kept below 5°C. Each fluorescence measurement is averaged eight times and completed in 2 sec. The temperature and fluorescence measurements are sampled and recorded with a temporal resolution of 10 sec. The results are shown in Fig. 2. The amplitude increases about 5 dBm (intensity increases 1.8 times) as the temperature is elevated by only 3°C, indicating an increased ICG fluorescence quantum yield. At the same time, the phase decreases about 6 deg, indicating an increased ICG lifetime. These results are in agreement with the previously published study on the dependence of fluorescence quantum efficiency and lifetime to solvent polarity.14,23 With increased temperature, the interior of micelles becomes more hydrophobic, resulting in an increase in both fluorescence quantum efficiency and lifetime. 2.2.Phantom ExperimentA phantom study is performed to demonstrate the feasibility of a TM-FT system for resolving a temperature-sensitive fluorescence agent at high spatial resolution based on both intensity and lifetime contrast. The schematic diagram of the system is shown in Fig. 1. The same light source and fluorescence detection system is utilized, but the experimental setup is different as indicated by the red box in Fig. 1. Instead of heating the sample with TEC, the ICG-loaded pluronic nanocapsules are embedded deep in an agarose tissue-simulating phantom and heated by HIFU. The HIFU transducer (H102, Sonic Concepts, Inc., Washington) with a center frequency of 1.1 MHz is mounted on an , , translational stage and used to generate a focused hot spot. The lateral full width at half maximum (FWHM) of the focal spot is 1.33 mm. The transducer is driven by a function generator (PTS 500, Programmed Test Sources, Inc., Washington) and a power amplifier (200L, Amplifier Research, Inc., Pennsylvania). A slab agar phantom is immersed in a water tank. The transducer is scanned laterally in both and directions above the phantom. The measurement is averaged four times, which yields an acquisition time of 2 sec for a particular transducer position. A 3-mm fluorescence inclusion filled with Pluronic-ICG (Innosense Inc.) is embedded in the middle of the phantom. Additions of 0.5% Intralipid and Indian Ink are used to set the reduced scattering and absorption coefficient of the phantom to and , respectively. The actual size, position, and concentration of the inclusion are shown in Fig. 3(a). During the measurements, HIFU is scanned over an area at 1-mm steps [Fig. 3(b)]. At each step, the HIFU is turned on for 2 sec, and the power is adjusted to keep the temperature at the focal spot below 40°C. The change in both fluorescence signal amplitude and phase is mapped to each scanning position. Both amplitude and phase only significantly vary when the HIFU hot spot is scanned through the fluorescence object [Fig. 3(c) and 3(d)], resulting in a much improved spatial resolution. As seen from the profiles across the fluorescence inclusion [Fig. 3(e) and 3(f)], the FWHM of the inclusion recovered from both intensity and lifetime maps is the same, 3.2 mm. Fig. 3Phantom experiment results. (a) The true size, position, and concentration of the inclusion are shown. A 3-mm inclusion filled with Pluronic-ICG is embedded in the middle of a phantom. (b) HIFU is scanned through an area while fluorescence measurements are taken. (c), (d) The fluorescence intensity and lifetime signal only change significantly when the HIFU hot spot is scanned through the fluorescence object, which reveals the high resolution fluorophore distribution map. (e), (f) The normalized profiles plotted across the fluorescence inclusion show that the size of the object is accurately recovered based on both intensity and lifetime contrast.  3.Conclusion and DiscussionWe have successfully observed temperature-modulated fluorescence signal in scattering medium with HIFU resolution. Especially the lifetime contrast mechanism, which is independent of fluorescence intensity, could be robustly recovered with high resolution. A frequency-domain TM-FT system was constructed and used to acquire time-resolved fluorescence measurements. The frequency-domain system was chosen because of its relatively low cost and fast acquisition time. A time-domain system can also be integrated into a TM-FT system to extract lifetime information.9,10 Furthermore, it is feasible to use a tomographic approach to quantify the fluorescence concentration and lifetime if the actual temperature change can be predicted through proper modeling of the HIFU pressure field and bio-heat transfer equation.24 However, this is beyond the scope of this study and will be investigated in the future. TM-FT combines the optical contrast of fluorescence imaging and the spatial resolution of focused ultrasound, which is also the nature of another technique called ultrasound modulated fluorescence tomography (UMFT).25,26 The main difference is that TM-FT measures the direct amplitude and phase change caused by the temperature elevation in the focal zone, while UMFT utilizes direct ultrasound modulation of the optical signal in the focal zone. Therefore, the spatial resolutions of both TM-FT and UMFT are limited by the focused ultrasound spot size and thus are expected to be similar. On the other hand, UMFT has low modulation efficiency and an extremely low signal-to-noise ratio, which are the two main factors that make its implementation difficult. Another intriguing technique is photo-acoustic tomography (PAT), which can provide optical absorption maps at ultrasound resolution () and a depth penetration of 3 to 5 cm.27–29 It has been demonstrated to provide distribution of exogenous contrast agents using multiple-wavelength measurements.30–32 However, the main difference is that PAT is inherently based on absorption contrast and detects differential increase in absorption from comparing molecular probes to background, whereas TM-FT measures the exogenous fluorescence signal directly. In conclusion, we have demonstrated a temperature-modulated fluorescence tomography system that effectively obtains fluorescence intensity and lifetime contrast at ultrasound resolution. This novel technique can potentially contribute to the development of new temperature-sensitive contrast agents. Future work includes establishing a mathematical framework for TM-FT, extensively investigating the sensitivity and spatial resolution, and performing verification through in vivo studies. AcknowledgmentsThis research is supported in part by National Institutes of Health (NIH) grants R01EB008716, R21/33 CA120175, and R01CA1429898, and by Susan G. Komen Foundation training grant KG101442. ReferencesJ. V. Frangioni,
“In vivo near-infrared fluorescence imaging,”
Curr. Opin. Chem. Biol., 7
(5), 626
–634
(2003). http://dx.doi.org/10.1016/j.cbpa.2003.08.007 COCBF4 1367-5931 Google Scholar
F. Leblondet al.,
“Pre-clinical whole-body fluorescence imaging: review of instruments, methods and applications,”
J. Photochem. Photobiol. B, 98
(1), 77
–94
(2010). http://dx.doi.org/10.1016/j.jphotobiol.2009.11.007 JPPBEG 1011-1344 Google Scholar
V. Ntziachristos,
“Fluorescence molecular imaging,”
Annu. Rev. Biomed. Eng., 8
(1), 1
–33
(2006). http://dx.doi.org/10.1146/annurev.bioeng.8.061505.095831 ARBEF7 1523-9829 Google Scholar
V. Ntziachristoset al.,
“Fluorescence imaging with near-infrared light: new technological advances that enable in vivo molecular imaging,”
Eur. Radiol., 13
(1), 195
–208
(2003). EURAE3 1432-1084 Google Scholar
E. M. Sevick-MuracaJ. C. Rasmussen,
“Molecular imaging with optics: primer and case for near-infrared fluorescence techniques in personalized medicine,”
J. Biomed. Opt., 13
(4), 041303
–041316
(2008). http://dx.doi.org/10.1117/1.2953185 JBOPFO 1083-3668 Google Scholar
S. Patwardhanet al.,
“Time-dependent whole-body fluorescence tomography of probe bio-distributions in mice,”
Opt. Express, 13
(7), 2564
–2577
(2005). http://dx.doi.org/10.1364/OPEX.13.002564 OPEXFF 1094-4087 Google Scholar
R. Cubedduet al.,
“Time-resolved fluorescence imaging in biology and medicine,”
J. Phys. D: Appl. Phys., 35
(9), R61
–R76
(2002). http://dx.doi.org/10.1088/0022-3727/35/9/201 JPAPBE 0022-3727 Google Scholar
E. Kuwanaet al.,
“Fluorescence lifetime spectroscopy of a pH-sensitive dye encapsulated in hydrogel beads,”
Biotechnol. Prog., 20
(5), 1561
–1566
(2004). http://dx.doi.org/10.1021/bp034328i BIPRET 8756-7938 Google Scholar
A. T. N. Kumaret al.,
“A time domain fluorescence tomography system for small animal imaging,”
IEEE Trans. Med. Imag., 27
(8), 1152
–1163
(2008). http://dx.doi.org/10.1109/TMI.2008.918341 ITMID4 0278-0062 Google Scholar
R. E. Nothdurftet al.,
“In vivo fluorescence lifetime tomography,”
J. Biomed. Opt., 14
(2), 024004
–024007
(2009). http://dx.doi.org/10.1117/1.3086607 JBOPFO 1083-3668 Google Scholar
Y. Linet al.,
“A photo-multiplier tube-based hybrid MRI and frequency domain fluorescence tomography system for small animal imaging,”
Phys. Med. Biol., 56
(15), 4731
–4747
(2011). http://dx.doi.org/10.1088/0031-9155/56/15/007 PHMBA7 0031-9155 Google Scholar
C. YongpingL. Xingde,
“Near-infrared fluorescent nanocapsules with reversible response to thermal/pH modulation for optical imaging,”
Biomacromolecules, 12
(12), 4367
–72
(2011). http://dx.doi.org/10.1021/bm201350d BOMAF6 1525-7797 Google Scholar
T. Kimet al.,
“Evaluation of temperature-sensitive, indocyanine green-encapsulating micelles for noninvasive near-infrared tumor imaging,”
Pharm. Res., 27
(9), 1900
–1913
(2010). http://dx.doi.org/10.1007/s11095-010-0190-y PHREEB 0724-8741 Google Scholar
M. Y. Berezinet al.,
“Near infrared dyes as lifetime solvatochromic probes for micropolarity measurements of biological systems,”
Biophys. J., 93
(8), 2892
–2899
(2007). http://dx.doi.org/10.1529/biophysj.107.111609 BIOJAU 0006-3495 Google Scholar
Y. Linet al.,
“Temperature modulated fluorescence tomography in a turbid media,”
Appl. Phys. Lett., 100
(7), 073702
–073702-4
(2012). http://dx.doi.org/10.1063/1.3681378 APPLAB 0003-6951 Google Scholar
M. D. Maet al.,
“Pluronic F127-g-poly(acrylic acid) copolymers as in situ gelling vehicle for ophthalmic drug delivery system,”
Int. J. Pharm., 350
(1–2), 247
–256
(2008). http://dx.doi.org/10.1016/j.ijpharm.2007.09.005 IJPHDE 0378-5173 Google Scholar
S. H. Choiet al.,
“Thermally reversible pluronic/heparin nanocapsules exhibiting 1000-fold volume transition,”
Langmuir, 22
(4), 1758
–1762
(2006). http://dx.doi.org/10.1021/la052549n LANGD5 0743-7463 Google Scholar
V. B. Rodriguezet al.,
“Encapsulation and stabilization of indocyanine green within poly(styrene-alt-maleic anhydride) block-poly(styrene) micelles for near-infrared imaging,”
J. Biomed. Opt., 13
(1), 014025
–014010
(2008). http://dx.doi.org/10.1117/1.2834296 JBOPFO 1083-3668 Google Scholar
B. R. Victoriaet al.,
“Encapsulation and stabilization of indocyanine green within poly(styrene-alt-maleic anhydride) block-poly(styrene) micelles for near-infrared imaging,”
J. Biomed. Opt., 13
(1), 014025
(2008). http://dx.doi.org/10.1117/1.2834296 JBOPFO 1083-3668 Google Scholar
J. R. LakowiczK. W. Berndt,
“Lifetime selective fluorescence imaging using an rf phase sensitive camera,”
Rev. Sci. Instrum., 62
(7), 1727
–1734
(1991). http://dx.doi.org/10.1063/1.1142413 RSINAK 0034-6748 Google Scholar
T. Gadellaet al.,
“Construction and characterization of a frequency-domain fluorescence lifetime imaging microscopy system,”
J. Fluoresc., 7
(1), 35
–43
(1997). http://dx.doi.org/10.1007/BF02764575 JOFLEN 1053-0509 Google Scholar
A. Godavartyet al.,
“Fluorescence-enhanced optical imaging in large tissue volumes using a gain-modulated ICCD camera,”
Phys. Med. Biol., 48
(12), 1701
–1720
(2003). http://dx.doi.org/10.1088/0031-9155/48/12/303 PHMBA7 0031-9155 Google Scholar
R. C. BensonH. A. Kues,
“Fluorescence properties of indocyanine green as related to angiography,”
Phys. Med. Biol., 23
(1), 159
–163
(1978). http://dx.doi.org/10.1088/0031-9155/23/1/017 PHMBA7 0031-9155 Google Scholar
G. Wanget al.,
“Temperature-modulated bioluminescence tomography,”
Opt. Express, 14
(17), 7852
–7871
(2006). http://dx.doi.org/10.1364/OE.14.007852 OPEXFF 1094-4087 Google Scholar
B. YuanY. Liu,
“Ultrasound-modulated fluorescence from rhodamine B aqueous solution,”
J. Biomed. Opt., 15
(2), 021321
–021326
(2010). http://dx.doi.org/10.1117/1.3333546 JBOPFO 1083-3668 Google Scholar
B. Yuanet al.,
“Microbubble-enhanced ultrasound-modulated fluorescence in a turbid medium,”
Appl. Phys. Lett., 95
(18), 181113
(2009). http://dx.doi.org/10.1063/1.3262959 APPLAB 0003-6951 Google Scholar
V. LihongH.-I. W. Wang, Biomedical Optics: Principles and Imaging, 1st ed.Wiley-Interscience, New Jersey
(2007). Google Scholar
M. XuL. V. Wang,
“Photoacoustic imaging in biomedicine,”
Rev. Sci. Instrum., 77
(4), 041101
–041122
(2006). http://dx.doi.org/10.1063/1.2195024 RSINAK 0034-6748 Google Scholar
L. V. Wang,
“Prospects of photoacoustic tomography,”
Med. Phys., 35
(12), 5758
–5767
(2008). http://dx.doi.org/10.1118/1.3013698 MPHYA6 0094-2405 Google Scholar
L. Meng-Linet al.,
“Simultaneous molecular and hypoxia imaging of brain tumors in vivo using spectroscopic photoacoustic tomography,”
Proc. IEEE, 96
(3), 481
–489
(2008). http://dx.doi.org/10.1109/JPROC.2007.913515 IEEPAD 0018-9219 Google Scholar
D. Razanskyet al.,
“Multispectral opto-acoustic tomography of deep-seated fluorescent proteins in vivo,”
Nat. Photon., 3
(7), 412
–417
(2009). http://dx.doi.org/10.1038/nphoton.2009.98 1749-4885 Google Scholar
R. Maet al.,
“Multispectral optoacoustic tomography (MSOT) scanner for whole-body small animal imaging,”
Opt. Express, 17
(24), 21414
–21426
(2009). http://dx.doi.org/10.1364/OE.17.021414 OPEXFF 1094-4087 Google Scholar
|


