|
|
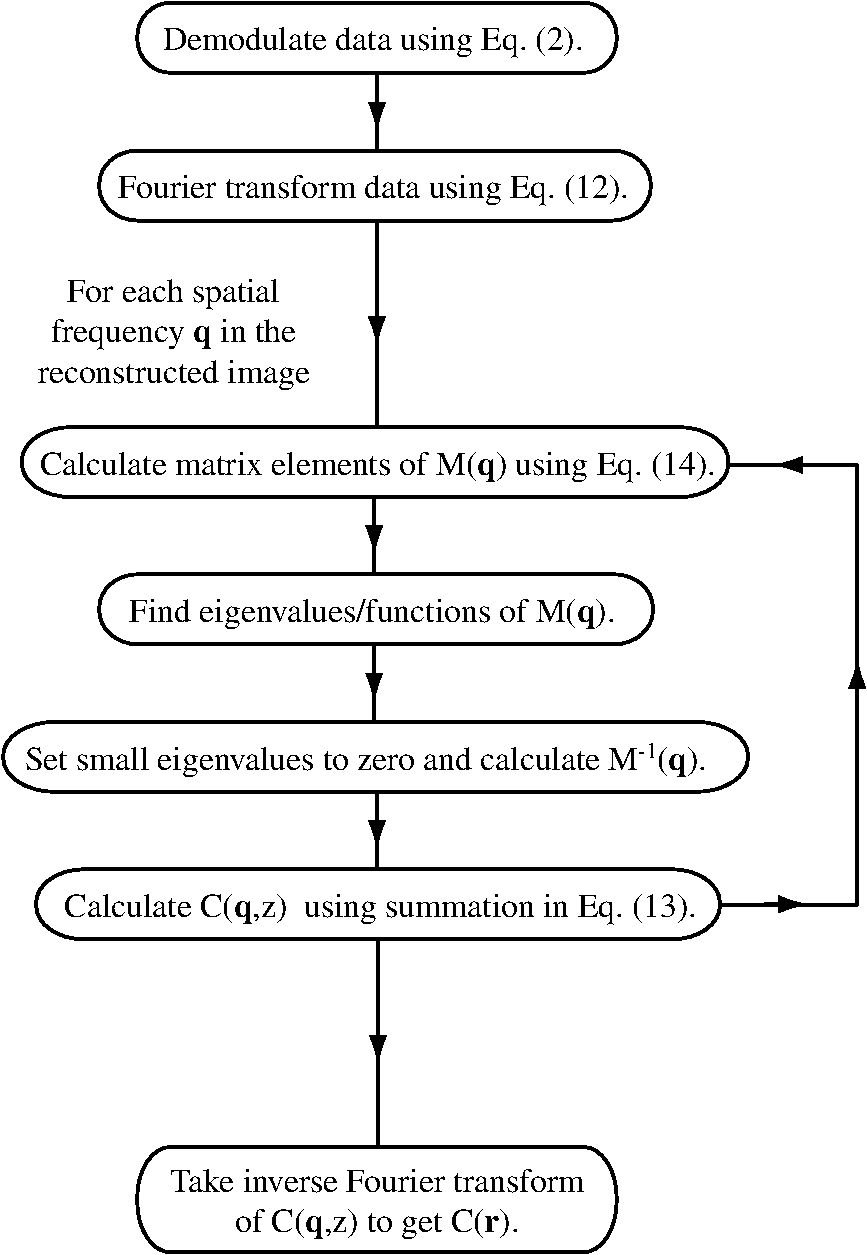
1.IntroductionFluorescence guidance in neurosurgery using 5-aminolevulinic acid (ALA)-induced protoporphyrin IX (PpIX) is gaining popularity as a surgical adjunct to improve the extent of tumor resection.1–3 A randomized controlled phase III clinical trial by Stummer and colleagues has shown greater extent of resection and significantly higher 6-month progression-free survival in patients with high-grade glioma (GBM) undergoing fluorescence guidance compared to conventional white-light-guided surgery.4,5 Methods to quantify PpIX concentration in tissue using a fiber-optic “point” probe and a spectrally constrained model of light propagation have been shown to improve tumor detection with enhanced accuracy (87%) compared to the subjective visual fluorescence assessment (66%) used in the Stummer studies.6,7 To better integrate this concept into surgical guidance, this work explores the development of a model-based wide-field fluorescence imaging method integrated into a surgical microscope. Our goal is to develop quantitative, depth-resolved imaging for fluorescence guidance during neurosurgery. To date, ALA-induced PpIX fluorescence guidance has been based on violet/blue light to excite the Soret-band of the molecule (around ), which limits the penetration of the probing signal to a few hundred microns at best, potentially leaving residual tumor undetected when located below the surgical surface. Fortunately, the excitation spectrum of PpIX also possesses several longer wavelength excitation bands up to around (Q-bands) and a broad emission spectrum extending up to that could be used to stimulate (and detect) emissions from subsurface tumor. Despite the potential benefits during surgery, efforts to detect fluorescence at depth using model-based techniques are still in an early stage of development with promising preliminary results reported by Kim et al.8 and Leblond et al.9 Spatial frequency domain imaging (SFDI) is a relatively new method that uses red or near-infrared light together with CCD detection to acquire wide-field images of tissue. Sinusoidal patterns of varying spatial frequencies are projected onto tissue, and the attenuation in the amplitude of the spatial patterns at each CCD pixel is fitted to a model of light propagation in order to form images of the tissue optical properties.10,11 SFDI has recently been used to quantify PpIX concentrations in vivo by accounting for tissue optical properties.12 Spatially modulated excitation also encodes the depth from which measured optical signals originate because high spatial frequency patterns penetrate less deeply into tissue than their lower frequency counterparts because of multiple light scattering. This frequency encoding enables depth information to be recovered through three-dimensional (3-D) optical tomography.13 Most SFDI research has focused on generating two-dimensional (2-D) images by fitting the reflectance measure at each pixel of a CCD array to a homogeneous model of light propagation. With the approach, SFDI has been applied to quantitatively image stroke,14 brain injury,15 cortical spreading depression,16 and layered structures in skin.17 SFDI techniques have also been used to localize subsurface inhomogeneities,18 and to determine tissue optical absorption and scattering properties over a broad spectral range.19 Recently, several groups have reconstructed 3-D tomographic images using sinusoidal illumination patterns,13,20,21 but these studies were limited to measuring the optical properties of tissue simulating phantoms and did not include in vivo or fluorescence measurements. While we have performed fluorescence SFDI, these preliminary studies did not involve tomographic image reconstruction and were limited to phantoms and/or skin.12,22 Likewise, while fluorescence optical tomography with wide-field illumination has been reported for phantom studies23,24 and whole-body mouse imaging,25 it has not been reported either for spatial frequency domain illumination or brain imaging. In this study we implement, for the first time to our knowledge, fluorescence optical tomography using spatial frequency domain illumination. We then demonstrate the ability of SFDI to image GBM tumors based on endogenous contrast from hemoglobin and the tissue-scattering parameters as well as exogenous contrast from ALA-induced PpIX fluorescence. We present experiments in tissue simulating phantoms with embedded GBM spheroids, and in an in vivo GBM mouse model. We use 2-D SFDI to image endogenous optical properties and observe that the reduced scattering coefficient () exhibits significant contrast between normal brain and tumor. We then successfully implement 3-D SFDI fluorescence tomography to localize tumors through ALA-induced PpIX fluorescence. 2.Methods2.1.Sample PreparationThe GBM spheroids used in the phantoms were grown from grade IV GBM cells (ACBT) to tumor spheroids of to 2 mm diameter according to established methods.26,27 Selected spheroids were then positioned in tissue simulating phantoms consisting of 85% water, 10% PBS, 5% of a fat emulsion to simulate tissue scattering (Liposyn® 20%) resulting in a 1% final concentration of fat particles, and gelatine (). Porcine erythrocytes were added (0.5% by volume) to simulate optical absorption. For in vivo mouse imaging, GBM cells isolated from surgical specimens were injected into the brain of an athymic (nude) mouse. The mouse began to show symptoms of weight loss, decreased mobility, poor grooming, and increased stress at weeks. At this time it was injected ALA (, i.p.) 3 h prior to imaging. At the time of imaging, the mouse was anesthetized with i.p. ketamine/xylazine and secured in an ear-bar frame. 2.2.Data AcquisitionA schematic of the instrument appears in Fig. 1. We imaged reflectance and fluorescence by illuminating a liquid crystal on silicon (LCOS) device (HEO 1080p, HOLOEYE Photonics AG) with a 20-mW, HeNe laser (1145AP, JDS Uniphase). The LCOS projected images on the sample consisted of sinusoidal intensity patterns of the form where represents a location on the sample surface, is the spatial projection wave number, is the phase of the spatial projection. The spatial projection frequency was varied from (no spatial modulation) to in intervals of . At each spatial frequency, the intensity pattern was serially projected at three different phases (, 120, and 240 deg), and the remitted light resulting from each projection was detected by a CCD array (Cascade 512B, Roper Scientific). The average excitation intensity at the tissue surface for was . In fluorescence mode, the excitation light was blocked at the detector with a 650-nm longpass filter (, out-of-band ) followed by a 680-nm bandpass filter [full width at half maximum , , out-of-band ]. To image endogenous contrast, light from a quartz tungsten halogen lamp (CF1000, Illumination Technologies) was filtered serially at four wavelengths (680, 720, 800, and 820 nm) and coupled to the LCOS via a 5-mm-core-diameter liquid light guide. Orthogonal linear polarizers were incorporated to eliminate glare from specular reflections and were used in both the endogenous and fluorescence scans. Data acquisition took (endogenous contrast), and (fluorescence contrast). We expect to be able to reduce these times by use of brighter sources and optimized optics.2.3.Data AnalysisThe three images (, , ) at the different phases acquired for each projected spatial frequency were combined according to Ref. 13: As can be seen by substituting the source term described by Eq. (1) into Eq. (2), represents the reflectance expected from a source of the form . To produce 2-D maps of the absorption coefficient, , and the reduced scattering coefficient, , at each wavelength, the amplitude of at each CCD pixel was fitted to a semi-infinite, homogeneous, radiative transport model of light propagation aided by a rapid look-up table approach.10 Tissue concentrations of oxyhemoglobin () and deoxyhemoglobin (ctHb) were determined through spectral fitting of the absorption values using the known extinction coefficients for the two chromophores (assuming no other significant absorbers were present). We reconstructed 3-D images of the concentration of PpIX by adapting our previously published method for tomographic imaging of absorption using SFDI.13 For continuous wave illumination, the measured emission light at position due to illumination wavenumber is related to the fluorophore concentration by where is the photon density of excitation light in the medium, is the extinction coefficient of the fluorophore at the excitation wavelength, is the fluorescence quantum yield ( for PpIX), and is the fluorophore concentration. The Green’s function obeys the diffusion equation at the emission wavelength subject to the boundary condition Here is the diffusion coefficient, is the extrapolation length, and is the outward-pointing unit normal. For the semi-infinite geometry, the Green’s function can be decomposed into plane waves28 according to where when either or is located on the surface, andEquations (6) and (7) allow us to represent the photon density of the exitation light in the tissue appearing in Eq. (3) as Substituting Eqs. (6), (7), and (9) into Eq. (3) and taking a Fourier transform with respect to the detector positions on the surface result in where and The inverse of Eq. (10) is used to calculate the fluorophore distribution. It appears as whereIn these formulas, the Fourier variable is related to the projection wave number and the Fourier variable conjugate to the detector locations by . The subscripts ex and em indicate whether the optical properties ( and ) for the respective variable refer to the excitation or emission wavelength ( and , respectively). The average optical properties at 633 nm (excitation) and 680 nm (emission) obtained from the endogenous SFDI were used as inputs in Eq. (5) for the tomographic fluorescence reconstructions. The inverses of the M matrices [see Eq. (14)] are needed in Eq. (13). We take the inverse of each of these matrices by solving its eigenvalue problem and setting all eigenvalues below a threshold to zero. For this study the threshold was kept constant at . We solved for the fluorophore concentration over a grid of points in the Fourier domain with and . Image reconstruction required only on a single 2.80-GHz processor. A flowchart of the tomographic reconstruction algorithm appears in Fig. 2. 3.ResultsAs an initial test of the ability to image relative PpIX concentrations in turbid media, two GBM spheroid phantoms were evaluated. In the first phantom the spheroid was located with its top surface level with the surface of the phantom, whereas in the second phantom the spheroid was embedded such that its top surface was located beneath the phantom. After imaging, the phantom containing the subsurface spheroid was cut in half to confirm its location [Fig. 3(a)]. In the reconstructed images, the maximum PpIX concentration of the superficial spheroid [Fig. 3(b)] was reconstructed at a depth of 1 mm, while the maximum for the subsurface spheroid [Fig. 3(c)] was at a depth of 2 mm. Although both spheroids were approximately the same size (), the image of the superficial spheroid had a lateral FWHM of 2.4 mm compared to 4.7 mm for the deeper spheroid. The volume of contrast enhancement in the reconstructed image with concentration greater than 50% of the maximum was also less for the superficial () than for the deeper () spheroid. However, the reconstructed maximum concentration of the superficial spheroid was 3.6 times that of the deeper spheroid, such that the estimated total amount of PpIX in the two images agreed within 30%. Fig. 3Fluorescence tomography reconstructions of PpIX concentrations for the GBM spheroid containing phantoms. (a) Cross-sectional image of the subsurface spheroid taken after the phantom was cut in half. (b) Reconstructed image of the phantom with the spheroid at the surface. (c) As in (b) for the subsurface spheroid. Each image in (b and c) corresponds to the reconstructed PpIX concentration at the depth indicated below the frame. 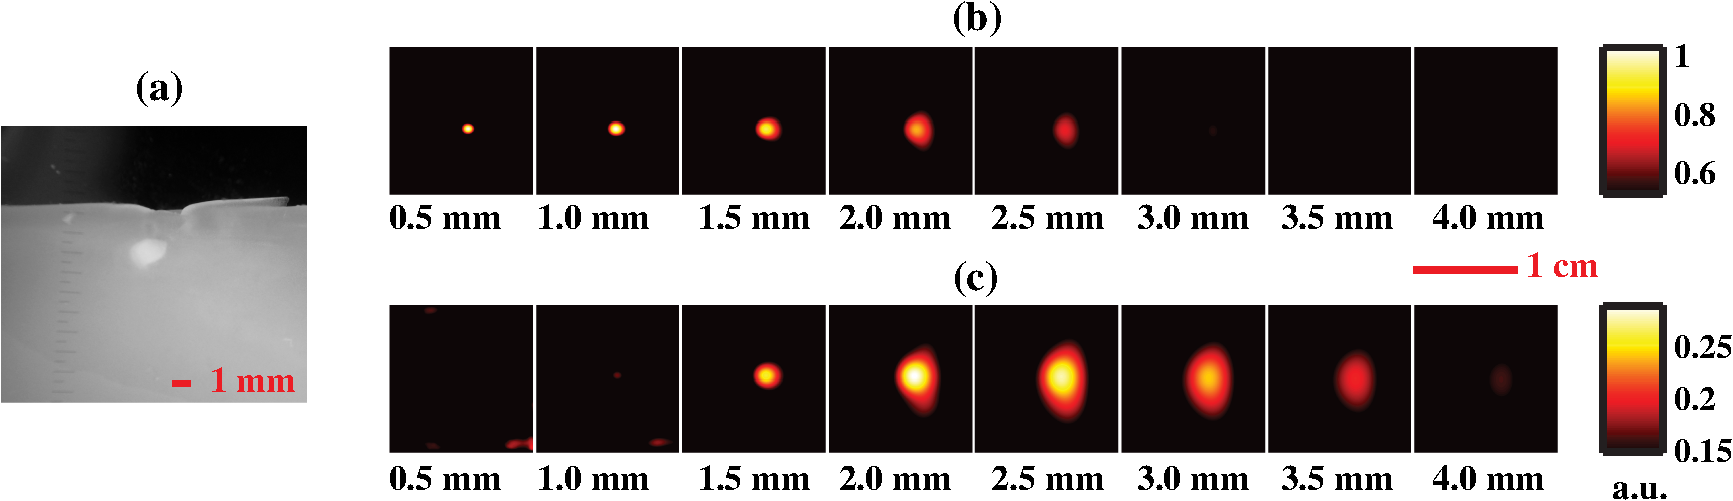 In the mouse images of the reduced scattering coefficient and hemoglobin concentration through the intact skull [Fig. 4(a)] and with the brain exposed [Fig. 4(b)], scattering contrast between tumor and normal tissue (taken as an identically sized region adjacent to the tumor) was at all wavelengths [Fig. 4(c)]. Fitting scattering values to a power law of the form with resulted in A and b values that were greater for the tumor. As shown in Fig. 4(d), deoxyhemoglobin concentration, ctHb, was significantly higher in tumor than in normal tissue, likely because of metabolic differences such as angiogenesis and hypoxia. Oxyhemoglobin concentration values, , were similar for tumor and normal brain tissue. These results are summarized in Table 1. Fig. 4Two-dimensional images of the reduced scattering coefficient, oxyhemoglobin concentration, and deoxyhemoglobin concentration in the mouse with (a) intact skull and (b) exposed brain. Plots of the scattering coefficient, , (c) and (d) concentrations of Hb and for tumor and normal regions are also shown. Error bars denote the standard deviation of pixel values in the region of interest.  Table 1Measured in vivo values in the mouse brain for tumor and normal tissue (Shown are the means and standard deviations of pixel values in the tumor and normal regions of interest).
Figure 5(a) shows a picture of the skull illuminated with spatially modulated 633-nm light (). The dotted red line denotes the region of interest used in the fluorescence image reconstruction. In the reconstructed images of PpIX concentration, the tumor appears slightly deeper with an intact skull [Fig. 5(b)] than with the skull removed [Fig. 5(c)], with the maximum intensity occurring 1.5 mm and 1.0 mm below the surface, respectively (actual skull thickness ). The presence of the skull decreased the maximum concentration in the image by 8%, increased the FWHM from 1.1 to 2.1 mm, and increased the apparent tumor volume from 4.5 to . Similar to the phantom experiments, the effects of increased size and decreased concentration offset each other such that the total estimated amount of PpIX remained constant to within 10%. Fig. 5(a) Photograph of the skull in which the illumination pattern is visible. The dotted red line denotes the region of interest for the 3-D reconstructions. (b) Reconstructed images of PpIX concentration with the skull intact. (c) As in (b) with the brain surgically exposed. The corresponding reconstructed image depth is indicated below each frame. 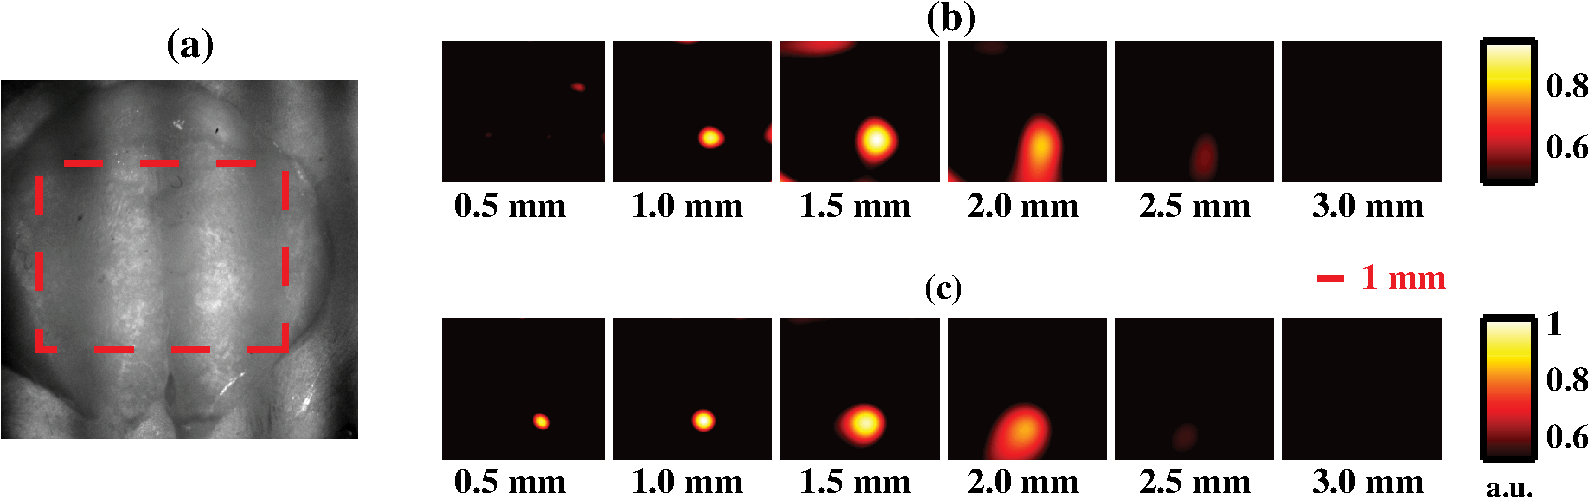 4.DiscussionOne feature common to all of the reconstructions in this study is that deeper objects appear larger and with less contrast than superficial ones. This is the result of a partial volume effect that occurs because the interrogation volume of each measurement is larger than the features we are trying to reconstruct. As a result, the reconstructed features have values somewhere between those of their actual values and the background. The effect is more pronounced for deeper structures because the sensitivity functions are peaked near the surface and become broader with depth. We have analyzed the partial volume effect for SFDI in a previous publication where we showed that tomographic image reconstruction ameliorated (but did not eliminate) this effect in comparison to our 2-D imaging methods.13 We do not expect this partial volume effect to prevent the use of SFDI tomography for neurosurgical resection of tumors. Fluorescence-assisted surgical resection is guided by the qualitative presence or absence of fluorescent signal. Thus, the exact peak concentration is of less importance than a measurement of the fluorophore depth or the total amount of fluorophore present. Knowledge of fluorophore depth could improve the efficiency of surgical resection by allowing a surgeon to more confidently dissect down to tumor below the cortical surface; then proceed with more aggressive tumor resection while far from the deep margin; and finally convert to slower, more meticulous removal when the deep interface is near. The increase in size of the reconstructions with depth is expected to interfere with accurate estimates of deep tumor extent. However, as tumor can only be removed from the surface of the operative field, the higher volume estimates at depth are of less concern because they are expected to decrease as tumor is removed and overall depth is reduced. It may be possible to obtain more accurate reconstructions by using algorithms that allow for inhomogeneous tissue optical properties. Such algorithms could be implemented with finite-element or Monte Carlo methods to model light transport. However, one of the main advantages of our reconstruction method is its speed. This speed is necessary to make surgical applications feasible. The current reconstructions use data points and take only . In addition, they could be made faster by parallel computing, by pre-calculating the eigenvalues/functions of the matrices, or by reconstructing over a reduced bandwidth. We are able to attain this speed because we use homogeneous tissue optical properties and a planar geometry to model light transport. These assumptions make the Green’s function for the diffusion equation translationally invariant and enable us to write Eq. (3) in block diagonal form [see Eq. (10)] such that it can be solved rapidly. Thus while we plan to explore the potential benefits of modeling light transport through inhomogeneous tissue, we expect that for applications requiring rapid feedback (e.g., surgery), the algorithm proposed here will be better suited. 5.ConclusionIn summary, this proof-of-principle study demonstrates the ability of multiwavelength, multifrequency SFDI tomography to localize small () subsurface ( to 3 mm deep) tumors in tissue-simulating phantoms and in vivo using ALA-induced PpIX fluorescence. These results suggest that SFDI may offer a wide-field fluorescence imaging approach that accounts for intrinsic tissue optical properties, characterizes subsurface nests of tumor cells, and potentially provides contrast for improved intraoperative neurosurgical guidance. Future studies will provide more detailed insight into factors that limit SFDI accuracy and performance, and explore the combination of image guidance with probe-based methods.6,8,9 AcknowledgmentsWe thank Chung-Ho Sun for preparation of the GBM spheroids, G. Granger for his gift of the ACBT GBM cell line, Yi-hong Zhou for use of the nude mouse glioma model, and Abhishek Chaturbedi for preparation of this model. Support for this work was provided to University of California–Irvine by the National Institutes of Health (NIH) NCRR/NIBIB Laser Microbeam and Medical Program (LAMMP, P41-EB015890), the Military Photomedicine Program (AFOSR Grant # FA9550-08-1-0384), and the Beckman Foundation. Support to Dartmouth College/University of Toronto was provided through NIH grants RO1-NS052274-01A2 and K25-CA138578. Soren D. Konecky was supported by a fellowship from the Hewitt Foundation for Medical Research. ReferencesB. W. Pogueet al.,
“Review of neurosurgical fluorescence imaging methodologies,”
IEEE J. Sel. Top. Quant. Electron., 16
(3), 493
–505
(2010). http://dx.doi.org/10.1109/JSTQE.2009.2034541 IJSQEN 1077-260X Google Scholar
S. A. Friesenet al.,
“5-Aminolevulinic acid-based photodynamic detection and therapy of brain tumors (review),”
Int. J. Oncol., 21
(3), 577
–582
(2002). IJONES 1019-6439 Google Scholar
D. W. Robertset al.,
“Coregistered fluorescence-enhanced tumor resection of malignant glioma: relationships between delta-aminolevulinic acid-induced protoporphyrin IX fluorescence, magnetic resonance imaging enhancement, and neuropathological parameters,”
J. Neurosurg., 114
(3), 595
–603
(2011). http://dx.doi.org/10.3171/2010.2.JNS091322 JONSAC 0022-3085 Google Scholar
W. Stummeret al.,
“Fluorescence-guided surgery with 5-aminolevulinic acid for resection of malignant glioma: a randomised controlled multicentre phase III trial,”
Lancet Oncol., 7
(5), 392
–401
(2006). http://dx.doi.org/10.1016/S1470-2045(06)70665-9 LOANBN 1470-2045 Google Scholar
W. Stummeret al.,
“Extent of resection and survival in glioblastoma multiforme: identification of and adjustment for bias,”
Neurosurgery, 62
(3), 564
–576
(2008). http://dx.doi.org/10.1227/01.neu.0000317304.31579.17 NEQUEB 0148-396X Google Scholar
A. Kimet al.,
“Quantification of in vivo fluorescence decoupled from the effects of tissue optical properties using fiber-optic spectroscopy measurements,”
J. Biomed. Opt., 15
(6), 067006
(2010). http://dx.doi.org/10.1117/1.3523616 JBOPFO 1083-3668 Google Scholar
P. A. Valdeset al.,
“Quantitative fluorescence in intracranial tumor: implications for ALA-induced PpIX as an intraoperative biomarker,”
J. Neurosurg., 115
(1), 11
–17
(2011). http://dx.doi.org/10.3171/2011.2.JNS101451 JONSAC 0022-3085 Google Scholar
A. Kimet al.,
“Topographic mapping of subsurface fluorescent structures in tissue using multiwavelength excitation,”
J. Biomed. Opt., 15
(6), 066026
(2010). http://dx.doi.org/10.1117/1.3523369 JBOPFO 1083-3668 Google Scholar
F. Leblondet al.,
“Analytic expression of fluorescence ratio detection correlates with depth in multi-spectral sub-surface imaging,”
Phys. Med. Biol., 56
(21), 6823
–6837
(2011). http://dx.doi.org/10.1088/0031-9155/56/21/005 PHMBA7 0031-9155 Google Scholar
D. J. Cucciaet al.,
“Quantitation and mapping of tissue optical properties using modulated imaging,”
J. Biomed. Opt., 14
(2), 024012
(2009). http://dx.doi.org/10.1117/1.3088140 JBOPFO 1083-3668 Google Scholar
D. J. Cucciaet al.,
“Modulated imaging: quantitative analysis and tomography of turbid media in the spatial-frequency domain,”
Opt. Lett., 30
(11), 1354
–1356
(2005). http://dx.doi.org/10.1364/OL.30.001354 OPLEDP 0146-9592 Google Scholar
R. B. Saageret al.,
“Quantitative fluorescence imaging of protoporphyrin IX through determination of tissue optical properties in the spatial frequency domain,”
J. Biomed. Opt., 16
(12), 126013
(2011). http://dx.doi.org/10.1117/1.3665440 JBOPFO 1083-3668 Google Scholar
S. D. Koneckyet al.,
“Quantitative optical tomography of sub-surface heterogeneities using spatially modulated structured light,”
Opt. Express, 17
(17), 14780
–14790
(2009). http://dx.doi.org/10.1364/OE.17.014780 OPEXFF 1094-4087 Google Scholar
D. Abookasiset al.,
“Imaging cortical absorption, scattering, and hemodynamic response during ischemic stroke using spatially modulated near-infrared illumination,”
J. Biomed. Opt., 14
(2), 024033
(2009). http://dx.doi.org/10.1117/1.3116709 JBOPFO 1083-3668 Google Scholar
J. R. Weberet al.,
“Multispectral imaging of tissue absorption and scattering using spatial frequency domain imaging and a computed-tomography imaging spectrometer,”
J. Biomed. Opt., 16
(1), 011015
(2011). http://dx.doi.org/10.1117/1.3528628 JBOPFO 1083-3668 Google Scholar
D. J. Cucciaet al.,
“Quantitative in vivo imaging of tissue absorption, scattering, and hemoglobin concentration in rat cortex using spatially-modulated structured light,”
In Vivo Optical Imaging of Brain Function, 2nd ed.CRC, Boca Raton, Florida
(2009). Google Scholar
J. R. Weberet al.,
“Noncontact imaging of absorption and scattering in layered tissue using spatially modulated structured light,”
J. Appl. Phys., 105
(10), 102028 http://dx.doi.org/10.1063/1.3116135 JAPIAU 0021-8979 Google Scholar
A. Bassiet al.,
“Detection of inhomogeneities in diffusive media using spatially modulated light,”
Opt. Lett., 34
(14), 2156
–2158
(2009). http://dx.doi.org/10.1364/OL.34.002156 OPLEDP 0146-9592 Google Scholar
T. A. Ericksonet al.,
“Lookup-table method for imaging optical properties with structured illumination beyond the diffusion theory regime,”
J. Biomed. Opt., 15
(3), 036013
(2010). http://dx.doi.org/10.1117/1.3431728 JBOPFO 1083-3668 Google Scholar
S. Belangeret al.,
“Real-time diffuse optical tomography based on structured illumination,”
J. Biomed. Opt., 15
(1), 016006
(2010). http://dx.doi.org/10.1117/1.3290818 JBOPFO 1083-3668 Google Scholar
C. D’Andrea,
“Fast 3D optical reconstruction in turbid media using spatially modulated light,”
Biomed. Opt. Express, 1
(2), 471
–481
(2010). http://dx.doi.org/10.1364/BOE.1.000471 BOEICL 2156-7085 Google Scholar
A. Mazharet al.,
“Structured illumination enhances resolution and contrast in thick tissue fluorescence imaging,”
J. Biomed. Opt., 15
(1), 010506
(2010). http://dx.doi.org/10.1117/1.3299321 JBOPFO 1083-3668 Google Scholar
A. Joshiet al.,
“Fully adaptive EM based fluorescence optical tomography from time-dependent measurements with area illumination and detection,”
Med. Phys., 33
(5), 1299
–1310
(2006). http://dx.doi.org/10.1118/1.2190330 MPHYA6 0094-2405 Google Scholar
N. Ducros,
“Multiple-view fluorescence optical tomography reconstruction using compression of experimental data,”
Opt. Lett., 36
(8), 1377
–1379
(2011). http://dx.doi.org/10.1364/OL.36.001377 OPLEDP 0146-9592 Google Scholar
V. Venugopal,
“Full-field time-resolved fluorescence tomography of small animals,”
Opt. Lett., 35
(19), 3189
–3191
(2010). http://dx.doi.org/10.1364/OL.35.003189 OPLEDP 0146-9592 Google Scholar
S. J. Madsenet al.,
“Photodynamic therapy of human glioma spheroids using 5-aminolevulinic acid,”
Photochem. Photobiol., 72
(1), 128
–134
(2000). http://dx.doi.org/10.1562/0031-8655(2000)072<0128:PTOHGS>2.0.CO;2 PHCBAP 0031-8655 Google Scholar
R. M. SutherlandR. E. Durand,
“Radiation response of multicell spheroids—an in vitro tumour model,”
Curr. Top. Radiat. Res. Q., 11
(1), 87
–139
(1976). CTRQAI 0011-3964 Google Scholar
V. A. MarkelJ. C. Schotland,
“Inverse problem in optical diffusion tomography, II. role of boundary conditions,”
J. Opt. Soc. Am. A Opt. Image Sci. Vis., 19
(3), 558
–566
(2002). http://dx.doi.org/10.1364/JOSAA.19.000558 JOAOD6 0740-3232 Google Scholar
|
|||||||||||||||||||||||||||||||||||