|
|
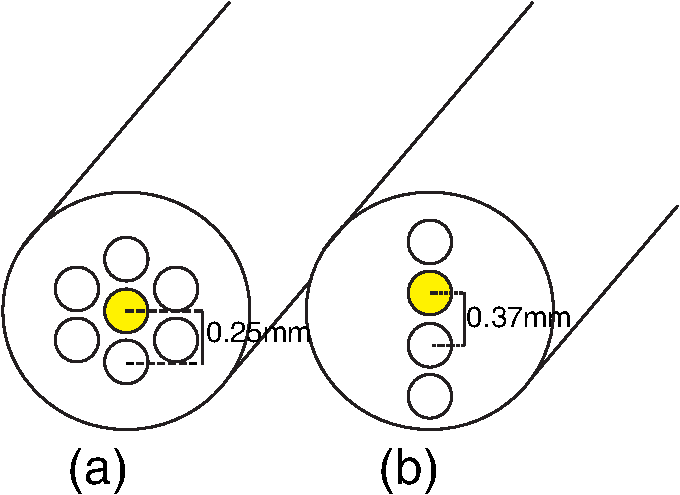
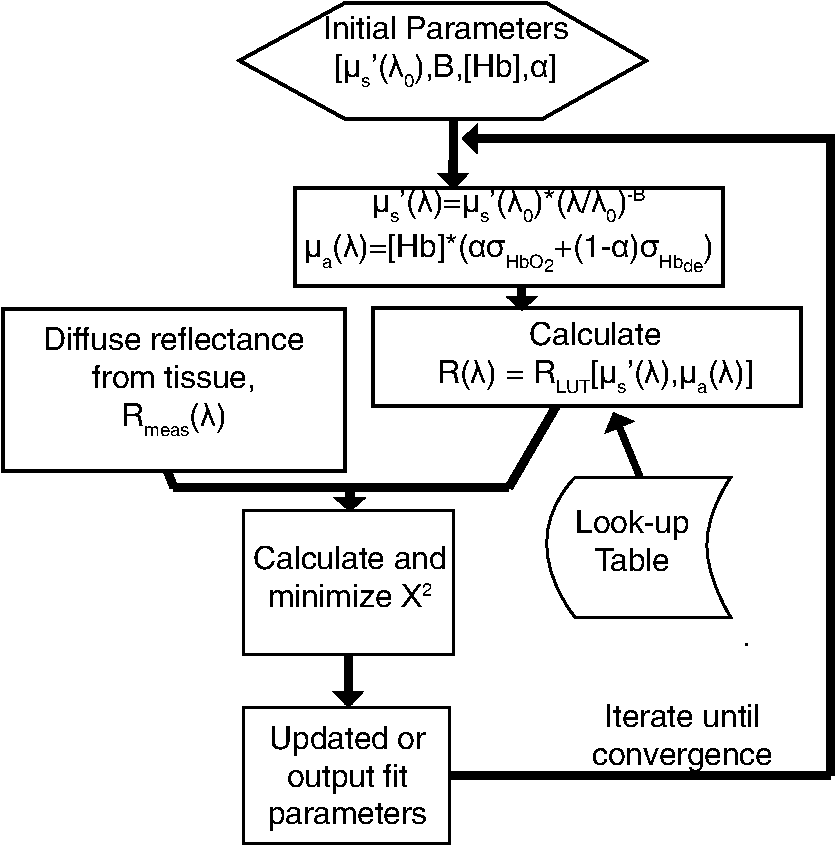
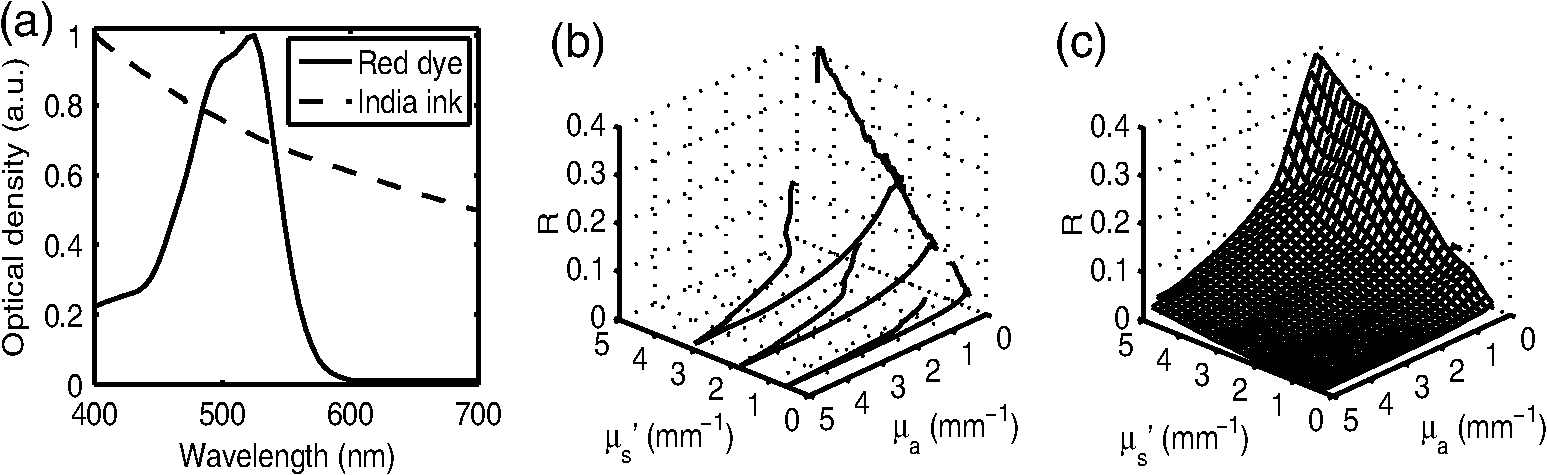
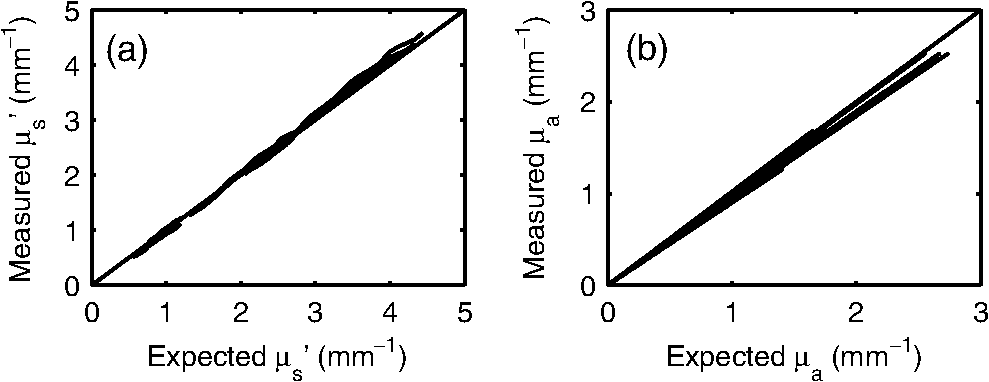
1.IntroductionOptical techniques such as diffuse optical spectroscopy (DOS) may offer a means to noninvasively and quantitatively characterize the structure and function of tissue. DOS uses optical fibers to deliver low-power, nonionizing light onto tissue. When light interacts with tissue, it undergoes primarily absorption and scattering events. Cells, cell organelles such as the mitochondria and nuclei, and collagen are the prominent sources of scattering whereas the primary absorbers are hemoglobin in the blood and melanin in the skin. By utilizing information regarding the wavelength-dependent absorption and scattering behavior of these tissue components, via analysis of the diffusely reflected light, it is possible to determine the structure and function of tissue. Specifically, this is accomplished by measuring two optical parameters: the reduced scattering coefficient (), which expresses the magnitude and power of scattering; and the absorption coefficient (), which is a function of absorber concentration in tissue. Researchers have used these optical parameters to determine differences between normal and malignant tissue,1–5 monitor response to therapy,6 and measure in situ drug concentrations in tissue.7,8 Considering that the strength of DOS lies in its ability to provide quantitative information, it is imperative to use models of light-tissue interaction that can accurately measure optical parameters. A number of approaches for this have been adopted by investigators: some use scalable, reasonably quick Monte-Carlo models,9 while others use theoretical models, such as the diffusion approximation for light propagation.10–12 These approaches work very well for the applications in which they are used. In the case of quantitative skin cancer diagnostics, a different model is required because of the high concentration of chromophores in confined spaces. Hemoglobin and melanin, for example, create a condition in skin where the absorption coefficient is nearly equal to the scattering coefficient, prohibiting the use of the diffusion approximation. Additionally, there is an added requirement of being accurate at short source-detector separations, because we wish to sample the most superficial layers of the skin. This restricts our ability to use models based on the diffusion approximation, because they are most valid in scattering dominant tissue and in systems employing fiber source-detector separations greater than 1 mm (typical mean free path in tissue in the visible wavelength range).10 We recently proposed and developed a LUT-based inverse model for the measuring of optical properties.13 The LUT is based on experimental measurements of diffuse reflectance standards of known optical properties. This way, the subtle imperfections of key system components are inherently accounted for in the model. Likewise, the changes introduced when using complex probe geometries, such as angled fiber probes14 or ball lens-coupled fiber probes,15 are inherent to the model, thereby eliminating systematic error related to modeling of the system components. Note that because the LUT is constructed experimentally, there are no geometrical or system attenuation assumptions that need to be made. Recently, our lab adapted the LUT-based approach to determine optical properties of turbid media using a structured illumination-based wide-field imaging technique,16 demonstrating the versatility of the method across both point and imaging platforms. The robustness of the technique warranted optimization and validation in an extended set of physiological conditions. We reported that the LUT was capable of accurately measuring optical properties of turbid media from diffuse reflectance acquired at short fiber separations and in highly absorbing tissue (). Low error was a result of meticulous measurement of a large matrix of calibration standards used to construct the LUT. The diligence required to make the entire array of calibration standards makes the initial process rather time consuming. Additionally, because each optical system has unique component imperfections, a corresponding LUT is required for each system. Therefore, reducing the time required to construct a LUT to a negligible amount would be of great value and allow researchers to take advantage of the accuracy and robustness of the model. The LUT developed as part of our initial study was comprised of 24 calibration standards. In this article, we present the development of a LUT based on the least possible number of calibration standards that still encompasses the same range of optical properties as the previous LUT. Additionally, we determined the accuracy of the LUT in measuring multiple parameters under different physiologically relevant and extreme conditions, including varying oxygen saturation of blood, varying scatter size, and the presence of multiple optical absorbers. Finally, we determined the accuracy of the LUT over source-detector (S-D) separations spanning a range of 0.37 to 1.5 mm. The ability of the LUT to accurately measure optical properties at short as well as larger S-D separations presents a significant tool for the noninvasive diagnosis of cancers that develop in stratified tissue. Such large S-D separations could help sample a range of depths in tissue, potentially classifying benign, superficial lesions from malignant, invasive lesions.17,18 2.Materials and Methods2.1.LUT System and Development2.1.1.Spectroscopy systemThe DOS system consisted of: a xenon flash lamp (Model: E6611, Hamamatsu) as the light source; a spectrograph (Model: SP2150i, Princeton Instruments) and camera (CoolSNAP™, Photometrics) as the spectrometer; and a fiber optic probe (, ; FiberTechOptica, Ontario, Canada) to illuminate and collect light. For the initial LUT optimization and validation studies, we used a six around one configuration, using the central fiber for illumination and the six peripheral fibers for collection. The S-D separation for this configuration was 0.25 mm (center to center distance), as shown in Fig. 1(a). For the studies involving large S-D separations we used a probe with fibers arranged in a linear array [Fig. 1(b)]. These fibers were spaced 0.37 mm apart, providing S-D separations in multiples of 0.37 mm, depending on the choice of the source and collection fiber. 2.1.2.LUT constructionThe basics of the LUT have been described in detail previously.13 Briefly, we generated the LUT by measuring the functional form of the reflectance using tissue phantoms with known optical properties (calibration set). The initial LUT was fabricated using phantoms containing polystyrene microspheres (; Polysciences, Warrington, PA) and India ink (Salis International) dissolved in water to simulate scattering and absorption, respectively. This LUT contained 24 phantoms, which was deemed to be sufficient for overlap in the wavelength-dependent scattering and absorption properties for different phantoms to cover the entire range of the LUT matrix. For example, for consecutive phantoms of increasing , the lowest of each subsequent phantom overlapped with the highest of the previous phantom. To fabricate the tissue phantoms for the calibration set, we began with purely scattering phantoms that corresponded to different reduced scattering coefficients at 630 nm, [, 1, 2, and ]. Subsequently, we added aliquots of absorbing dye (India ink) to each phantom to increase the absorption coefficient [ to ]. refers to the wavelength corresponding to the highest absorption coefficient of India ink. To determine the smallest number of calibration standards required to encompass the same range of optical properties as in the initial study, we used an absorber with absorbance values spanning the entire range of absorption coefficients with a single concentration. Using red dye as the absorber, we fabricated a new LUT that spanned the same range of optical properties as the previous one. As we did previously, we used Mie theory to calculate of the tissue phantoms. We measured the optical density of the red dye solution using a spectrophotometer (DU 720, Beckman Coulter) and calculated using Beer’s law. We initially fabricated three tissue phantoms with different scattering parameters [; ]. After measuring the reflectance, we added a single aliquot of red dye to each phantom to obtain varying absorption values [], that were consistent with previously used values. The volume and concentration of red dye added was calculated based on the desired final of the solution (). Because the addition of red dye dilutes the solution, a small change in was expected and accounted for when calculating the known of the tissue phantoms. The probe was placed in contact with the surface of the tissue phantoms, and white light spectra from the phantoms were recorded in the wavelength range of 400 to 700 nm. Reflectance was calculated by dividing white light intensity measured from the phantom by white light intensity from a reflectance standard (Spectralon, Labsphere). Both measurements were background corrected to account for CCD dark current and ambient light. For each phantom, we measured the background intensity with the light source shuttered and the probe in contact with the surface of the tissue phantom. The measurement-measurement variation in the diffuse reflectance spectra was less than 2 percent. 2.2.LUT Experiments2.2.1.Scattering and absorptionTo determine the accuracy of the optimized LUT model in measuring scattering and absorption, we fabricated a set of tissue simulating phantoms with known optical properties. As described for the construction of the LUT, we used Mie theory to generate the theoretical values for scattering and optical density for absorption. Accuracy was computed as the root mean square (RMS) error of the measured values for scattering and absorption as compared to the expected values. We used ferrous hemoglobin powder (H0267, Sigma, MO) as the absorber in our validation phantoms. We fabricated a matrix of tissue phantoms with hemoglobin (Hb) as the sole absorber and polystyrene beads () as the scatterer. We varied the reduced scattering coefficient and Hb concentration over a physiologically relevant range of values. Specifically, we used 6 different Hb concentrations (0, 0.5, 1, 1.5, 2, 2.5, and ) and three different values of reduced scattering coefficient [, 2, and ] to generate the validation matrix. We created a stock solution of of Hb and added aliquots to purely scattering phantoms to obtain the different Hb concentrations. These values correspond to and over the entire wavelength range. As mentioned earlier, we accounted for the stepwise decrease in scattering levels due to multiple additions of Hb. 2.2.2.Hemoglobin saturationTo determine the performance of the LUT model in measuring Hb saturation from a given spectrum, we measured reflectance spectra and partial pressure of oxygen at regular intervals of time as the partial pressure of oxygen decreased in a tissue phantom. Baker’s yeast (2.5 g) was added to water (10 mL, ) to create an active yeast solution and a trace amount (5 μl) was added to the phantom. A dissolved oxygen sensor (inO2, Innovative Instruments) was positioned near the center of the phantom, adjacent to the fiber optic probe. The current across the sensor tip was recorded with an NI 6802 DAQ board (National Instruments). A spectrum and its corresponding current measurement were simultaneously recorded every 2 sec for a total of 25 min. After data acquisition, the current reading was converted to using a simple linear relationship. We used both oxy- and deoxy-hemoglobin as part of the absorption equation. The absorption coefficient was calculated using the absorption cross-sections ( and ) of these chromophores as , where is the hemoglobin oxygen saturation and is the total hemoglobin concentration. To validate the measurement of Hb saturation, we followed the method described by Hull and Foster,19 wherein the measured saturation is fit to the Hill equation , where is the partial pressure due to oxygen, is the partial pressure of oxygen when is half maximum, and is the Hill coefficient. We calculated the expected saturation curve as a function of oxygen partial pressure using the subroutine described by Kelman.20 Based on this subroutine and the Hill equation, we calculated the expected values for the exponent () and the partial pressure of oxygen at which the Hb saturation is 50 percent (). The pH of the tissue phantom was 6.9 and the ambient temperature was 24°C. The partial pressure of was determined based on the level of present in air. 2.2.3.Presence of multiple absorbersMost tissue sites consist of multiple absorbers such as melanin, beta-carotene and hemoglobin. Therefore, we determined the accuracy of the LUT to measure scattering and absorber concentrations in the presence of more than 1 absorber. We fabricated two validation sets containing two absorbers—hemoglobin and blue food coloring dye. The absorber kept constant in each set was maximally concentrated to determine the measurement accuracy of the target absorber in the presence of a strong, secondary absorber. In one set, we maintained a constant hemoglobin concentration of and varied the concentration [0, 0.2, 0.4, 0.6, and ] of the coloring dye. For the second set, we maintained a constant dye concentration of 0.8 percent and varied the hemoglobin concentration (0, 0.5, 1.5, 2.5, and ). For both sets, we used 1 μm (diameter) polystyrene spheres as the scatterer. The values for and were and , respectively. 2.2.4.Effect of anisotropyWe used polystyrene microspheres of different sizes to simulate changes in anisotropy in our third validation experiment. We fabricated validation sets with the same optical properties as that described in Sec. 2.2. However, each validation set contained microspheres of a specific size (, 0.09, 0.175, 0.23, and 0.5 μm) as the scatterer, corresponding to a wide range of anisotropy values [, 0.4, 0.75, 0.8, 0.9, respectively]. Measurement error was again determined by calculating the RMS error of the deviation from the theoretical value. 2.2.5.Depth sensitivityThe validation experiments described in the previous section involve the shortest S-D distance used in these studies (0.25 mm). The LUT is system specific: Altering the S-D separation or geometry warrants creating a new LUT. To determine the accuracy of the LUT at different S-D separations, we generated LUTs for four additional separation distances (0.37, 0.74, 1.11, and 1.48 mm). We did not investigate larger distances due to declining signal to noise of the diffusely reflected light. As in the previous cases, we tested these on the same set of validation phantoms. In addition to testing the accuracy of these LUTs, we also determined the sampling depth for each set of S-D separations. These experiments were performed to present the advantage of using several S-D separations to sample multiple depths in tissue. To determine the sampling depth, we measured the depth-sensitive response of a fiber optic probe with detector fibers spaced at multiples of 0.37 mm from the source fiber (, 0.74, 1.11, 1.48, 1.85 mm). To measure the depth response, we fabricated tissue-simulating phantoms using 10 percent intralipid (a fat emulsion liquid) to simulate scattering and hemoglobin to simulate absorption by blood. The scattering and absorption properties of the phantom were and (). The bottom of the vessel containing the phantom was painted flat black to absorb any incident light on the bottom surface. The fiber probe was placed within the tissue phantom normal to and in contact with the bottom surface (). The probe was then translated vertically with a motorized translational stage, and reflectance measurements were collected at intervals of 3.5 μm. By processing the measured reflectance as a function of the depth at which it was measured, we can determine the mean sampling depth of the probe. 2.3.LUT-Based Inverse ModelTo fit the diffuse reflectance spectra and measure the optical properties, we implemented a nonlinear optimization fitting routine (average fit time of a few seconds). A basic description of the fit procedure is presented as a flowchart in Fig. 2. We constrained the reduced scattering coefficient to the form where . Depending on the type of tissue sampled and the wavelength range of interest, the expression for can be modified to include the absorption cross-sections for multiple absorbing chromophores. The exponent () is often described as the scattering power21 and has been correlated to the scatterer size,22 anisotropy, and the functional refractive index correlation function.23 The hemoglobin oxygen saturation, , is determined from the measured , as shown in the equation in Fig. 2. 3.Results3.1.Optimized LUT DevelopmentWe determined the minimum number of calibration standards required to construct the LUT and still span the same range optical properties previously mentioned. We used six calibration standards total, three with absorber and three without. We arrived at this number by choosing calibration standards at the minimum and maximum scattering and absorption values desired. Standards used between these values (two in this case) were incorporated for sufficient wavelength overlap of all standards. Figure 3(a) presents the absorption spectra of India ink and red dye. As is evident from this plot, a single concentration of red dye can span the equivalent of multiple India ink phantoms. Figure 3(b) shows as a function of and for all six phantoms used in the LUT development. Because the spectral dependence of reflectance [] is a result of the wavelength-dependent optical properties, and , we can simply index reflectance measured at each wavelength to its known scattering and absorption properties. We used linear nearest neighbor triangle-based interpolation (griddata in MATLAB®) on the sparse matrix of data points to create a grid of uniformly spaced data points of and , resulting in the LUT for diffuse reflectance [Fig. 3(c)]. The limits of the LUT correspond to the range of and over which diffuse reflectance spectra were recorded. 3.2.LUT Experiments3.2.1.Scattering and absorption measurementsTo compare the accuracy of the optimized LUT to the original, we measured the optical properties for a set of tissue phantoms with known optical properties, as described previously. The optimized LUT inverse model measured the reduced scattering and absorption coefficients over a wide range [ and ] with excellent mean RMS errors (calculated across all wavelengths and phantoms) of 2.5 and 4 percent, respectively. This was achieved using only six calibration standards; one-quarter of what was initially required. Figure 4 shows the measured and for the entire validation set. 3.2.2.Hemoglobin saturation measurementsThe measured hemoglobin oxygen saturation was in good agreement with that predicted by theory. Figure 5(a) presents reflectance spectra measured from the phantom in oxygenated and deoxygenated states. Two oxygenated spectra are presented to indicate the subtle decrease in reflectance that occurred immediately after the addition of yeast. The oxygen saturation () was allowed to vary between and 1 in the inverse model and was accurately measured over the entire saturation range with errors less than 5 percent [Fig. 5(b)]. The expected values of and for the phantom were 2.61 and 26.11, respectively. Based on the measured values of Hb saturation, the measured values for and were within 5 percent of the expected value (2.57 and 25.76, respectively). Figure 5(c) demonstrates the changes in measured oxy and deoxy-hemoglobin concentrations as a function of phantom . 3.2.3.Effect of multiple absorbersThe presence of multiple absorbers has negligible effect on accuracy of measuring specific absorber concentrations. Figure 6(a) shows reflectance spectra and corresponding fits from phantoms containing only one of each absorber. The reflectance spectrum shown in Fig. 6(b) illustrates the effect of two absorbers on the reflectance spectrum, with the -bands (542 and 577 nm) of oxygenated hemoglobin superimposed on the larger absorption trough of blue dye. The LUT fit shows excellent agreement with the data. Figure 5(c) and 5(d) presents the measured over all phantoms and all wavelengths in both sets of validation phantoms. The data indicate good agreement between the expected and measured values of the added absorber. The LUT model measured the concentration of both absorbers with a mean error of less than 5 percent. The error in scattering in both validation sets was less than 5 percent (data not shown). Fig. 6(a) Representative fits of LUT model to reflectance spectra from phantoms containing hemoglobin or blue dye exclusively and (b) a phantom containing both absorbers. (c) Expected versus measured for the blue dye while holding the concentration constant. (d) Expected versus measured for hemoglobin while holding the blue dye concentration constant. The diagonal line in (c) and (d) indicates perfect agreement. 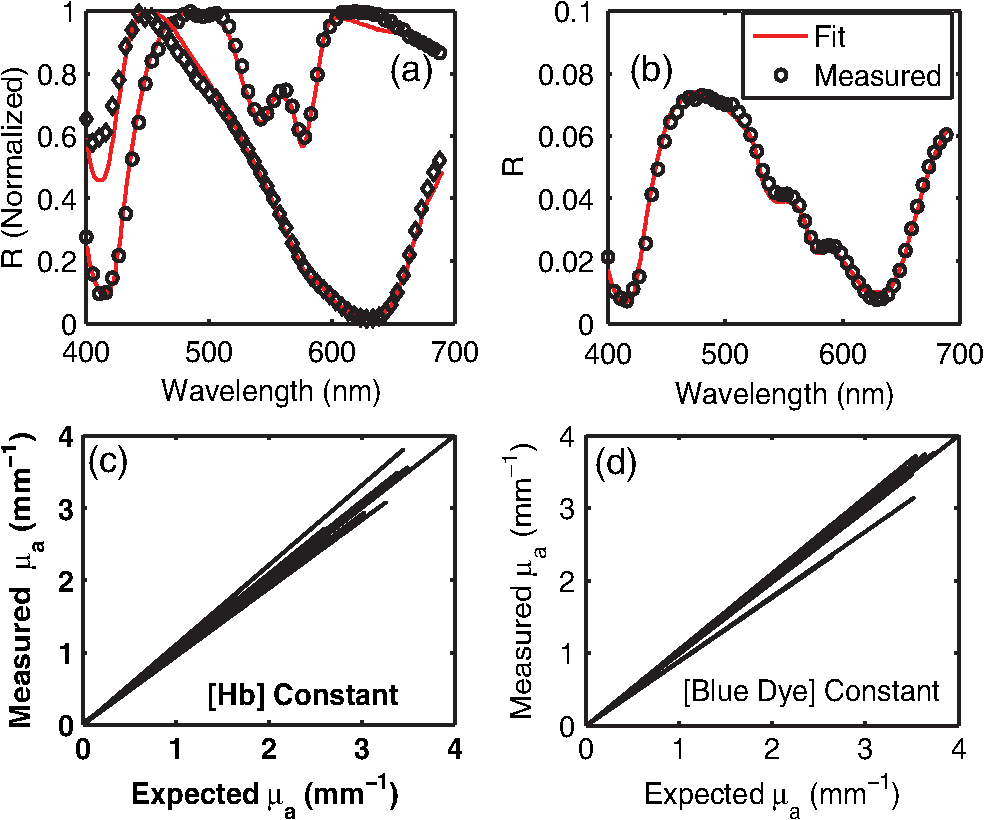 3.2.4.Effect of anisotropyWe found the measured (scattering slope) to be in good agreement with theoretical values generated using Mie theory. Additionally, we determined that particle sizes corresponding to a physiologically relevant range of anisotropy values do not introduce error in measuring and . Each reflectance spectrum shown in Fig. 7(a) has the same optical properties, with and . As the sphere size decreases, the anisotropy decreases as well, indicating an increased contribution of backscattered light in the reflectance. This additional reflectance contribution manifests as an increase in the power law slope, . However, we noticed that the smallest sphere radius of 0.045 μm did not conform to this intuitive trend. On the contrary, the magnitude of reflectance was far lower than that for other sphere sizes. Fig. 7(a) Example fits showing changes in reflectance with variations in bead size (, 0.09, 0.175, 0.23, and 0.5 μm). (b) Theoretical (solid line) and measured (shapes) dependence of on as a function of bead size. (c) Error in recovering scattering and absorption properties as a function of anisotropy. Error bars represent one standard deviation. 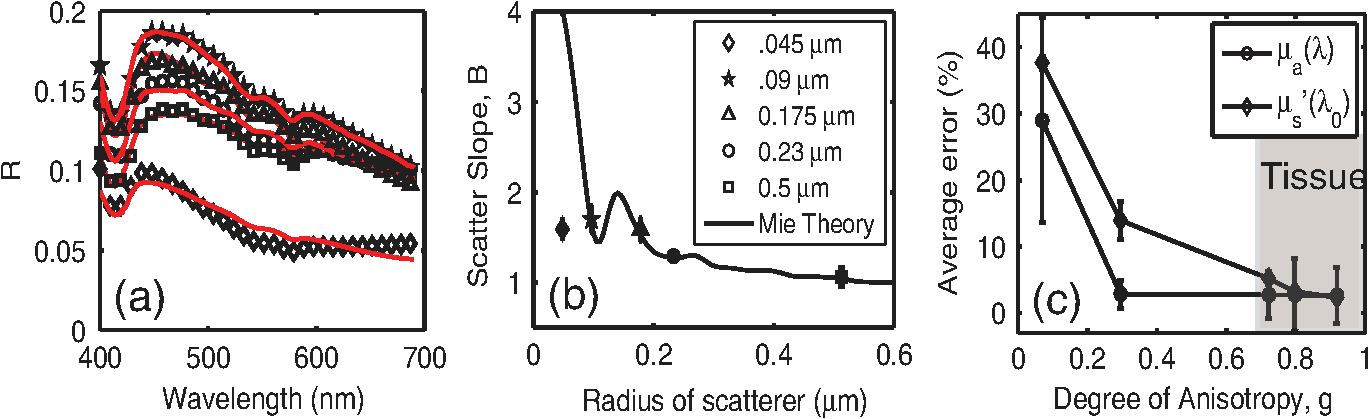 Based on the theoretical values of calculated using Mie theory, we measured the scattering slope () for several sphere diameters by fitting generated from Mie theory to the equation and generated a theoretical curve for as a function of sphere radius [Fig. 7(b)]. The measured values of from the different phantom sets are also plotted and indicate excellent agreement with the expected value of , with the exception of the smallest sphere size. We suspect this anomaly is inherent to the short source-detector separation used; the small sample volume will be considerably sensitive to changes in anisotropy. Beginning with the next set of validation phantoms (), the LUT provided accurate measures of the optical properties. For , the LUT measured and with errors of 15 and 4%, respectively. For , 0.23 and 0.5 μm, all of which correspond to , the LUT measured both and with errors less than 5 percent. 3.2.5.Effect of source-detector separation distanceThe measured mean sampling depth was linearly related to the source-detector separation. Figure 8(a) shows the normalized reflectance at one wavelength (430 nm) for each S-D separation, corresponding to the cumulative distribution function (CDF) at that wavelength. The curve is constructed from reflectance values measured as the probe is drawn up from the bottom of the container. As the probe is translated vertically away from the bottom, the probe begins to sample light scattered in the limited volume beneath the probe, and the reflectance increases until it asymptotically approaches its maximum value, at which point the probe is no longer sampling the bottom surface of the phantom. The points at which the probe first registers reflected light in the collection fiber and when it no longer detects any change in reflectance with axial translation represent the approximate lower and upper limits of light travel (‘banana curve’), respectively. To determine the mean sampling depth, we take the derivative of the CDF with respect to elevation to obtain the probability distribution function [PDF; Fig. 8(b)]. The maximum of the PDF represents the elevation where the majority of the photons are located. The squares in Fig. 8(c) represent the elevation for which the PDF was at its maximum, and thus indicate the mean sampling depth; the upper and lower bars represent the sampling depths at which 90 and 10 percent of the reflected light was detected, respectively. In this way, we can measure the mean sampling depth and the upper and lower bounds for each S-D separation. The results clearly indicate that the sampling depth increases with increasing S-D separation, as is expected. The shortest S-D separation is sensitive to changes at the tissue surface with a mean sampling depth of approximately 0.40 mm with sensitivity up to approximately 0.70 mm. On the other hand, the longest S-D separation had a mean sampling depth of 1 mm with sensitivity up to 1.5 mm. Fig. 8Measures of the sampling depth for the probe design shown in Fig. 1 with S-D separations of 0.37, 0.74, 1.11, 1.48, and 1.85 mm. (a) Plot of the normalized reflectance at one wavelength () as the probe is translated vertically starting at the bottom of the tissue phantom. (b) Derivative of (a) with respect to depth indicating sampling volume for each S-D separation measured. (c) Mean sampling depth versus S-D separation (error bars represent elevations corresponding to 10 and 90 percent of the maximum reflectance detected). and for the tissue phantom at 430 nm were 0.4 and , respectively. 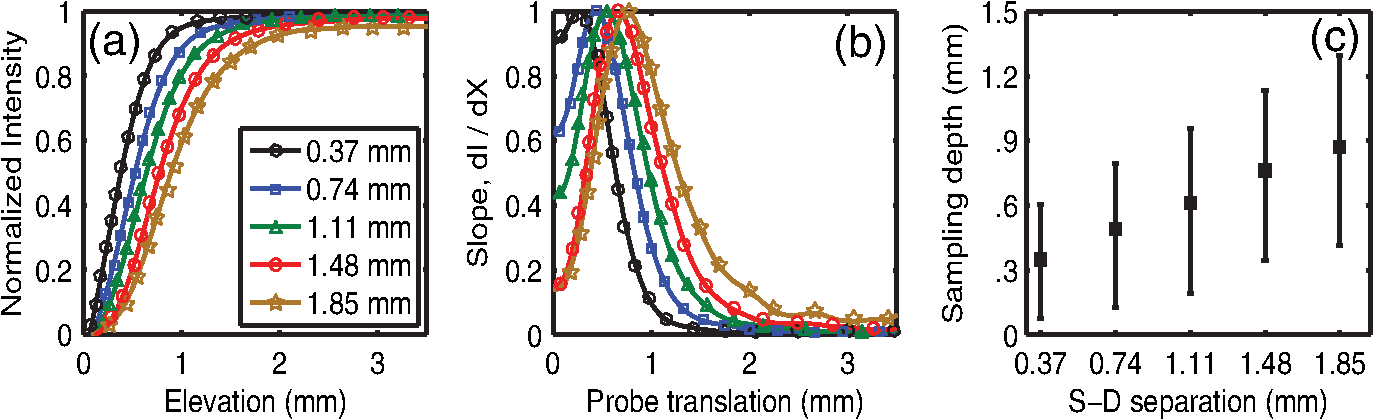 As the S-D separation is varied, the overall shape of the LUT is changed. Figure 9 presents LUTs developed for different S-D separations. The LUT is no longer monotonically decreasing for the same range of optical properties at source detector separations beyond 0.40 mm. As the S-D separation increases, the reflectance increases with scattering but appears to plateau at much lower values of scattering. For example, at 0.37 mm [Fig. 9(a)], the reflectance is still monotonically increasing as a function of scattering at the highest value of scattering reported; however, larger S-D separation distances [Fig. 9(b) and 9(c)] result in reflectance that is no longer monotonic as a function of scattering. Fig. 9Representative look-up tables for multiple source detector separations: (a) 0.37 mm, (b) 0.74 mm, and (c) 1.11 mm. (d) Average error in measuring scattering and absorption properties of tissue phantoms as a function of S-D separation. Errors bars represent one standard deviation. The validation phantoms were constructed over the same range of and as described in Sec. 2.1. 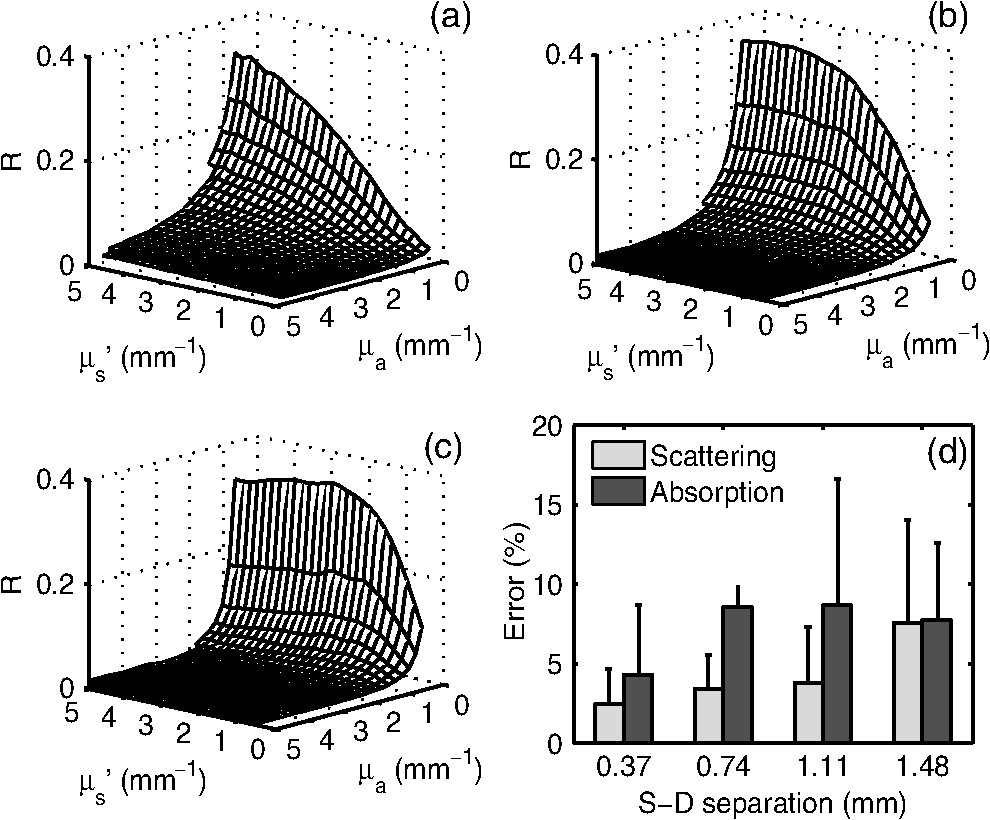 We fit the reflectance spectra measured from the validation phantoms to the respective LUTs and found that the errors over all S-D separations were less than 15 percent [Fig. 9(d)]. Although the average scattering error increases as the S-D separation increases, the upper limit of the average error across the entire data set is less than 10 percent. The error in estimating absorption properties remained nearly constant with change in S-D separation. 4.DiscussionThis work presents a detailed description of the development and performance of a lookup table-based inverse model for determining the optical properties of tissue. This paper builds on a previous study from our lab describing the general methodology involved in constructing a lookup table for estimating optical properties of tissue. An examination of the initial 24 phantom-LUT showed that only six phantoms were required to span the range of scattering values (-axis) due to the large range of wavelengths used. However, several phantoms were required to span the absorption values (-axis) because of the flat absorption profile of India ink. We determined that we could span a larger range of absorption coefficients by simply using a Gaussian-like absorber. Therefore, we used red food coloring dye (McCormick, Evanston, IL) instead of India ink for the optimized LUT. We measured the absorber extinction coefficients prior to each experiment involving calibration or validation phantoms. This was done to ensure that any change in the behavior of the stock solution was adequately represented in the calibration and validation phantoms. We determined that we could maintain the fidelity of our original 24 calibration standard matrix LUT with only six calibration standards. The LUT can be adapted to potentially any probe geometry and incorporates the exact system response of the instrument used for light illumination and detection. Several sources of error present in the original LUT have been significantly reduced in the optimized LUT, which can be attributed to improved experimental technique and the enhanced model collectively. We decreased systematic error by recording a background noise spectrum for each phantom and subtracted it from its white light intensity spectrum. Additionally, we measured the OD of the stock solution of the absorbing chromophore prior to each experiment instead of using previously recorded extinction data. Incorporating these corrections in the LUT fabrication process helps significantly reduce the error in recovering optical properties. The negligible time required to construct the LUT makes it a great candidate for anyone utilizing DOS and requiring a quick and accurate estimation of specimen optical properties. We have also shown, for the first time to our knowledge, validation over a wide range of scatter sizes. In addition, we have demonstrated that the LUT accurately measures optical properties at S-D separations ranging from 250 μm to 1.48 mm. The errors in measuring scattering and absorption were marginal (typically less than 5%) in the remaining tested circumstances (multiple absorbers and varied oxygen saturation), indicating the robustness of the model. The ability to accurately determine the hemoglobin oxygen saturation is of vital importance because tumor oxygenation has been shown to be a good indicator of disease prognosis.24 Indeed, researchers have used DOS and diffuse optical tomography (DOT) to predict long-term response in preclinical models and patients based on oxygen saturation of hemoglobin.25,26 The LUT accurately measured the hemoglobin saturation to within 4 percent of the expected value, again indicating the robustness of the model. We found the magnitude of the reflectance for the deoxygenated state to be consistently less compared to the initial oxygenated state. The source of this is most likely an increase in absorbance from the addition of yeast because this change occurred immediately after the yeast was added to the phantom. Another consideration is a subtle change in the index of refraction that occurs due to degassing the solution. The change in index of refraction would be approximately according to Harvey et al.,27 resulting in a change in reflectance similar in magnitude. This subtle change was much less than the systematic error and was thus deemed negligible. We validated the LUT model using tissue phantoms containing different sized scatterers. To the best of our knowledge, this represents the first comprehensive validation of a model on phantoms containing different scatter sizes. We demonstrated that the LUT provides excellent measures of scattering and absorption, even at extremely low scatter sizes (). However, for the lowest scatter size of , the reflectance measured with our optical probe was significantly lower than the other phantom sets although each set had the same theoretical optical properties. At this low value for scatter size, is approximately 0.1, indicating a high degree of backscatter as well as higher proportion of high-angle scattering. This indicates that several photons could have exited the phantom at distances extremely close to the source fiber, thereby reducing the reflectance signal detected by the collection fiber. It is important to note that values in normal and cancerous tissue are consistently higher than 0.6 and typically in the range of 0.8 to 0.95.28 We also studied the effect of source-detector separation on the accuracy of the LUT. It is well known that the accuracy of diffusion models improves at distances larger than 1 mm.12 Therefore, our intent was to compare the performance of the LUT at distances ranging from our current S-D separation to well over 1 mm. The LUT consistently measured both absorption and scattering parameters with average errors less than 10 percent, which is comparable to error present when using the diffusion approximation.10 However, we did notice an increase in scattering error as the S-D separation increased, whereas the absorption error remained fairly constant. This could be attributed to a decrease in signal to noise ratio at larger S-D separations. Also, at larger S-D separations, an increase in did not necessarily dictate an increase in reflectance. This occurs because at larger S-D separations the collection fiber is primarily detecting light at low scatter angles and photons that have traveled a longer path. As the increases, the majority of photons will exit the phantom before ever reaching the collection fiber, thereby decreasing the reflectance. At the largest S-D separation that was tested, reflectance reached a plateau and eventually decreased with increasing scattering. These results are consistent with the studies conducted by Mourant et al.29 and Kumar et al.30 that identified a ‘magic’ S-D separation where reflectance was nearly insensitive to scattering and could thus provide excellent measures of absorption in addition to being ideal for near infrared (NIR) wavelength sampling of tissue. We also measured the average sampling depth of each S-D separation. As expected, our data show an increase in sampling depth with an increase in S-D separation. Based on such experiments, it may be possible to select nonoverlapping S-D separations that could potentially be used to sample a distinct range of depths in tissue. Depth resolved quantitative spectroscopy could be crucial to help distinguish invasive, malignant lesions from benign, superficial lesions. AcknowledgmentsFunding for this research was provided in part by the National Cancer Institute, National Center for Research Resources, and the National Institute for Biomedical Imaging and Bioengineering at the National Institutes of Health (Grant Nos. R01CA132032 and R21EB015892). ReferencesN. Rajaramet al.,
“Pilot clinical study for quantitative spectral diagnosis of non-melanoma skin cancer,”
Lasers. Surg. Med., 42
(10), 716
–727
(2010). http://dx.doi.org/10.1002/lsm.21009 LSMEDI 0196-8092 Google Scholar
V. T. Changet al.,
“Quantitative physiology of the precancerous cervix in vivo through optical spectroscopy,”
Neoplasia, 11
(4), 325
–332
(2009). Google Scholar
J. Q. Brownet al.,
“Quantitative optical spectroscopy: a robust tool for direct measurement of breast cancer vascular oxygenation and total hemoglobin content in vivo,”
Cancer Res., 69
(7), 2919
–2926
(2009). http://dx.doi.org/10.1158/0008-5472.CAN-08-3370 CNREA8 0008-5472 Google Scholar
Z. Volynskayaet al.,
“Diagnosing breast cancer using diffuse reflectance spectroscopy and intrinsic fluorescence spectroscopy,”
J. Biomed. Opt., 13
(2), 024012
(2008). http://dx.doi.org/10.1117/1.2909672 JBOPFO 1083-3668 Google Scholar
A. Amelinket al.,
“Non-invasive measurement of the morphology and physiology of oral mucosa by use of optical spectroscopy,”
Oral Oncol., 44
(1), 65
–71
(2008). http://dx.doi.org/10.1016/j.oraloncology.2006.12.011 EJCCER 1368-8375 Google Scholar
B. Kruijtet al.,
“Monitoring ALA-induced PpIX photodynamic therapy in the rat esophagus using fluorescence and reflectance spectroscopy,”
Photochem. Photobiol., 84
(6), 1515
–1527
(2008). http://dx.doi.org/10.1111/php.2008.84.issue-6 PHCBAP 0031-8655 Google Scholar
I. J. BigioJ. R. Mourant,
“Ultraviolet and visible spectroscopies for tissue diagnostics: fluorescence spectroscopy and elastic-scattering spectroscopy,”
Phys. Med. Biol., 42
(5), 803
–814
(1997). http://dx.doi.org/10.1088/0031-9155/42/5/005 PHMBA7 0031-9155 Google Scholar
I. J. BigioJ. R. MourantG. Los,
“Noninvasive, in-situ measurement of drug concentrations in tissue using optical spectroscopy,”
J. Gravit. Physiol., 6
(1), P173
–175
(1999). Google Scholar
G. M. PalmerN. Ramanujam,
“Monte Carlo-based inverse model for calculating tissue optical properties. Part I: theory and validation on synthetic phantoms,”
Appl. Opt., 45
(5), 1062
–1071
(2006). http://dx.doi.org/10.1364/AO.45.001062 APOPAI 0003-6935 Google Scholar
T. J. FarrellM. S. PattersonB. Wilson,
“A diffusion theory model of spatially resolved, steady-state diffuse reflectance for the noninvasive determination of tissue optical properties in vivo,”
Med. Phys., 19
(4), 879
–888
(1992). http://dx.doi.org/10.1118/1.596777 MPHYA6 0094-2405 Google Scholar
E. HullT. Foster,
“Steady-state reflectance spectroscopy in the approximation,”
J. Opt. Soc. Am. A, 18
(3), 584
–599
(2001). http://dx.doi.org/10.1364/JOSAA.18.000584 JOAOD6 0740-3232 Google Scholar
A. KienleM. S. Patterson,
“Improved solutions of the steady-state and the time-resolved diffusion equations for reflectance from a semi-infinite turbid medium,”
J. Opt. Soc. Am. A, 14
(1), 246
–254
(1997). http://dx.doi.org/10.1364/JOSAA.14.000246 JOAOD6 0740-3232 Google Scholar
N. RajaramT. H. NguyenJ. W. Tunnell,
“Lookup table-based inverse model for determining optical properties of turbid media,”
J. Biomed. Opt., 13
(5), 050501
(2008). http://dx.doi.org/10.1117/1.2981797 JBOPFO 1083-3668 Google Scholar
L. Niemanet al.,
“Optical sectioning using a fiber probe with an angled illumination-collection geometry: evaluation in engineered tissue phantoms,”
Appl. Opt., 43
(6), 1308
–1319
(2004). http://dx.doi.org/10.1364/AO.43.001308 APOPAI 0003-6935 Google Scholar
R. A. Schwarzet al.,
“Ball lens coupled fiber-optic probe for depth-resolved spectroscopy of epithelial tissue,”
Opt. Lett., 30
(10), 1159
–1161
(2005). http://dx.doi.org/10.1364/OL.30.001159 OPLEDP 0146-9592 Google Scholar
T. A. Ericksonet al.,
“Lookup-table method for imaging optical properties with structured illumination beyond the diffusion theory regime,”
J. Biomed. Opt., 15
(3), 036013
(2010). http://dx.doi.org/10.1117/1.3431728 JBOPFO 1083-3668 Google Scholar
E. M. C. Hillmanet al.,
“Laminar optical tomography: demonstration of millimeter-scaledepth-resolved imaging in turbid media,”
Opt. Lett., 29
(14), 1650
–1652
(2004). http://dx.doi.org/10.1364/OL.29.001650 OPLEDP 0146-9592 Google Scholar
C. Zhuet al.,
“Use of a multiseparation fiber optic probe for the optical diagnosis of breast cancer,”
J. Biomed. Opt., 10
(2), 024032
–024013
(2005). http://dx.doi.org/10.1117/1.1897398 JBOPFO 1083-3668 Google Scholar
E. L. HullT. H. Foster,
“Noninvasive near-infrared hemoglobin spectroscopy for in vivo monitoring of tumor oxygenation and response to oxygen modifiers,”
Proc. SPIE, 2979 355
–364
(1997). http://dx.doi.org/10.1117/12.280264 Google Scholar
G. R. Kelman,
“Digital computer subroutine for the conversion of oxygen tension into saturation,”
J. Appl. Physiol., 21
(4), 2
(1966). JAPYAA 0021-8987 Google Scholar
G. ZoniosA. Dimou,
“Light scattering spectroscopy of human skin in vivo,”
Opt. Express, 17
(3), 1256
–1267
(2009). http://dx.doi.org/10.1364/OE.17.001256 OPEXFF 1094-4087 Google Scholar
J. R. Mourantet al.,
“Predictions and measurements of scattering and absorption over broad wavelength ranges in tissue phantoms,”
Appl. Opt., 36
(4), 949
–957
(1997). http://dx.doi.org/10.1364/AO.36.000949 APOPAI 0003-6935 Google Scholar
J. D. RogersL. R. ÇapogluV. Backman,
“Nonscalar elastic light scattering from continuous random media in the Born approximation,”
Opt. Lett., 34
(12), 1891
–1893
(2009). http://dx.doi.org/10.1364/OL.34.001891 OPLEDP 0146-9592 Google Scholar
M. Hockelet al.,
“Association between tumor hypoxia and malignant progression in advanced cancer of the uterine cervix,”
Cancer Res., 56
(19), 4509
–4515
(1996). CNREA8 0008-5472 Google Scholar
K. Vishwanathet al.,
“Using optical spectroscopy to longitudinally monitor physiological changes within solid tumors,”
Neoplasia, 11
(9), 889
–900
(2009). Google Scholar
U. Sunaret al.,
“Hemodynamic responses to antivascular therapy and ionizing radiation assessed by diffuse optical spectroscopies,”
Opt. Express, 15
(23), 15507
–15516
(2007). http://dx.doi.org/10.1364/OE.15.015507 OPEXFF 1094-4087 Google Scholar
A. HarveyS. KaplanJ. Burnett,
“Effect of dissolved air on the density and refractive index of water,”
Int. J. Thermophys., 26
(5), 1495
–1514
(2005). http://dx.doi.org/10.1007/s10765-005-8099-0 IJTHDY 0195-928X Google Scholar
J. R. Mourantet al.,
“Mechanisms of light scattering from biological cells relevant to noninvasive optical-tissue diagnostics,”
Appl. Opt., 37
(16), 3586
–3593
(1998). http://dx.doi.org/10.1364/AO.37.003586 APOPAI 0003-6935 Google Scholar
J. R. Mourantet al.,
“Measuring absorption coefficients in small volumes of highly scattering media: source-detector separations for which path lengths do not depend on scattering properties,”
Appl. Opt., 36
(22), 5655
–5661
(1997). http://dx.doi.org/10.1364/AO.36.005655 APOPAI 0003-6935 Google Scholar
G. KumarJ. Schmitt,
“Optimal probe geometry for near-infrared spectroscopy of biological tissue,”
Appl. Opt., 36
(10), 2286
–2293
(1997). http://dx.doi.org/10.1364/AO.36.002286 APOPAI 0003-6935 Google Scholar
|