

|
|
1.IntroductionOptical contrast agents have been promoted to allow for an estimation of perfusion via dynamic measurements1 and may be used for imaging of pathology via specific molecular probes non-invasively as well.2 In animal studies, both options have been explored analyzing the fluorescence of different contrast agents, while in humans mostly the optical contrast agent indocyanine green (ICG) has been employed to assess brain perfusion by non-invasive optical approaches.3–7 While most studies in humans rely on the absorption properties of ICG, we have previously shown that also laser-induced fluorescence originating from an ICG bolus in the adult human brain can be detected8 non-invasively at the head surface. The results are promising since the fluorescence signal yielded a superior signal-to-noise ratio9 and higher sensitivity related to the inflow of ICG10 when compared to the diffuse reflectance signal. The major challenge of all non-invasive optical measurements, which is the differentiation between truly cerebral and extracerebral tissue contribution, has not been sufficiently solved for fluorescence measurements. The methods developed for determining depth-resolved absorption changes from changes in the time-of-flight distributions11 or from changes in their moments12 cannot be applied since fluorescence is generated in the presence of the dye only. Here we propose a method to separate fluorescence signals from the scalp and the brain based on measured distributions of times of arrival (DTA)8 of fluorescence photons. We describe an approach based on a linear equation and sensitivity functions that can be derived directly from the measurement without prior knowledge of background optical properties of the head. 2.Experimental SetupThe measurements were performed with a prototype time-domain brain imager described in Ref. 3 that was modified for fluorescence detection. Two detection channels were equipped with longpass filters (793RLP, TFI Technologies) to suppress excitation light and red-sensitive photomultiplier tubes (R7400-20, Hamamatsu Photonics). Continuous sequences of DTAs were recorded with a collection time of 0.2 sec per DTA. The instrumental response function (IRF) was measured according to Ref. 13. In-vivo measurements were performed on the forehead and over the left motor area of two healthy male volunteers resting in supine position (43 and 37 years). ICG was diluted in water and manually injected into the cubital vein within 2 sec. The dose of ICG was varied within the range from 1 to 6 mg. Up to six injections were applied per session. The experimental procedure was approved by the local ethical committee. The volunteers were two of the authors (Obrig and Steinbrink). 3.Algorithm and Data AnalysisHere we describe our method to decompose fluorescence DTAs into the contributions from the scalp and from the brain. Note that in the following two time scales are considered, (i) microtime, i.e., a timescale of ps to ns denoted by relevant for the DTAs, (ii) macrotime, i.e., a timescale of seconds to minutes on which the fluorochrome concentration changes during the bolus passage. Thus, the DTAs are functions of the microtime as well as the macrotime , i.e., the measured fluorescence signal can be expressed as . We assume a simple two-compartment model, i.e., the fluorochrome can be present in the brain (index ) and in the scalp (index ). It is assumed that the total time-resolved fluorescence arriving at the detector can be represented by the sum of the two contributions from both compartments as follows: The contributions from the brain and scalp are taken as products in which the microtime and macrotime dependencies are separated. The coefficients and are the macrotime courses of fluorescence from scalp and brain. and denote microtime-dependent sensitivity functions which describe the DTAs for fluorescence generated in the corresponding compartments. The factors are assumed to be proportional to the concentration, whereas the are assumed to be independent of fluorochrome concentration. Note that absolute magnitudes of the factors are not known. A similar approach is often used in continuous wave fluorescence tomography. In many publications (e.g., Ref. 14) the sensitivities are determined via photon migration models. For our analysis we developed a novel approach, where the sensitivity functions are extracted directly from the in-vivo measurement assuming that the contribution of one of the two compartments is negligible during certain parts of the bolus transit through the head (macrotime ). This assumption, based on physiological knowledge, is sketched in Fig. 1. The rationale behind the assumption is the physiological difference in bolus arrival time in the brain compared to the extracerebral tissue.6 Hence, the inflow of the dye into the brain tissue [, “brain-only” period 2 in Fig. 1(a)] is dominant during the early bolus phase, and the contribution from the scalp can be neglected (); thus Fig. 1(a) Time course of the integral and mean time of flight of fluorescence distributions of times of arrival (DTAs) after a dye injection at . Dark gray areas mark the periods in which background (1) and sensitivity functions pertaining to brain (2) and scalp (3) are calculated. (b) Exemplary fluorescence DTA at recorded in vivo and instrument response function (IRF).  Immediately after the first bolus passage there is virtually no dye in the sampled brain tissue, and fluorescence is assumed to originate from the scalp only [Fig. 1(a), period 3 where ]; thus To find the corresponding periods in the macrotime we used the time courses of the integral and mean time of flight of DTAs. The latter depends on the depth at which fluorescence is generated.15 Consequently, we identified periods corresponding to and by searching for the local maximum and minimum of , respectively. The sensitivity functions were then taken as mean DTAs in these regions. To suppress the influence of ICG which remained in the tissue from previous injections we subtracted a background DTA calculated shortly before the bolus [period 1 in Fig. 1(a)]. For each time , Eq. (1) represents an over-determined system of several hundred linear equations, corresponding to the number of time channels on the microtime scale, . It is solved in the sense of a least-squares fit using the mrdivide operator of Matlab (Mathworks Inc.). As a result of such analysis for all times , the time courses of the factors and are obtained. The partial contributions from scalp and brain to -integrated fluorescence intensity can be defined as and with the total fluorescence . 4.Results and DiscussionFigure 2 shows the sensitivity functions (upper row) and the time courses of the total fluorescence intensity and the contributions from brain and scalp (lower row). The three cases I to III represent typical scenarios found within a total of 34 ICG injections performed in a number of sessions. Fig. 2Decomposition of indocyanine green (ICG) fluorescence into brain and scalp contributions. Columns: Three typical dye injections (doses 1.4, 1, and 2 mg, respectively) performed on two adult subjects. Scenarios I to III are discussed in the text. Upper row: Sensitivity functions for brain (green) and for scalp (blue) normalized to the maximum of . For better comparison, is additionally plotted with normalization to its maximum (red). Time zero is set to mean time of flight of the IRF (cf. Fig. 1). Lower row: reconstructed time courses of the fluorescence intensity from scalp (blue) and brain (green). All curves are normalized to the maximum of total fluorescence intensity (black). ICG was injected at . 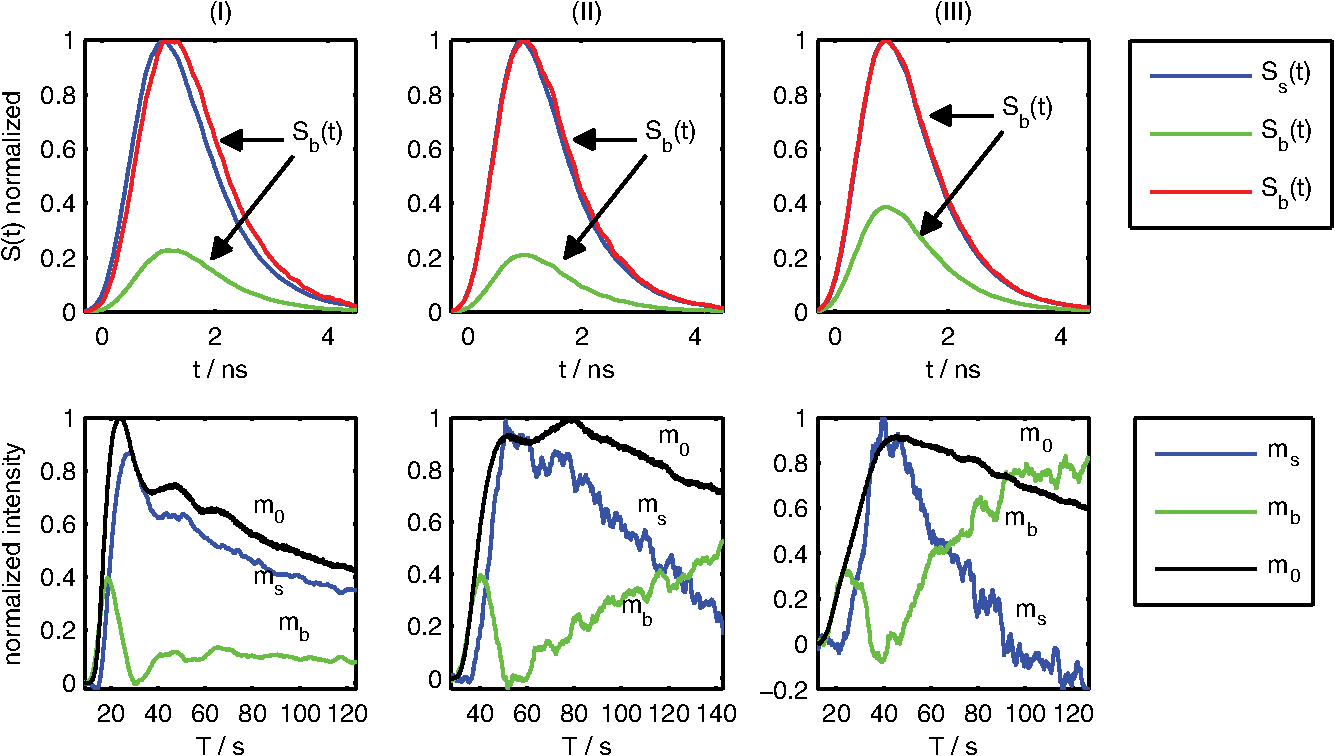 Scenario I: The extracted and differ clearly, showing a delayed sensitivity function of the brain. The decomposition results in physiologically reasonable time courses of the integrals and , the latter exhibiting an early peak for the bolus arrival, typical for the brain. In brain perfusion studies this peak is the relevant signal, since small delays and broadening are the basis for cerebral perfusion assessment as in perfusion-weighted magnetic resonance imaging (MRI).16 Compared to the extracerebral compartment the first pass of the intracerebral bolus is clearly earlier and sharper than the passage through the extracerebral tissue. Scenario II: The extracted differ only slightly from each other. The time course of the separated integrals contains minor artifacts. The intracerebral contribution monotonously increases after the end of the bolus. This increase is unexpected. Scenario III: The difference between both is barely visible. The decomposition delivers substantial artifacts such as negative intensities and an implausible late increase of the intracerebral contribution. It should be noted though, that even in this scenario the first pass of the intracerebral bolus is clearly identifiable. The time courses of all 34 measurements (28 on the forehead, 6 over the motor cortex) were classified according to the quality of the reconstructed fluorescence time courses for the brain, i.e., good (15 boluses), satisfactory (6), poor (11), and not separable (2). Since the true time course of the ICG bolus is unknown we applied three empirical criteria to judge the quality of the decomposition results: i. Physiological plausibility of the time course of the reconstructed fluorescence contributions: For healthy subjects the intracerebral bolus should arrive earlier compared to the extracerebral bolus. Negative levels in the reconstructed contributions were regarded as artifacts and therefore reduced the quality level. ii. Difference between maximum and minimum in the course of mean time of flight ; a higher value means better quality. iii. Comparison of both sensitivity functions by visual inspection; a visible difference results in better quality. Regarding the measurements performed on the forehead, in 75% of all cases the decomposition provided physiologically reasonable results (i.e., classification as satisfactory or good). The six measurements over the motor cortex region were classified as poor (4) or not separable (2). The reproducibility of results obtained for multiple injections of the same dose was good, in particular for the well separable measurements. Within our series of subsequent injections we had seven datasets with two to four equal boluses from which reproducibility of the results could be estimated. The quality scores within these individual series did not differ by more than one grade. A critical point in the analysis is the assumption of zero ICG concentration after the first bolus. The minimum in indicates that the concentration in the brain is minimal, but it is unlikely that it returns exactly to zero. A finite residual concentration at the minimum for the brain will introduce a small “parasitical” contribution to the sensitivity function determined for the skin. From Eq. (1) follows that the corresponding correction of the brain coefficient is proportional to the original skin coefficient . The magnitude of the correction is determined by the finite minimum fluorescence from the brain. As an example, we consider the bolus shown in Fig. 2, scenario I. We assume a drop of the true in period 3 to 20% of its maximum. A fraction of 14% of has to be added to to realize this value. In this case the leading edge of the brain bolus virtually does not change, the time to peak shifts by 0.5 sec only, and the 50% point on the trailing edge by 1.8 sec. Thus, a possible cerebral contamination of the skin sensitivity function as obtained in our analysis would not cause a substantial error in major bolus parameters and the assumption of a negligible ICG concentration after the first bolus passage is a reasonable approximation. 5.ConclusionsWe developed a method to separate intra- and extracerebral contributions of fluorescence for intravenously applied ICG boluses. Our approach is based on the exploitation of the full temporal profile of DTAs. Feasibility of this approach was demonstrated in two healthy adult subjects. It is important to note that the empirical (micro) time-dependent sensitivity functions automatically reflect the actual geometry and optical properties of the tissue and intrinsically contain the fluorescence decay and the convolution with the IRF. Hence, all these factors are implicitly taken into account but do not have to be known explicitly to apply the method. A major limitation of the approach is the assumption of a linear relationship between fluorescence and dye concentration that is valid for low concentrations only; however, we found that our method performed better for ICG injections of 5 to 6 mg than smaller doses. Our method necessarily requires the earlier arrival of the bolus in the brain. It will fail if the brain perfusion is substantially delayed which can occur in certain vascular pathologies. In this case we hypothesize that the corresponding sensitivity function determined on the contralateral, unaffected hemisphere might be used. The practical application of the method sometimes showed problems due to only minor differences between the sensitivity functions derived for the cerebral and extracranial compartments. An optimization seems feasible. As could be demonstrated by the results of Monte-Carlo simulations (not shown here) the difference between the sensitivity functions could be increased by decreasing the source-detector separation, while the relative amplitude of the intracerebral contribution would drop. The reconstruction was successful in 62% of the measurements on two healthy male subjects. While this could be considered as a promising first step, further improvements are needed to allow for an integration of the proposed method into a clinical diagnostic tool for monitoring of cerebral blood flow. AcknowledgmentsThe research leading to these results has received funding from the European Community's Seventh Framework Programme [FP7/2007-2013] under grant agreement No. FP7-HEALTH-F5-2008-201076. ReferencesE. M. C. HillmanA. Moore,
“All-optical anatomical co-registration for molecular imaging of small animals using dynamic contrast,”
Nat. Photon., 1
(9), 526
–530
(2007). http://dx.doi.org/10.1038/nphoton.2007.146 1749-4885 Google Scholar
R. WeisslederV. Ntziachristos,
“Shedding light onto live molecular targets,”
Nat. Med., 9
(1), 123
–128
(2003). http://dx.doi.org/10.1038/nm0103-123 1078-8956 Google Scholar
O. Steinkellneret al.,
“Optical bedside monitoring of cerebral perfusion: technological and methodological advances applied in a study on acute ischemic stroke,”
J. Biomed. Opt., 15
(6), 061708
(2010). http://dx.doi.org/10.1117/1.3505009 JBOPFO 1083-3668 Google Scholar
C. Terborget al.,
“Bedside assessment of cerebral perfusion reductions in patients with acute ischaemic stroke by near-infrared spectroscopy and indocyanine green,”
J. Neurol. Neurosurg. Psychiatr., 75
(1), 38
–42
(2004). http://jnnp.bmj.com/content/75/1/38 JNNPAU 0022-3050 Google Scholar
A. Liebertet al.,
“Bed-side assessment of cerebral perfusion in stroke patients based on optical monitoring of a dye bolus by time-resolved diffuse reflectance,”
Neuroimage, 24
(2), 426
–435
(2005). http://dx.doi.org/10.1016/j.neuroimage.2004.08.046 NEIMEF 1053-8119 Google Scholar
J. Steinbrinket al.,
“Relevance of depth resolution for cerebral blood flow monitoring by near-infrared spectroscopic bolus tracking during cardiopulmonary bypass,”
J. Thorac. Cardiovasc. Surg., 132
(5), 1172
–1178
(2006). http://dx.doi.org/10.1016/j.jtcvs.2006.05.065 JTCSAQ 0022-5223 Google Scholar
E. Kelleret al.,
“Noninvasive measurement of regional cerebral blood flow and regional cerebral blood volume by near-infrared spectroscopy and indocyanine green dye dilution,”
Neuroimage, 20
(2), 828
–839
(2003). http://dx.doi.org/10.1016/S1053-8119(03)00315-X NEIMEF 1053-8119 Google Scholar
A. Liebertet al.,
“Non-invasive detection of fluorescence from exogenous chromophores in the adult human brain,”
Neuroimage, 31
(2), 600
–608
(2006). http://dx.doi.org/10.1016/j.neuroimage.2005.12.046 NEIMEF 1053-8119 Google Scholar
J. Steinbrinket al.,
“Towards noninvasive molecular fluorescence imaging of the human brain,”
Neurodegener. Dis., 5
(5), 296
–303
(2008). http://dx.doi.org/10.1159/000135614 NEURFN Google Scholar
D. Milejet al.,
“Advantages of fluorescence over diffuse reflectance measurements tested in phantom experiments with dynamic inflow of ICG,”
Opto-Electron. Rev., 18
(2), 208
–213
(2010). http://dx.doi.org/10.2478/s11772-010-0013-z OELREM 1230-3402 Google Scholar
J. Steinbrinket al.,
“Determining changes in NIR absorption using a layered model of the human head,”
Phys. Med. Biol., 46
(3), 879
–896
(2001). http://dx.doi.org/10.1088/0031-9155/46/3/320 PHMBA7 0031-9155 Google Scholar
A. Liebertet al.,
“Time-resolved multidistance near-infrared spectroscopy of the adult head: intracerebral and extracerebral absorption changes from moments of distribution of times of flight of photons,”
Appl. Opt., 43
(15), 3037
–3047
(2004). http://dx.doi.org/10.1364/AO.43.003037 APOPAI 0003-6935 Google Scholar
A. Liebertet al.,
“Evaluation of optical properties of highly scattering media by moments of distributions of times of flight of photons,”
Appl. Opt., 42
(28), 5785
–5792
(2003). http://dx.doi.org/10.1364/AO.42.005785 APOPAI 0003-6935 Google Scholar
R. Bourayouet al.,
“Fluorescence tomography technique optimized for noninvasive imaging of the mouse brain,”
J. Biomed. Opt., 13
(4), 041311
(2008). http://dx.doi.org/10.1117/1.2968262 JBOPFO 1083-3668 Google Scholar
A. Liebertet al.,
“Monte Carlo algorithm for efficient simulation of time-resolved fluorescence in layered turbid media,”
Opt. Express, 16
(17), 13188
–13202
(2008). http://dx.doi.org/10.1364/OE.16.013188 OPEXFF 1094-4087 Google Scholar
K. Yamadaet al.,
“Magnetic resonance perfusion-weighted imaging of acute cerebral infarction: effect of the calculation methods and underlying vasculopathy,”
Stroke, 33
(1), 87
–94
(2002). http://dx.doi.org/10.1161/hs0102.101893 SJCCA7 0039-2499 Google Scholar
|


