|
|
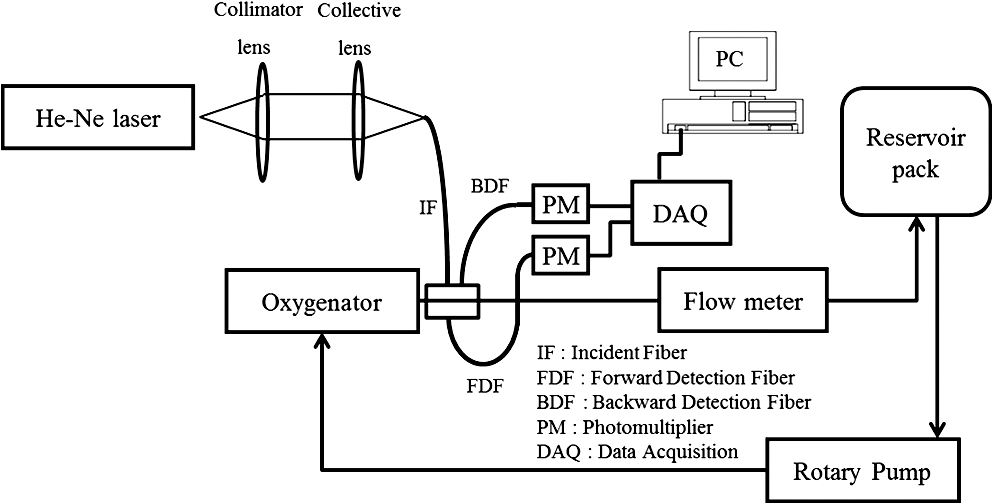
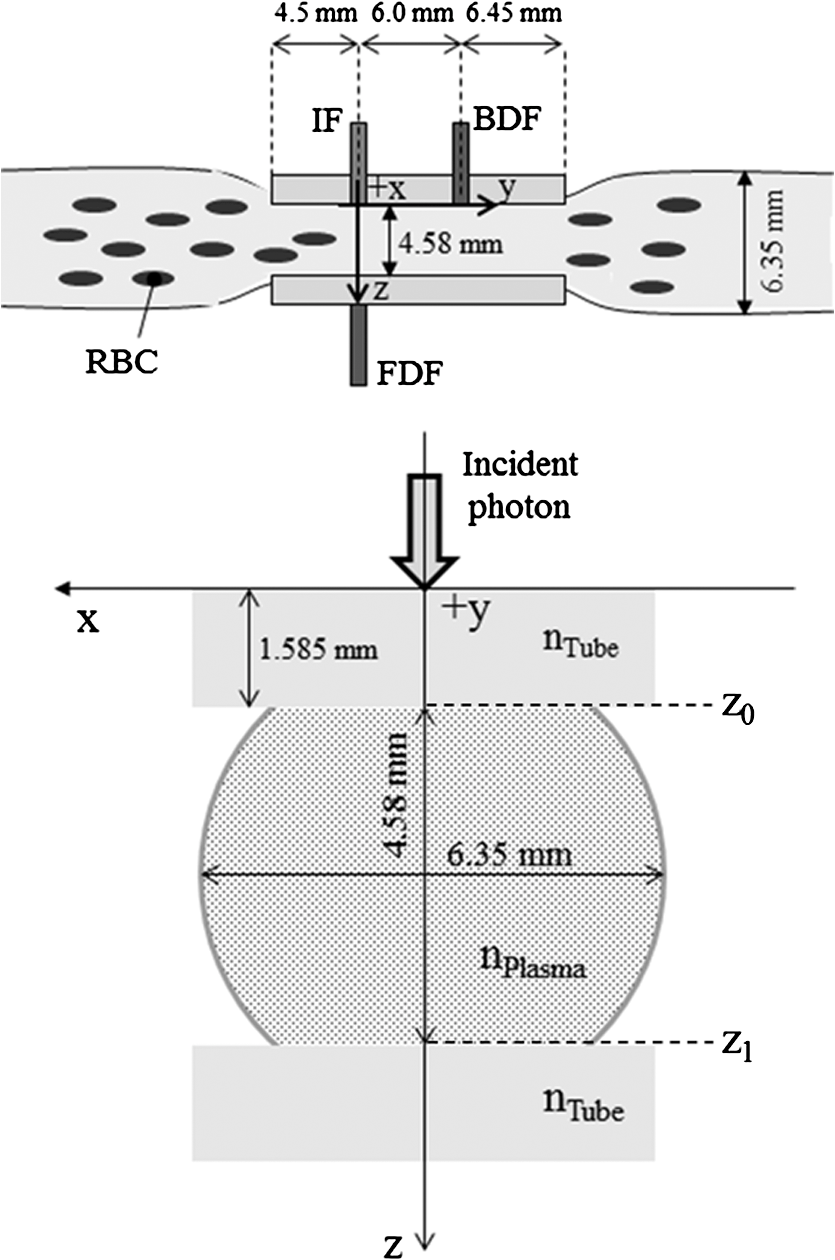
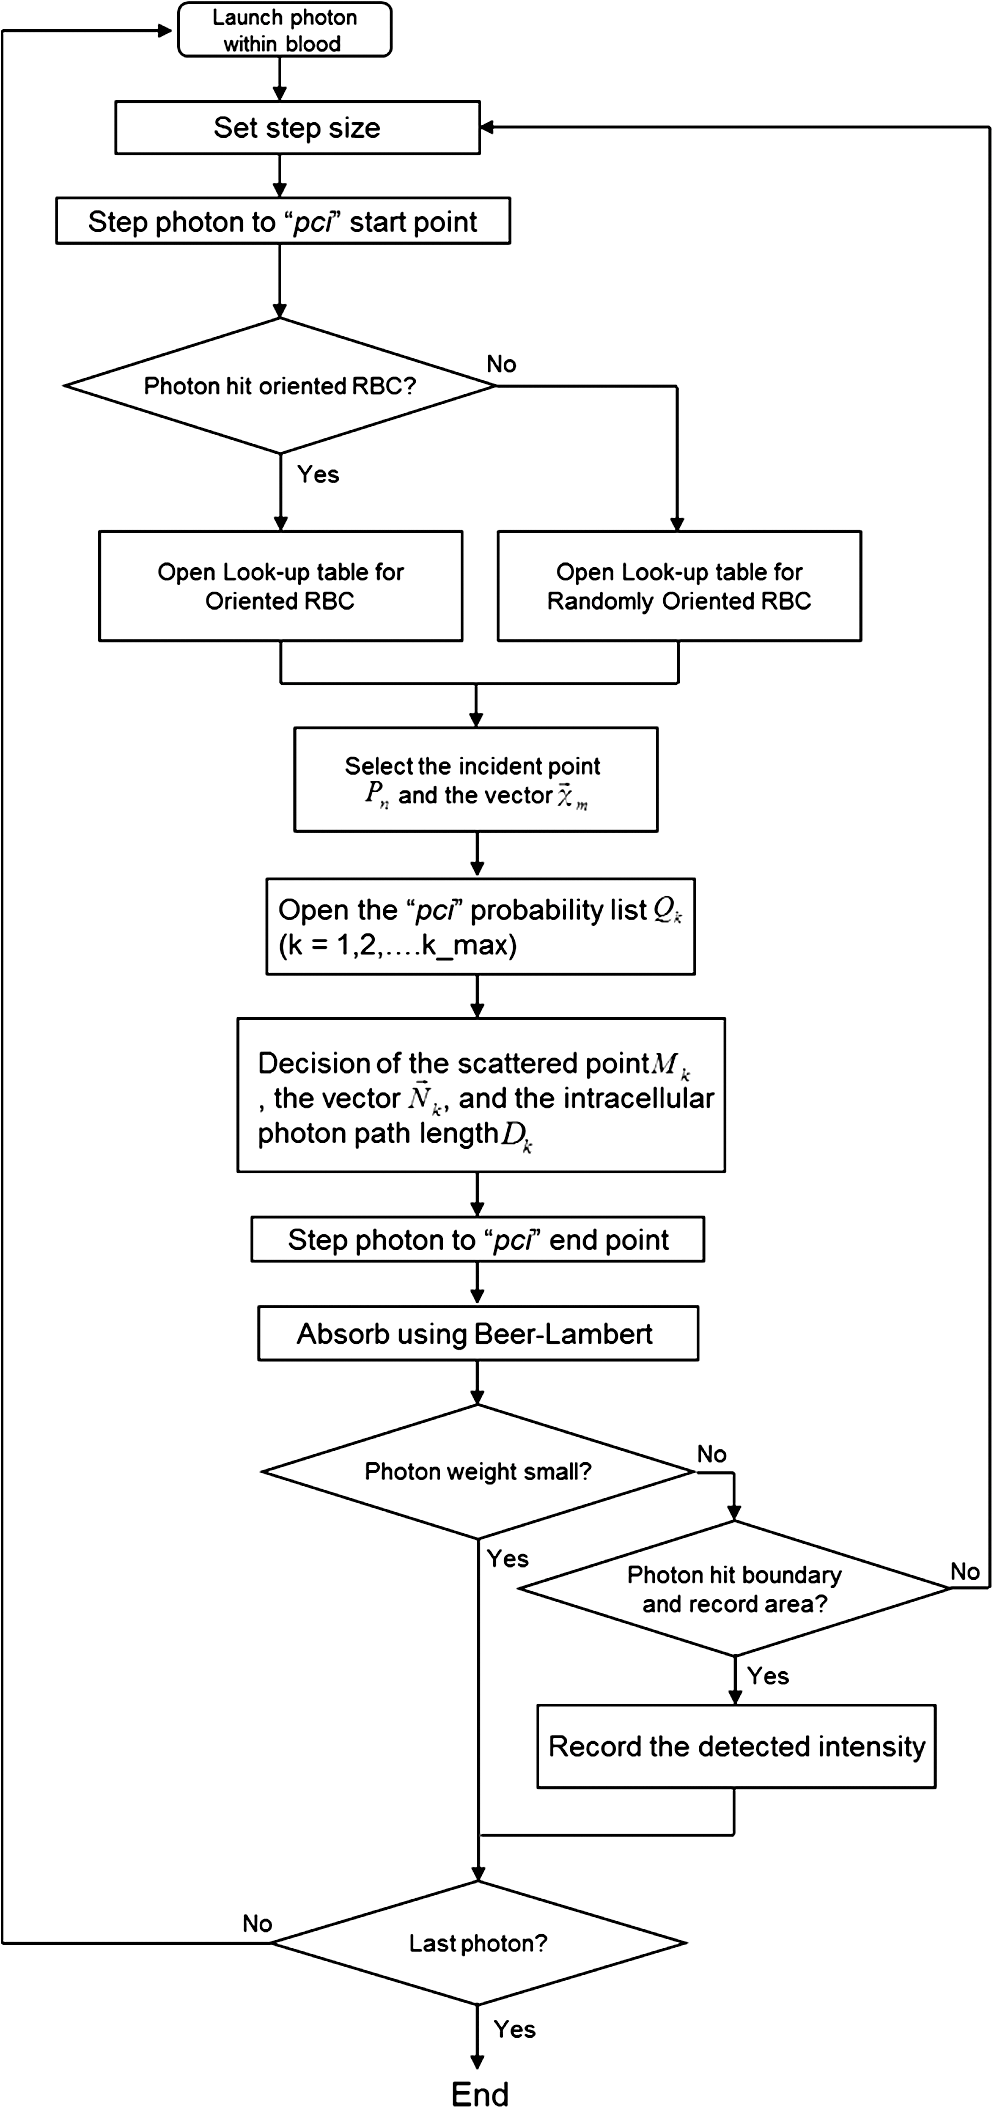
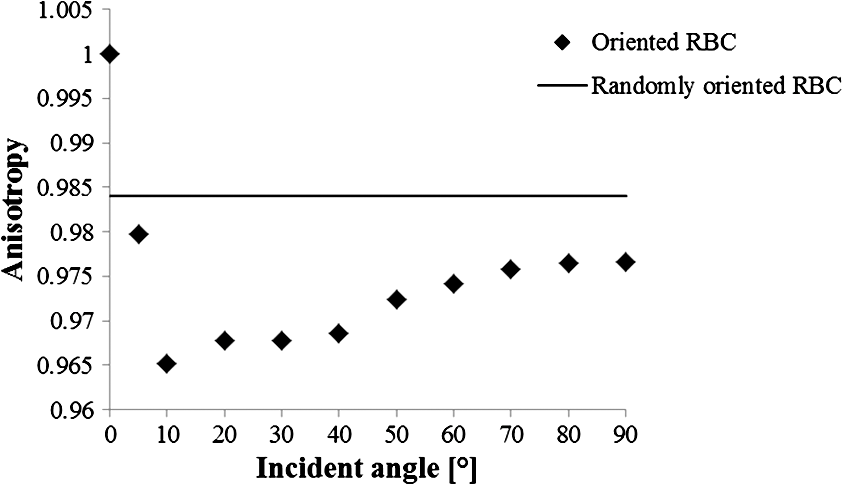
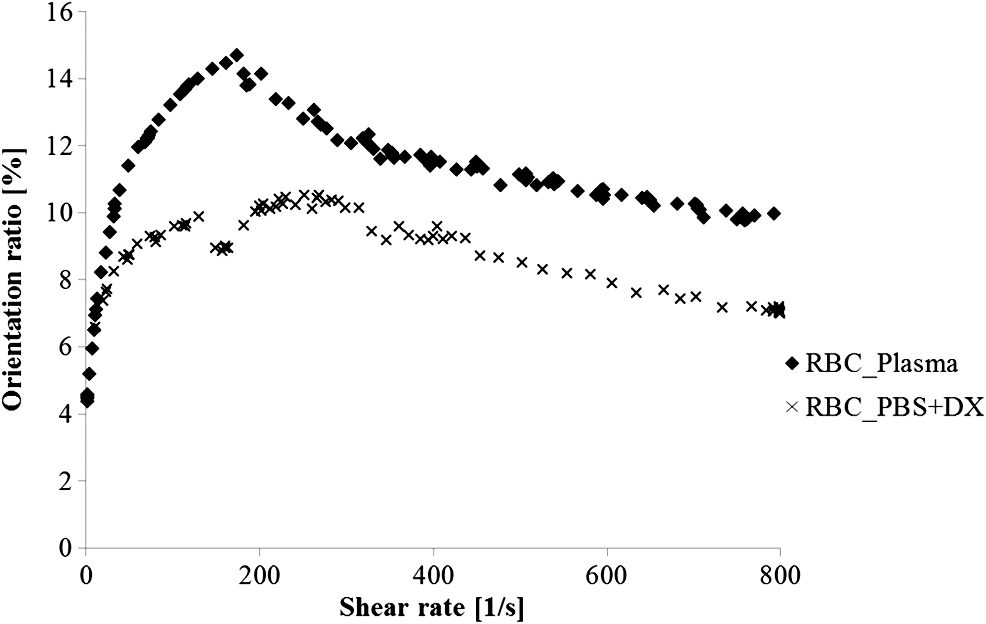
1.IntroductionFor extracorporeal circulation therapies, such as those using a percutaneous cardiopulmonary support system (PCPS), extra corporeal membrane oxygenation (ECMO) system, left ventricular assist device (LVAD), and hemodialyser (HD), continuous monitoring of flowing blood is important in detecting bleeding, oxygenation, hemolysis, and thrombosis so as to prevent complications such as anemia, infection, infarction, and to diagnose any early signs of problems in the cardiopulmonary devices. To achieve this objective, visible or near-infrared light (NIR) spectroscopy is a useful tool. In 1997, Sankai et al. reported the feasibility of hemolysis and thrombogenesis measurement by a laser photometry during extra corporeal circulation in vitro.1 In 2009 and 2010, Oshima et al. utilized the near-infrared light to measure hematocrit (HCT) of flowing blood with an accuracy of approximately 1.0 HCT%,2 which helped qualitatively assess thrombogenic process.3,4 Although the optical method is noninvasive and rapid, the existing measurement methods require calibration and thus they do not quantify the effects due to hemolysis, flow rate, osmolarity, mean corpuscular volume (MCV), and mean corpuscular hemoglobin concentration (MCHC).5 Understanding the optical properties of flowing blood with respect to these physiological parameters is, therefore, important for establishing a method for quantitative monitoring. As for direct imaging of blood flow, optical coherence tomography has been widely applied,6–8 while for the theoretical approach Roggan9 and Yaroslavsky10–12 measured the absorption and scattering constants , and the anisotropy factor of human blood by inverse Monte Carlo (MC) simulations in various physiological conditions. For developing a photon propagation model in blood based on MC simulation, the phase function derived using the Mie, Rayleigh-Gans, or straight-ray theory has been developed and utilized.13–15 The optical simulation using MC codes,16–26 however, treats red blood cells (RBCs) as points in the space, hence it is difficult to determine cell orientation in the space. The scattering by RBCs depends on the incident photon direction because RBCs have a non-spherical biconcave shape. The changes in the optical properties of flowing blood have previously been speculated to be caused by the changes in deformation, distribution, and orientation of RBCs by the shear flow. Shvartsman et al. speculated that the optical transmission through pulsating blood flow is affected by the RBCs’ aggregation and disaggregation.27,28 The aggregation dominantly occurs at shear rates below or at stopped flow, suggesting that the optical properties of blood are affected by the shear flow. Friebel et al. studied the influence of shear rate on the optical properties of human blood with inverse Monte Carlo simulation in the wall shear rates between 0 and .29 The mechanism of the changes in optical properties by aggregation/disaggregation would be considered by the changes in RBCs behavior, such as distribution and orientation. To study the interaction between photons and RBCs in the flowing blood, we proposed a photon-cell interactive Monte Carlo (pciMC) code that tracks photon propagation through both the extra- and intra-cellular spaces without relying on the macroscopic scattering phase function and anisotropy factor.30,31 In the pciMC approach, RBCs are expressed mathematically comprising three-dimensional biconcave structure having various MCV, MCHC, and HCT values. The interaction of photons at the plasma-cell boundary is expressed by the geometric optics. Therefore, the pciMC code can predict scattering changes caused by the changes in the cell volume, the intracellular hemoglobin concentration, the cell shape and its orientation. In this study, we have utilized the pciMC code to analyze the photon propagation affected by the blood flow inside an extracorporeal circuit. Three kinds of RBCs’ orientation patterns inside the extra corporeal circuit are proposed. The optimal interaction between photons and the flowing RBCs based on the pciMC analysis that best satisfies the experimental results was investigated to determine the orientation patterns of RBCs in the extracorporeal circuit. 2.Materials and Methods2.1.Blood Sample PreparationFresh porcine blood samples anti-coagulated with 4% sodium citrate ( blood) were obtained from a local slaughterhouse. Prior to the experiments, no significant hemolysis was seen. The blood was centrifuged and then plasma and buffy coat was excluded. To investigate aggregation and viscosity effects on RBCs’ orientation during blood flow study, three types samples, “RBC_Plasma,” “RBC_PBS,” and “” were prepared, where RBC_Plasma was made by suspending the centrifuged RBCs in plasma, RBC_PBS by washing and suspending the centrifuged RBCs with isotonic phosphate buffer solution (PBS) (, pH 7.4), and finally, by adding 60,000 molecular weight dextran (Dextran 60,000, Wako Pure Chemical industries. Ltd., Osaka, Japan) at a ratio 5 g Dextran to 335 cc PBS. It is well known that approximately 150,000 high-molecular wt. Dextran promotes RBCs aggregation whereas the lower-molecular Dextran has no influence as such.27 The RBCs’ aggregation effect in each sample was confirmed visually using a microscope. As a result, the apparent aggregation was confirmed in RBC_Plasma within 1 min. In , the aggregation was hardly seen after 3 min observation. Finally, in the RBC_PBS sample, the RBCs almost uniformly dispersed in the solution. The viscosities of the extracellular solution of each sample with respect to shear rate were shown in Fig. 1. These were measured by a cone-plate viscometer ( VISCOMETER, BROOK-FIELD Inc., MA, USA). The viscosity of PBS is almost equal to that of water at . For shear rate from 0 to , viscosity differences were noticed between Plasma and . However, above , the Plasma and viscosity showed very similar value at and , respectively. In addition, the refractive index of each extra cellular media was also measured by an Abbe refractometer (DR-M2, ATAGO Inc., Tokyo, Japan). The wavelength of source light was 656 nm. The refractive indices of Plasma, PBS, were 1.3461, 1.3323, and 1.3348, respectively. In all of the measurements and experiments, the temperature was kept constant at 20°C. In order to investigate the effects of MCV and MCHC on the optical characteristics, the RBCs were separated into large and small cells, , by centrifugation and and samples were prepared according to the following procedure. The whole blood was first centrifuged to exclude the buffy coat and plasma. The resultant packed RBCs with the hematocrit of around 80% to 90% were further centrifuged for 60 min with 40,000 G and 10°C. After the second centrifugation, approximately 20% of the top layers with lower specific gravity were extracted as relatively larger RBCs () and the bottom 20% with higher specific gravity as smaller RBCs (). These cells were washed in to remove free plasma hemoglobin and to adjust the hematocrit level. 2.2.Optical Measurements in the Extracorporeal CircuitThe closed loop circuit shown in Fig. 2 was primed with 500 cc of blood. The circuit comprises a rotary blood pump (HPM-15, Nikkiso Co., Japan), an oxygenator (Baby-RX, Terumo Co., Japan), a reservoir pack, and inch (6.35 mm) transparent Tygon tubing (Saint-Gabain, Tokyo, Japan). The blood was continuously pumped through the circuit by the rotary blood pump, and the flow rate was monitored by an electromagnetic flow meter. The oxygen saturation was maintained at 100% by the oxygenator. The blood parameters, the HCT, the total hemoglobin (tHb), and the oxygen saturation levels were determined by a blood gas analyzer (ABL520, Radiometer Co., Copenhagen, Denmark), and the MCV and MCHC were measured by an automated blood cell analyzer (Celltac MEK-6358, Nihon Kohden Co., Tokyo, Japan). As for the optical measurement system, a He-Ne laser (output of 30 mW, wavelength of 632.8 nm) was used as the light source. The emitted light was guided into an optical glass fiber (core diameter of 200 μm, outer diameter of 2.4 mm, beam spread angle of 20 deg) using collimator and collector lenses. The incident fiber, the forward, and the backward scattering detection fibers were fixed in the designed probe as shown in Fig. 3. The probe slightly squeezes the circuit tube to flatten the incident and detection surfaces resulting in the thickness of the tube to be 4.58 mm at this point. The distance between the incident and detection fibers is 6.0 mm. Both the forward and backward scatterings were detected by optical glass fibers with core diameters of 50 μm and guided to photomultipliers (H9305-03, Hamamatsu photonics Co., Hamamatsu, Japan). The signal was acquired by a data acquisition system (Labview DAQ system (NI USB-6008), National Instruments Co., Tokyo, Japan), and the acquired data was processed and analyzed using a PC. Optical measurements were conducted at various flow rates and HCTs. The HCT was varied by diluting the given sample with each extra cellular media. The blood flow rate was varied from approximately 0 to . Then the average shear rate was calculated by the following formula:32 where is the flow rate, is the thickness of the tube, and is the width of the tube. As a result of calculation, the shear rate varied from 0 to . The optical probe was attached to the tube about 70 mm from the oxygenator outlet. At the location of the optical probe, no significant difference in either forward or backward detection was found.To control the effect of RBCs aggregation, the optical measurement at no flow condition was immediately conducted when the flow suddenly came to stop from . After that, the flow rate was gradually increased to increase the shear rate to , while the optical measurement was conducted at each shear rate. 2.3.Analysis of Optical Properties of Flowing Blood Using pciMC2.3.1.Photon-cell interactive Monte Carlo modelThe detailed description of pciMC can be found else where.31 The pciMC models optical interaction at the plasma-cell boundary based on the geometric optics theory. In the first step in the analysis using pciMC, the program calculates the photon step size from the following equation: where is a uniform random number between 0 and 1, is a geometric interaction constant in , and HCT is the volume fraction of the RBCs, i.e., the hematocrit (). The MCV is the RBC volume in , and is the mean geometrical cross section of the RBCs in . The geometric structure of the RBCs was defined by an axially symmetric biconcave model, with surface coordinates defined as follows: Equation (4) expresses the perfect axial symmetry of the 3-D biconcave surface coordinates; () are the coordinates used in the photon-RBC interaction; is the biconcave RBC surface function,14 where is the angle between the position vector and the axis; and is the angle formed by projection of the position vector and the axis onto the plane. Incremental angles of and were used to discretize the surface data, with the total number of nodes being . After the photon has advanced one step, a scattering event takes place as shown in Fig. 4. Upon interaction of the photon with a RBC, the pciMC program selects the incident point and the vector as follows: where is the angle formed between the incident vector and the normalized vector at the incident point, and is the rotational angle about the normalized vector. In this study, incremental angles of , , and are used. Therefore, the total number of incident photon patterns is (). After selecting and , the program opens look-up tables to extract the value of specific to the interaction point. This contains the pre-calculated probability distribution of the photon escaping from the intracellular space of the RBC and returns output parameters , where, are the coordinates of the scattering point, is the propagation vector at the scattering point, and is the intracellular photon path length for the -th interaction. The scattering points and vectors are calculated from the geometric optics, and the photon’s escape probability is calculated using the Fresnel formula assuming the reflectance to be the average of the two orthogonal polarization directions. For each photon, the pre-calculation is pursued until the quantity becomes less than 0.001% or until the number of interactions reaches 100. If the probability of escape is not satisfied at any point, the photon is indefinitely trapped within the intracellular hemoglobin solution and is completely absorbed.As for the absorption event, using the propagation distance inside the RBC, the photon’s weight loss is estimated by the Beer-Lambert law: where and are the incident and scattered photon weights, respectively, is the molecular extinction coefficient for the wavelength in , and is the molecular weight of hemoglobin is equal to . For the wavelength of 632.8 nm used in the experiment, e(632.8 nm) is equal to .33After the photon is scattered, it moves from point to point by traveling an intracellular distance of , and the propagation vector is changed from to . To minimize the calculation cost, the pciMC simulation separates the simulation coordinates and the photon-RBC interaction coordinates. Since the scattering data are in photon-RBC interaction coordinates, the data must be converted to pciMC simulation coordinates. The translation process for randomly oriented RBCs was shown in a previous paper.31 2.3.2.RBC orientation patterns in extracorporeal circuitIn this study, the step size given by Eq. (2) was kept constant throughout the simulation. In addition, since the maximum shear stress in the circuit tube was estimated to be less than , we assumed that the shape of the RBCs moving in the circuit tube remained unchanged.29 Taking these things into consideration, we hypothesized that the changes in scattering with respect to the flow conditions were mainly caused by the changes in RBCs’ orientation. Figure 5 shows a schematic diagram of the coordinates used to describe the orientation of the RBCs. The long axis of the RBCs is in the -direction and the RBC rotates randomly about the long axis. We assumed that all of the RBCs within the circuit were randomly oriented when there was no flow; when the blood starts to flow, the orientation of the RBCs begins to change. In this study, three types of RBC orientation patterns, as shown in Fig. 6, were considered. Figure 6 shows the -plane as cross section of optical measurement area. The -axis means the tube and flow direction. We assumed the light scattering distributions to be symmetrical about the -axis. In addition, the orientation of the RBCs should be symmetrical about the center of the circulation tube. Fig. 6RBC orientation models in the circular tube (the vector ‘’ is the orientation direction shown in Fig. 5). Model 1: the orientation is in the direction of flow; model 2: the orientation is perpendicular to the flow and pointing toward the center of the tube; and model 3: the orientation is perpendicular to that in model 2.  On the left hand side of Fig. 6, in model 1, the RBCs orient with their long axes pointing in the direction of flow. In the center of Fig. 6, in model 2, the RBCs have their long axes pointing toward the center of the tube. Finally, on the right hand side of Fig. 6, in model 3 the long axes are perpendicular to those in model 2. 2.3.3.Algorithm of analysis based on the pciMC codeFigure 7 shows a flow chart of the pciMC program to simulate photon propagation through the extra corporeal circuit. Within the model, there are both randomly oriented RBCs and RBCs as defined by orientation models 1, 2, and 3 of Fig. 6. After the photon has advanced by one step, calculated by Eq. (1), the program chooses between a randomly oriented or an oriented RBCs’ scattering event based on the orientation ratio (OR). The OR was defined by the following equation: When the photon hits a randomly oriented RBC, the pciMC program randomly selects the incident point and propagation vectors based on the calculations using geometric optics theory. After the scattering event, the photon steps to the next scattering point. In addition, the photon weight is reduced by the Beer-Lambert law using the intracellular optical path length. Finally, the vector of the next scattering point is translated from the photon-RBC interaction coordinate to the pciMC simulation coordinate. A series of processes for randomly oriented RBCs were reported in Ref. 31. As for oriented RBCs, the process is very similar. The possible incident points, however, were restricted because some points might be inaccessible to the photon. For example, in the case of model 1, if the incident photon vector were in the flow direction, it would not be possible for the photon to reach the biconcave region. Thus in an oriented RBC scattering event, the probability of selecting an incident point and vector from the look-up table depends on the photon vector in the simulation coordinates. To account for this, the look-up table for oriented RBCs was organized by the relationship between the incident photon vector and the direction of the RBCs’ long axis. Selection of the appropriate look-up table was performed using the following calculation: where is the incident photon vector described by the pciMC simulation coordinates, . The vector was translated to the coordinate system of the RBC, , as shown in Fig. 5. The -and -directions are perpendicular to the -direction, which is along the long axis of the RBC. For example, in the case of model 1, is translated to . Equation (10) gives the look-up table parameter. The pciMC program opens the appropriate look-up table, Table [T], identified by where the is the angle between and the -axis. is a random counting number between 0 to (in this study, ). is the total number of patterns in the data set of . The inner products of each of the incident vectors in Table [T] and the direction are greater than but less than . Table [T] stores the vectors and the possible incident point data, the photon escape probabilities , and the output parameters . The means by which the possible incident point data are identified is shown in Appendix A. For example, if , all of the points on the surface of the RBC are accessible. In contrast, means the possible incident points are restricted because the incident photon meets the cell edge-on. A description of the translation from the interaction coordinates to the simulation coordinates is shown in Appendix B.2.3.4.Analysis conditionsIn the analysis, the RBC model as shown in Fig. 4 and the experimental setup of Fig. 3 were defined in the simulation coordinates. One million photons were injected into the blood in the -direction. The incident beam had a Gaussian distribution with a diameter of 200 μm and a spread angle of 20 deg. The refractive index of the circular tube, was 1.54. And the refractive index of each extra cellular solution was input as measured value. The refractive index of the RBCs was calculated from , where is 0.001960 at 630 nm. The value was taken from the Friebel study.34 At the planar boundary, the photon interaction was determined by the geometric optics theory. However, on the curved boundary of the tube, the photons were immediately terminated. The forward detection point was at and the backward detection point was at . The detection area was calibrated to cancel the simulation noise due to the small number of photons and the effects of photometry system characteristics such as the fiber properties, photo-detector sensitivities, and the influence of stray light. Where, it would be ensured that RBC_PBS at flow stop showed random orientation. Hence the calibration was performed without blood flow to fit the simulation results with randomly oriented RBCs to the experimental result of RBC_PBS. 3.Results3.1.Experimental Results: Changes in Light Scattering with Respect to Shear RateFigure 8(a) and 8(b) shows the experimental forward and backward relative optical densities (OD_rel), respectively. In Fig. 8, , , and . The OD_rel() was calculated by . As for forward OD(0) value, the OD(0) was in RBC_Plasma, in RBC_PBS, and in , respectively. Fig. 8Experimentally obtained forward and backward scattered relative optical density versus shear rate. (a) Forward direction, and (b) backward direction.  The forward OD_rel of RBC_Plasma was rapidly increased in the shear rate range from 0 to . The forward OD_rel of showed similar trend with RBC_Plasma but the change was milder. In RBC_PBS, the OD was hardly changed. The peak value of OD_rel was shown to be around shear rate. The peak OD_rel(200) of RBC_Plasma, RBC_PBS, and were 1.12, 1.05, and 1.01, respectively. As for the backward OD_rel, the values remained almost constant in all the samples. The OD(0) was in RBC_ Plasma, in RBC_PBS, and in , respectively. 3.2.Changes in Light Scattering with Respect to MCV, MCHC, HCTFor , MCV and MCHC were and , respectively. On the other hand, for , MCV and MCHC were and , respectively. About both MCV and MCHC, there were statistically significant differences between and for . The values was and for MCV and MCHC, respectively. The optical density with respect to hematocrit for both samples was shown in Fig. 9. Obviously, showed smaller OD than for the same hematocrit value. 3.3.Simulation Results: Photon Scattering DistributionIn these results, the input parameters were , , and . Figure 10 shows the influence of the angle between the incident direction of photon and the RBC orientation axis or long axis on the forward scattering probability. The forward scattering probability is reduced as the angle of incidence decreases. For a 90 deg incident angle, since the RBCs rotate around the orientation axis, overall forward scattering becomes less than those of the randomly oriented RBCs. Figure 11 shows the relationship between the angle of incidence and the anisotropy factor . The scattering probability in the pciMC method was expressed by the histogram of the photon escape probability distribution about the scattering angle, . The anisotropy was calculated as the mean cosine from Eq. (11): Fig. 10Scattering probability for incident angles of 10, 50, and 90 deg with respect to the axis of orientation. 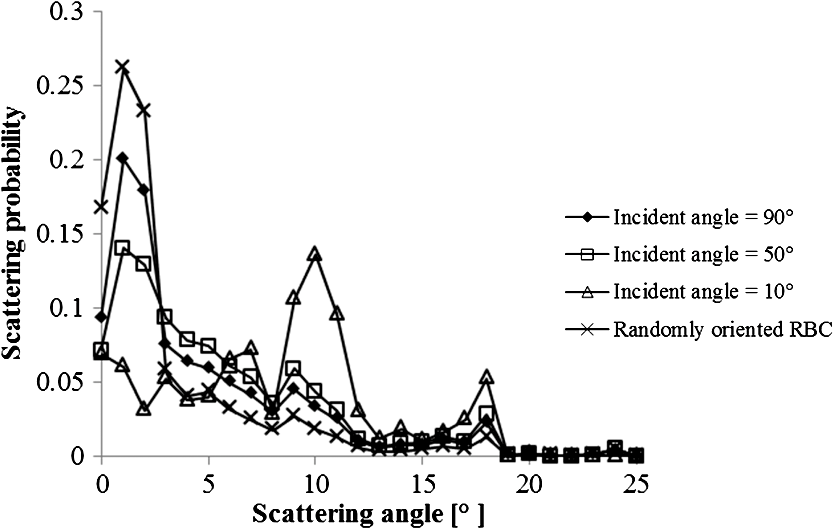 As expected, the anisotropy for randomly oriented RBCs remained constant to be 0.983989 regardless of the incident angle. For an incidence angle of 0 deg, indicating perfect edge-on incidence, . The reason for this is that the photon strikes the RBC perpendicular to its surface so that the photon is transmitted without refraction. However, as the angle of incidence increases, the anisotropy rapidly decreases with the photons scattering toward sides and backward directions. The minimum value of the anisotropy is . Above 20 deg, the anisotropy recovers and approaches as the angle of incidence increases. Figure 12(a) and 12(b) shows the forward and backward scattering distributions of photons along the flow axis, respectively, for the random orientation model with no flow, and for models 1, 2, and 3. In calculating numbers of scattered photons for the models 1, 2 and 3, the OR was set at 100%. At the point where the forward scattering was detected,, the random orientation model gave , while models 1, 2 and 3 gave , and , respectively. As for the backward scattering, at the point (0, 6.0, 0) [mm], the random orientation model gave , while models 1, 2 and 3 yielded , and , respectively. Clearly, the photons in model 1, in which the cell orientation is in the direction of the flow, were inhibited from scattering in the flow direction so that the photon distribution in the direction perpendicular to flow exceeded that of random orientation model and became narrower. 4.Discussion4.1.Validation of pciMC for Analysis of Optical Characteristics of Flowing BloodConventionally, the optical properties of blood have been determined macroscopically using a scattering constant, an absorption constant, and an anisotropy value. In particular, the anisotropy was treated to be constant and independent of the photon vector within the scattering media. The macroscopic approaches like conventional MC, thus, do not yield an accurate description of microscopic interaction between photons and blood cells. In contrast, the pciMC method, which is based on the geometric optics theory, utilizes blood cell parameters, such as MCV, MCHC, HCT, and the shape and orientation of the RBCs to provide a quantitative analysis of optical interaction between photons and cells without relying on the macroscopic parameters. As shown by Figs. 10 and 11, both forward scattering probability and anisotropy were affected by the angle between the incident direction of photons and orientation axis of flowing RBCs. The pciMC, which is based on the geometric optics theory and which utilizes blood physiological characteristics, such as MCV, MCHC, HCT as input parameters for analysis is better suited for analysis of optical characteristics of flowing blood. 4.2.Model Validation at Flow StopIn this study, the OD(0) was measured immediately as the flow came to stop. Under this condition, RBCs in PBS seem to have been randomly oriented and uniformly distributed. In the previous study, we confirmed that the pciMC model of photon propagation within random orientated RBCs showed good agreement with experimental values of RBC_PBS at no flow condition.31 To investigate the orientation and distribution of RBCs in other blood media including RBC_Plasma and , the OD(0) was simulated by pciMC at . The comparisons between the experiments and pciMC simulation results were shown in Fig. 13. Figure 13(a) shows forward optical densities while Fig. 13(b) shows backward optical densities. The OD values of pciMC showed very good agreement with the experiments. The changes in the optical density among the sample at flow stop were speculated to be caused mainly by the differences in the refractive index of the extra cellular medium. Therefore, in this study, an extra care was rendered to avoid occurrence of aggregation. Although a few minor RBCs clusters might have occurred in RBC_Plasma, the influence could be ignored. In conclusion, RBCs within each extracellular solution would be almost randomly oriented and uniformly distributed at flow stop. 4.3.Effects of RBC Orientation on Light ScatteringOur study showed significant changes in the optical density for shear rates from 0 to . The results indicate that the deformation of RBCs does not have an impact on the optical properties of the blood as Friebel reported previously.29 In this study, we speculated that the changes in the optical properties were caused by the changes in orientation of the RBCs due to flow conditions. The interaction angle between photons and RBCs thus vary depending on the orientation of RBCs affected by the blood flow. As shown in Fig. 12, the distribution of the scattered photons changed significantly with the orientation of the RBCs. As the angle between the incidence direction and the orientation axis or the long axis of the RBCs decreased, the forward scattering decreased due to the decrease in the anisotropy factor (Fig. 11). When the photons’ incident direction approached the orientation axis or the long axis of RBCs, the forward scattering was reduced, but scattering in the sides or backward increased. When we reviewed the experimental results of Fig. 8(a) and 8(b), with the increase in the shear rate from 0 to , the optical density in the forward direction increased, while the backward optical density was almost constant, respectively. The light would be scattered more in the flow direction or sides or to back, reducing forward scattered intensity. As the flow increased, the blood cells seem to have been lined up in a particular direction and to have rotated around the orientation axis so as to affect interaction angle between photons and cells. When we compared the experimental results against those of the simulation using pciMC for three different orientation models as shown in Fig. 12(a) and 12(b), it is apparent that the model 1 which is the RBCs oriented in the flow direction showed an opposite indication to the experimental results. Based on the model 1, numbers of forward scattered photons increased while the backward scattered photons decreased, respectively, with larger forward scattering than the randomly oriented model. In contrast, the simulations using model 2 and model 3, which have RBCs with their long axes oriented perpendicular to the flow direction, did replicate the experimental trends. 4.4.Effects of RBCs’ Orientation Ratio on Forward ScatteringSince the model 2 and model 3 seemed to have better described experimental results, effects of orientation ratio and distribution patterns in the circuit on the forward scattering probabilities were investigated, where, OR distribution was defined as uniform distribution in the circuit. The results are shown in Fig. 14. For model 2, the forward optical density increases linearly and monotonically with orientation ratio and has a correlation coefficient of . However, for model 3 the correlation fluctuates and the gradients are less than those for model 2. Since less scattering change was produced with the model 3 than the model 2, it was considered that the orientation of the RBCs used in model 3 do not make a large contribution to the changes in photon propagation with respect to blood flow. In conclusion, the pciMC model that best predicts the experimental results has the RBCs in the extracorporeal circulation migrating with their long axes perpendicular to the direction of flow and pointing towards the center of the circulation tube. 4.5.Comparison with the Published Rheological StudiesIn the past rheological studies, it has become well known that RBCs in a shear field exhibit two types of motion, ‘tumbling’ motion for lower shear stress and ‘tank treading’ motion for higher shear stress.35–37 The tumbling RBCs roll over periodically just like our orientation model. The rolling direction is parallel to the flow direction like model 2 and model 3. For the micro-vascular research, Mamisashvili et al. observed the orientation of RBCs in frogs’ mesenteric microvessels for the diameter of 25 to 35 μm and the result showed the orientation of RBCs was essentially perpendicular to the vascular walls.37 Also in the macroscopical flow channel, Bitbol observed the light forward scattering patterns across a plane Poiseuille flow whose cross-section is rectangular () and the result showed the same tendency as we observed.32 Bitbol reported at zero shear rate the RBCs were randomly oriented and the scattering pattern was merely circular. However, when the flow rate was increased, the scattering pattern became elongated in the flow direction and as a result the forward light flux was decreased as shown in our study. Bitbol and Okagawa38 additionally investigated the light scattering changes in the moment phase of the flow onset. As a result, the forward light flux was conversely increased. It was documented that the initial behavior of the RBCs as they became aligned parallel to the plane of equal velocity vectors like model 1. Okagawa explained the phenomenon using the Rayleigh-Debye light scattering theory.38 In other words, the decrease of forward light flux as the scattering pattern elongated indicates that the RBCs’ oriented direction was perpendicular to the flow direction. Therefore these past rheological studies support the RBCs behavior like model 2. In a future study, a combination of these optical results with hydrodynamic theory will be investigated. The pciMC method would then become a powerful tool for rheological studies. 4.6.Density of Oriented RBCs in Extracorporeal CircuitThe accuracy with which models 1, 2, and 3 replicate the experimental data with respect to flow rate was investigated. Obviously model 1 did not replicate the experimental results. Model 3 did hardly contribute to the changes in the light scattering. Therefore, by using model 2, the inverse problem to obtain the orientation ratio, expressed in Eq. (8), was conducted. The inverse problem pursued the orientation ratio for which the simulation results of both the forward and backward optical densities were closest to those of the experimental results. The result is shown in Fig. 15. The orientation with respect to flow rate rapidly increased and saturated around . The maximum value was 14.7% for RBC_Plasma, and 10.3% for , while the orientation of RBC_PBS was hardly confirmed. The reproducibility error of the inverse problem was calculated using the following equation: where and are the forward and backward light intensities from the experiment, and and are those from the pciMC method, respectively. The errors were for the RBC_Plasma, and for the .For the shear rate from 0 to , significant differences in the orientation ratio were noticed. The tendency was also similar with the viscosity characteristics with respect to shear rate shown in Fig. 1. In , the aggregation hardly occurred. Therefore, the orientation would be mainly caused by the viscosity of the extracellular solution. On the other hand, the orientation in RBC_PBS hardly occurred due to lower viscosity. Hence, it might be speculated that the orientation ratio depends on the viscosity of extracellular solution. Or the difference might be caused by the effect of RBCs aggregation. Although the severe aggregation was avoided in the experiments, RBCs might begin to flow by colliding with neighboring RBCs when flow start. Then the RBCs are influenced by the plasma protein and they align with the neighboring oriented RBC. As a result, the plasma protein might assist the orientation like rouleaux effect. Friebel et al. reported the effect of the plasma protein below .29 Our result also showed the high orientation occurred in the shear range. On the other hand, in the shear range above , the viscosities of extracellular medium of both samples were almost the same. Therefore, the difference of orientation ratio in the shear range might be caused by the plasma protein effect. In conclusion, it is speculated that the orientation of RBCs in plasma is influenced by both the viscosity of plasma and the effect of the plasma protein. 4.7.Validation of pciMC About MCV, MCHC, HCTTo validate the model and confirm its utility, the non-invasive measurement of the hematocrit using the optimized model was conducted in the experiment of and . The orientation ratio for a given shear rate, based on its relationship with the shear rate given in Fig. 15, was also used. An estimate of HCT was entered to calculate the optical density that best matched the measured optical density. When the simulation and measured results matched, the program output the HCT. The result of the non-invasive prediction of the hematocrit was shown in Fig. 16. The predictions were conducted in the shear range from 10 to . The error was calculated using the following equation: where is the HCT obtained by a blood gas analyzer. is the HCT predicted by pciMC program. The errors were for the at , for at , for the at , and for the at , respectively.The optical characteristics of the blood changed significantly with shear rate from 0 to . The pciMC simulation accurately predicted the hematocrit in spite of the limited flow range. Furthermore, the influence of light scattering by changes in MCV and MCHC could be replicated. Fortunately, the prediction could be achieved using the single relationship between the orientation ratio and the shear rate as shown in Fig. 15 only. The results indicate that the orientation of the RBCs hardly depend on the value of the hematocrit from approximately 20 to 40%. As a result, the simpler prediction system could be applied. The low flow range, in which the optical properties are affected, is clinically applied in cases such as pediatric ECMO and hemodialysis. Conventional optical monitors have the limitation of a low flow range with poor accuracy. The technique using pciMC simulation would help the development of a device applicable to various extracorporeal circulation therapies. 4.8.Future ProspectsThe optical properties of blood are strongly related to the physiological and rheological conditions. In this study, the pciMC simulations brought up various rheological issues. Thus pciMC will contribute to the development of both hemo-rheology and optical non-invasive diagnosis. Although the effects of RBCs orientation in continuous flow on light scattering were based on the experiment, the elucidation of correct oriented RBCs distribution would require more detailed analysis and versatile detection conditions. Shvartsman speculates the aggregation is main factor of changes in the light scattering in pulsatile blood flow.27,28 In the pulsatile blood flow, the intensive aggregation would occur in the diastolic phase which is low shear rate. In this condition, the intensive aggregation, the RBCs cluster should be defined in pciMC, and the step size would reduce. The detailed analysis of these encouraging results is scope of future publications. 5.ConclusionThe changes in the optical properties of blood with respect to flow in extracorporeal circulation were analyzed using the pciMC method, with the optical interactions at the plasma-RBC boundary determined by the geometric optics. The pciMC simulation describes the changes depending on the orientation of the RBCs and accurately predicts the hematocrit. The pciMC method can be used to gain an understanding of the optical properties of blood and their dependency on the rheological conditions, and, consequently aid in the development of non-invasive blood monitoring during extracorporeal circulation therapies. AppendicesAppendix A:Identification of the Possible Incident Point on the Oriented RBCWhether the incident photon hits a scanned element ABCD on the RBC [given by the four nodes , , , and ] or not is determined by the following two conditions, Condition 1 and Condition 2. Condition 1: where has a sufficiently larger value than the length of the RBC. is the incident pattern shown in Eqs. (4) and (5). is the normal vector to the element. ABCD. Condition 1 means that the vector can cross the plane parallel to ABCD.Condition 2: where is the vector from to . , , and are defined similarly. is the cross point at the intersection of with the plane parallel to ABCD. Condition 2 means that is within the ABCD.Appendix B:Translation from Photon-RBC Interaction Coordinates to pciMC Simulation CoordinatesThe calculation is described by “quatermion” which is frequently used in computer graphics. Quatermion provides the simplest means for coordinate translation and reduces the calculation cost. A quatemion is defined as follows. Here, is a point or vector in 3-D coordinates. The conjugation of is described as . Although the real number is arbitrary, is the simplest description. For the translation to be applied, two conditions must be satisfied. The first condition is that the oriented vector in the interaction coordinates must fit that in the simulation coordinates. The second is that the incident point and vector in the interaction coordinates must also fit those in the simulation coordinates. For the first condition, we use Eq. (8). is translated to by the following process: where is the vector in the direction of orientation. The vectors and are the unit vectors in the - and -directions in pciMC simulation coordinates. After the incident point and the vector in the photon-RBC interaction coordinates have been selected by Eq. (9), they are rotated around the -axis so that becomes . The translated incident vector and the rotation are described by the following equations: where is randomly selected to be either positive or negative so that the photon azimuthal angle is uniformly distributed. Next, for the second condition, the translated point and vector are additionally rotated so that becomes . The rotation is described as follows: Finally, using these equations, the scattered point and the vector are calculated as follows. where is the incident point prior to the scattering event, is the scale parameter to fit the scale of the interaction coordinates with those of the simulation coordinates.AcknowledgmentsThis work was supported by Grants-in-Aid for Young Scientists (Start-up) (#22800016, recipient Daisuke Sakota, November 2010 to March 2011) and Young Scientists (B) (#23700575, recipient Daisuke Sakota, April 2011 to present) from Japan Society for the Promotion of Science. This paper was partially presented at the European Conference on Biomedical Optics held in Munich, Germany during 22 to 26 May 2011.39 ReferencesY. Sankaiet al.,
“Method of noninvasive and continuous hemolysis/thrombogenesis measurement by laser photometry during artificial heart development,”
ASAIO J., 43
(5), 682
–686
(1997). http://dx.doi.org/10.1097/00002480-199709000-00071 AJOUET 0162-1432 Google Scholar
S. OshimaY. Sankai,
“Improvement of the accuracy in the optical hematocrit measurement by optimizing mean optical path length,”
Artif. Organs, 33
(9), 749
–756
(2009). http://dx.doi.org/10.1111/aor.2009.33.issue-9 ARORD7 0160-564X Google Scholar
S. OshimaY. Sankai,
“Evaluation of optical propagation in blood for noninvasive detecting of prethrombus blood condition,”
ASAIO J., 55
(6), 550
–555
(2009). http://dx.doi.org/10.1097/MAT.0b013e3181be2e44 AJOUET 0162-1432 Google Scholar
S. OshimaY. Sankai,
“Development of optical sensing system for noninvasive and dynamic monitoring of thrombogenic process,”
ASAIO J., 56
(5), 460
–467
(2010). http://dx.doi.org/10.1097/MAT.0b013e3181ebb815 AJOUET 0162-1432 Google Scholar
M. Meinkeet al.,
“Chemometric determination of blood parameters using visible-near-infrared spectra,”
Appl. Spectrosc., 59
(6), 826
–835
(2005). http://dx.doi.org/10.1366/0003702054280603 APSPA4 0003-7028 Google Scholar
M. BonesiS. G. ProskurinI. V. Meglinski,
“Imaging of subcutaneous blood vessels and flow velocity profiles by optical coherence tomography techniques,”
Laser Phys., 20
(4), 891
–899
(2010). http://dx.doi.org/10.1134/S1054660X10070029 LAPHEJ 1054-660X Google Scholar
M. BonesiS. MatcherI. Meglinski,
“Doppler optical coherence tomography in cardiovascular applications,”
Laser Phys., 20
(6), 1491
–1499
(2010). http://dx.doi.org/10.1134/S1054660X10110034 LAPHEJ 1054-660X Google Scholar
M. BonesiD. ChurmakovI. Meglinski,
“Study of flow dynamics in complex vessels using Doppler optical coherence tomography,”
Meas. Sci. Technol., 18
(11), 3279
–3286
(2007). http://dx.doi.org/10.1088/0957-0233/18/11/003 MSTCEP 0957-0233 Google Scholar
A. Rogganet al.,
“Optical properties of circulating human blood in the wavelength range 400-2500 nm,”
J. Biomed. Opt., 4
(1), 36
–46
(1999). http://dx.doi.org/10.1117/1.429919 JBOPFO 1083-3668 Google Scholar
A. N. Yaroslavskyet al.,
“The optical properties of blood in the near infrared spectral range,”
Proc. SPIE, 2678 314
–324
(1996). http://dx.doi.org/10.1117/12.239516 PSISDG 0277-786X Google Scholar
A. N. Yaroslavskyet al.,
“Influence of the scattering phase function approximation on the optical properties of blood determined from the integrating sphere measurements,”
J. Biomed. Opt., 4
(1), 47
–53
(1999). http://dx.doi.org/10.1117/1.429920 JBOPFO 1083-3668 Google Scholar
A. N. Yaroslavskyet al.,
“Different phase function approximations to determine optical properties of blood: a comparison,”
Proc. SPIE, 2982 324
–330
(1997). http://dx.doi.org/10.1117/12.273654 PSISDG 0277-786X Google Scholar
A. G. BorovoiE. I. NaatsU. G. Oppel,
“Scattering of light by a red blood cell,”
J. Biomed. Opt., 3
(3), 364
–372
(1998). http://dx.doi.org/10.1117/1.429883 JBOPFO 1083-3668 Google Scholar
M. Hammer,
“Single scattering by red blood cells,”
Appl. Opt., 37
(31), 7410
–7418
(1998). http://dx.doi.org/10.1364/AO.37.007410 APOPAI 0003-6935 Google Scholar
J. M. SteinkeA. P. Shepherd,
“Comparison of Mie theory and the light scattering of red blood cells,”
Appl. Opt., 27
(19), 4027
–4033
(1988). http://dx.doi.org/10.1364/AO.27.004027 APOPAI 0003-6935 Google Scholar
R. A. ForesterT. N. K. Godfrey,
“MCNP- a general Monte Carlo code for neutron and photon transport,”
Methods and Applications in Neutronics, Photonics and Statistical Physics, 33
–47 Springer-Verlag, New York
(1983). Google Scholar
B. C. WilsonG. Adam,
“A Monte Carlo model for the absorption and flux distributions of light in tissue,”
Med. Phys., 10
(6), 824
–830
(1983). http://dx.doi.org/10.1118/1.595361 MPHYA6 0094-2405 Google Scholar
S. A. Prahl,
“A Monte Carlo model of light propagation in tissue,”
Proc. SPIE, IS
(5), 102
–111
(1989). PSISDG 0277-786X Google Scholar
M. Keijzer,
“Light distributions in artery tissue: Monte Carlo simulations for finite-diameter laser beams,”
Lasers Surg. Med., 9
(2), 148
–154
(1989). http://dx.doi.org/10.1002/(ISSN)1096-9101 LSMEDI 0196-8092 Google Scholar
I. V. YaroslavskyV. V. Tuchin,
“Light transport in multi layered scattering media. Monte Carlo modeling,”
Opt. Spectrosc., 72 934
–939
(1992). OPSUA3 0030-400X Google Scholar
L. WangS. L. JacquesL. Zheng,
“MCML—Monte Carlo modeling of light transport in multi-layered tissues,”
Comp. Methods Prog. Bio., 47
(2), 131
–146
(1995). http://dx.doi.org/10.1016/0169-2607(95)01640-F CMPBEK 0169-2607 Google Scholar
D. ChiceaI. Turcu,
“RWMCS—an alternative random walk Monte Carlo code to simulate light scattering in biological suspensions,”
Optik, 118
(5), 232
–236
(2007). http://dx.doi.org/10.1016/j.ijleo.2006.02.008 OTIKAJ 0030-4026 Google Scholar
W. Verkruysse,
“Modeling light distribution of homogeneous versus discrete absorbers in light irradiated turbid media,”
Phys. Med. Biol., 42
(1), 51
–65
(1997). http://dx.doi.org/10.1088/0031-9155/42/1/003 PHMBA7 0031-9155 Google Scholar
S. Gabay,
“Modeling the assessment of port wine stain parameters from skin surface temperature following a diagnostic laser pulse,”
Lasers Surg. Med., 20
(2), 179
–187
(1997). http://dx.doi.org/10.1002/(ISSN)1096-9101 LSMEDI 0196-8092 Google Scholar
I. V. Meglinski,
“Monte Carlo simulation of reflection spectra of random multi layer media strongly scattering and absorbing light,”
Quant. Electron., 31
(12), 1101
–1107
(2001). http://dx.doi.org/10.1070/QE2001v031n12ABEH002108 QUELEZ 1063-7818 Google Scholar
I. V. MeglinskiS. J. Matcher,
“Computer simulation of the skin reflectance spectra,”
Comput. Methods Prog. Bio., 70
(2), 179
–186
(2003). http://dx.doi.org/10.1016/S0169-2607(02)00099-8 CMPBEK 0169-2607 Google Scholar
L. D. ShvartsmanI. Fine,
“Optical transmission of blood: effect of erythrocyte aggregation,”
IEEE Trans. Biomed. Eng., 50
(8), 1026
–1033
(2003). http://dx.doi.org/10.1109/TBME.2003.814532 IEBEAX 0018-9294 Google Scholar
L. D. ShvartsmanI. Fine,
“RBC aggregation effects on light scattering from blood,”
Proc. SPIE, 4162 120
–129
(2000). http://dx.doi.org/10.1117/12.405931 PSISDG 0277-786X Google Scholar
M. Friebel,
“Influence of shear rate on the optical properties of human blood in the spectral range 250 to 1100 nm,”
J. Biomed. Opt., 12
(5), 054005
(2007). http://dx.doi.org/10.1117/1.2799154 JBOPFO 1083-3668 Google Scholar
D. SakotaS. Takatani,
“Photon cell interactive Monte Carlo (pciMC) model to describe both intracellular and extracellular optical pathways of biconcave red blood cells: Phase function and Albedo,”
Proc. SPIE, 7573 757316
(2010). http://dx.doi.org/10.1117/12.841780 PSISDG 0277-786X Google Scholar
D. SakotaS. Takatani,
“Photon-cell interactive Monte Carlo model based on the geometrical optics theory for photon migration in blood by incorporating both extra- and intra-cellular pathways,”
J. Biomed. Opt., 15
(6), 065001
(2010). http://dx.doi.org/10.1117/1.3516722 JBOPFO 1083-3668 Google Scholar
M. Bitbol,
“Red blood cell orientation in orbit ,”
Biophys. J., 49
(5), 1055
–1068
(1986). http://dx.doi.org/10.1016/S0006-3495(86)83734-1 BIOJAU 0006-3495 Google Scholar
B. L. Horecker,
“The absorption spectra of hemoglobin and its derivatives in the visible and near infrared regions,”
J. Biol. Chem., 148
(1), 173
–183
(1943). JBCHA3 0021-9258 Google Scholar
M. FriebelM. Meinke,
“Model function to calculate the refractive index of native hemoglobin in the wavelength range of 250–1100 nm dependent on concentration,”
Appl. Opt., 45
(12), 2838
–2842
(2006). http://dx.doi.org/10.1364/AO.45.002838 APOPAI 0003-6935 Google Scholar
M. AbkarianM. FaivreA. Viallat,
“Swinging of red blood cells under shear flow,”
Phys. Rev. Lett., 98
(18), 188302
(2007). http://dx.doi.org/10.1103/PhysRevLett.98.188302 PRLTAO 0031-9007 Google Scholar
J. M. SkotheimT. W. Secomb,
“Red blood cells and other non-spherical capsules in shear flow: oscillatory dynamics and the tank-treading-to-tumbling transition,”
Phys. Rev. Lett., 98
(7), 078301
(2007). http://dx.doi.org/10.1103/PhysRevLett.98.078301 PRLTAO 0031-9007 Google Scholar
V. A. MamisashviliI. K. Baratashvili,
“In vivo study of erythrocyte orientation in microvessels and the effect of different factors on it,”
Sechenov Physiol. J. USSR, 66
(10), 1466
–1472
(1980). Google Scholar
A. OkagawaS. G. Mason,
“Kinetics of flowing dispersions. . Oscillations in optical properties of streaming suspensions of spheroids,”
Can. J. Chem., 55
(24), 4243
–4256
(1977). http://dx.doi.org/10.1139/v77-602 CJCHAG 0008-4042 Google Scholar
D. SakotaS. Takatani,
“Newly developed photon-cell interactive Monte Carlo (pciMC) simulation for non-invasive and continuous diagnosis of blood during extracorporeal circulation support,”
Proc. SPIE, 8092 1
–8
(2011). http://dx.doi.org/10.1117/12.889327 PSISDG 0277-786X Google Scholar
|