|
|
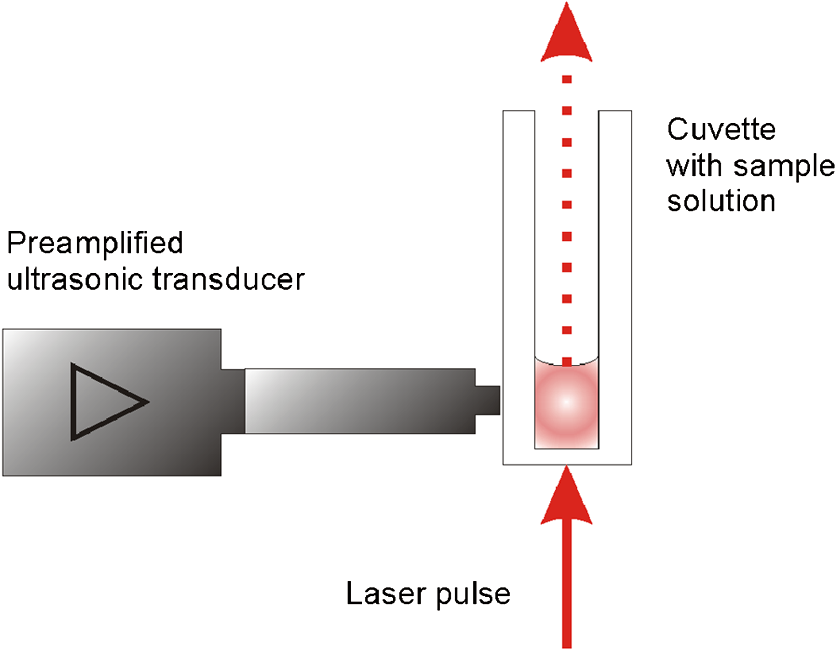
1.IntroductionThe interaction of laser radiation with strongly light-absorbing nanoparticles leads to nanoscale thermophysical effects in and around the nanoparticles, which enable a variety of interesting applications ranging from functional analysis of proteins to the treatment of diseases.1–7 Depending on the pulse duration, the physical mechanisms as well as the action radius vary. A selective destruction of cells can be achieved by binding gold nanoparticles to specific biological target structures. Irradiation of spherical gold nanoparticles with short laser pulses at wavelengths around 520 nm leads to heating and formation of microbubbles, or photochemical reactions.8,9 The applicability of spherical gold nanoparticles irradiated with nanosecond pulses for cell killing was successfully demonstrated in vitro.10–12 In rod-shaped gold nanoparticles the plasmon resonance splits into the transversal surface plasmon resonance (TSPR), which remains around 520 nm, and the longitudinal surface plasmon resonance (LSPR), which shifts to longer wavelengths. Depending on the particle aspect ratio the LSPR may be located in the optical window of tissue between 700 and 1100 nm. Due to their optical properties, gold nanorods have a high potential for new biomedical applications.13 In addition to a therapeutic relevance, the localized conversion of optical energy into heat can be utilized to enhance contrast in optoacoustic imaging.14–16 Nanocavitation, which forms around the particles at sufficient surface temperature, enhances the acoustic signal significantly. In this work, functionalized gold nanorods were investigated for cell elimination. In contrast to the high cell-destruction efficiency of spherical nanoparticles, which are irradiated by nanosecond laser pulses,10,11 nanorods irradiated at wavelengths near their LSPR peak around 800 mm were considerably less effective. Cell destruction was even more effective when nanorods were irradiated at the less absorbing TSPR peak at 520 nm. In order to understand the discrepancy between the strong energy absorption in the near-infrared (NIR) and the low cell-killing efficacy, an analytical model was used to calculate the laser-induced temperature increase inside and around the rod-shaped particles. Bleaching of the particle absorption due to melting and shape transformation was identified as one possible reason for the low cell-killing efficacy. Absorption cross-sections of the nanorods and the temperature increase were calculated by an analytical model. Time-resolved absorption measurements with nanosecond time resolution verified the theoretical modeling, which predicted rapid transient change of the particle absorption. Optoacoustic and transmission measurements were carried out to verify the reduced energy deposition within nanorods when irradiated with nanosecond infrared pulses. 2.Calculation of Absorbed Energy and Temperature Increase2.1.Light Absorption by NanorodsThe unique optical properties of nanoparticles were extensively reviewed by several publications.17–28 Here, the extraordinary high optical-absorption cross-section of gold nanoparticles is relevant for generating locally high temperatures, while the scattering properties can be neglected for cell inactivation or optoacoustic imaging. The absorption cross-section of gold nanorods was calculated in the electrostatic approximation for ellipsoidal shape with acceptable error because of the small particle size.17 The absorption cross-section is determined by the imaginary part of the polarizability which depends for a homogeneous sphere only on the particle volume Vp and the dielectric functions of the particle material and the surrounding medium :17,19This electrostatic approximation in fact corresponds to the dipole oscillation described by the first-order Mie coefficients, which are sufficient for spherical particles with diameters smaller than 30 nm. It has a simple extension to solid or coated ellipsoidal particles.17 By introducing the anisotropy factors . The polarizabilities for solid and for coated ellipsoids are calculated by For a prolate ellipsoid with an axis relation of the longitudinal (long axis) anisotropy factor is calculated from the eccentricity and the ratio of both axis diameters and .17 Parameters with the subscript 1 belong to the particle core and subscript 2 to the shell material, while is the ratio of the core to the total particle volume . In prolate ellipsoids two different dipole modes can be excited independently, i.e., the longitudinal plasmon resonance (LSPR) along the long axis and the transversal mode (TSPR) along the short axis. The sum over the three possible depolarization factors is unity. Therefore the transversal (short-axis) depolarization is given by Considering randomly oriented ellipsoids the polarizability is equal to the average over the three principle polarizabilities given by17 Since LSPR and TSPR are basically independent and can be excited separately, nanorods exhibit strongly polarization-dependent absorption. The effective absorption cross-section of a single particle depends on the angle between the long particles axis and the electric field vector of the incident light:21 2.2.Temperature Increase in NanoparticlesA thermal model was used to calculate the temperature response inside the particle and at its surface to time-varying laser pulses. The cooling time constants of the whole particle is at least a tenfold smaller than the inner thermal relaxation times due to the high heat conductance of the free electron gas. Thus, for pico- and nanosecond laser pulses the thermalization of the particle can be assumed instantaneous, which is a necessary condition for the analytical description of the heat transfer. For simplicity, temperatures only for spherical particles with equivalent volume were calculated, by an analytical mathematical model for the temperature distribution. Irradiation with nanosecond pulses exceeds considerably the thermal confinement conditions and the temperature profile will approach a spherical distribution. The real particle shape is crucial for the absorption cross-section but has minor influence on the temperatures. In a spherical symmetry, i.e., a particle with a radius , heat dissipation from a particle into an ambient aqueous medium is then described by two differential equations.29,30 Solving these leads to three equations, one for the particle temperature , one for the temperature in the fluid at the particle surface, and one for the temperature of the surrounding aqueous medium:29,30 where the diffusivity and the abbreviations and are used for the reason of compactness. is the initial Dirac-shaped temperature increase by infinitesimal short heating of the nanoparticle with radius , mass , density , and specific heat . The surrounding medium properties are described by the thermal conductivity , density , and specific heat . is calculated from the radiant exposure and particle absorption cross-sectionFor heating with longer pulses with the instantaneous irradiance , the time-dependent temperature was calculated by a convolution (Fig. 1): Fig. 1Typical temperature increase inside (solid line) and on the surface (dashed line) of a gold nanoparticle, which is irradiated by a Q-switched laser pulse. The temperature follows the strong temporal variation of the irradiance, which is caused by longitudinal modes beating. Small-axis diameter and aspect ratio are 10 nm and 4, respectively. Radiant exposure is .  The only not-readily-known parameter is the interface heat conductivity . Measurements of the temperature in laser-heated gold nanoparticles by x-ray diffraction allowed to determine at the gold-water interface to (see Ref. 30). 3.Experimental MethodsTransient-absorption measurements were done with gold nanorod with an average diameter of 10 nm on the short axis and a longitudinal size of approximately 41 nm (Nanorodz 30-10-808, Nanopartz, Concurrent Analytical Inc., Loveland, CO, USA). Further particles were provided by Jürgen Groll (at that time at German Wool Institute, DWI, affiliated to the Technical University RWTH Aachen). As received from the manufacturer the nanorod solution was diluted with distilled water. Absorption spectra were acquired with a photometer (Lambda 14P, Perkin Elmer) before and after irradiations. Particle shape before and after irradiation was determined by transmission electron microscopy (TEM). A few drops of particle solution were let to evaporate on carbon-coated grids and then imaged by a Philips 400T TEM. No additional staining was used. Particle irradiation was carried out with a combination of a frequency-doubled, Q-switched Nd:YAG Laser (Surelite I-20, Continuum, Santa Clara, CA, USA) and a tunable optical parametric oscillator (OPO; Continuum, Santa Clara, CA, USA). If not otherwise stated, the OPO was tuned to the maximal absorption in the LSPR band of the nanorods. After a combination of a rotatable broadband plate and a polarizer for the adjustment of the laser energy the radiation was linearly polarized (Fig. 2). Samples of 15-μl nanorod solution were irradiated in a quartz-glass microtiterplate with wells of 3.5-mm diameter (Mikroglas Chemtech GmbH, Mainz, Germany) with a single laser pulse of 4-ns duration at a wavelength which was tuned to the LSPR peak of the nanorods. Fig. 2Experimental setup for time-resolved absorption measurements during the irradiation of the nanorod solutions. For irradiation at 532 nm the optical parametric oscillator is bypassed.  Three different experiments were conducted.
Fig. 3(a) Signal sequence of sample (first) and reference (second) pulse from a reference measurement without nanorods. (b) Superposition of probe (red dashed line) and reference (black solid line) pulses. (c) Typical baseline of the transient-absorption measurement, which was calculated from both pulses.  3.1.In Vitro Cell Irradiation Experiments3.1.1.Cells and cell cultureFor the in vitro irradiation experiments, the human lymphoma cell line Karpas 299, which was kindly provided by Prof. Johannes Gerdes (Research Center Borstel, Germany) were used. The cells were maintained in suspension of RPMI 1640 medium (PAA, Cölbe, Germany) supplemented with 10% fetal bovine serum (FCS; Biochrom, Berlin, Germany), penicillin and streptomycin at 37°C with 5% . 3.1.2.Nanorod conjugation with BSA and incubation with cellsThe nanorod solution was centrifuged for 30 min with 13,000 rpm at room temperature (RT) to obtain a pellet and incubated with 10% bovine serum albumin/phosphate buffered saline (BSA/PBS) solution for 20 h by shaking at RT. After further centrifugation the BSA nanorods were washed with PBS, centrifuged again and incubated for 20 h with the suspension cells at 37°C and 5% . The ratio of cells to nanorods was approximately to provide a sufficient amount of nanoparticles on the cell surface. The calculation of particle number was based on the manufacturer-provided particle concentration of at an optical density 1 for the LSPR wavelength peak. Cell numbers were counted in a Neubauer counting chamber (Glaswarenfabrik Karl Hech GmbH&Co. KG, Sondheim, Germany). 3.1.3.Irradiation of cells incubated with nanorodsIn preparation of the irradiation experiments the nanorod cell suspension was centrifuged for 5 min at 1400 rpm at RT to remove the excess of nanoparticles not bound to the cells. After washing with PBS and further centrifugation the cells were resuspended in a small amount of culture medium. 15 μl of suspension was placed in the chambers of a 384-well microtiter quartz plate, which was sealed by a cover slip (Mikroglas Chemtech GmbH, Germany). The cells were then irradiated using the Q-switched Nd:YAG laser and the OPO. Radiant energies between 0 and 30 mJ were applied, while a spot size of for near infrared (maximum NIR absorption, nanorod specific) and for green irradiation (532 nm) was adjusted. After irradiation, the samples of cells incubated with nanorods as well as control cells without nanoparticles were carefully stirred, transferred into fresh culture medium and kept in an incubator at 37°C with 5% for 24 h. Approximately 50,000 cells per sample were irradiated with multiple pulses of radiant exposures up to and a fraction of 1000 cells were analyzed by flow cytometry for viability. Results from five independent experiments were averaged. 3.1.4.Fluorescence-activated cell sorting (FACS) analysisViability tests of the cell suspensions were done with the fluorescent dyes Calcein AM and Propidium Iodide (Sigma Aldrich, Live/Dead double staining kit no. 04511) in a flow cytometer (FACScan, Becton Dickinson, Franklin Lakes, NJ, USA). Data were analyzed by CellQuest software (Becton Dickenson, Franklin Lakes, NJ, USA). Each cell sample was incubated in 500 µl of a diluted Calcein solution (4-mM Calcein solution was dissolved in PBS) for 15 to 30 min at 37°C. Before measuring, 0.6-µl propidium iodide solution (0.5 μl of a 2-mM stock solution was dissolved in 50 μl PBS) was added to the cell. 4.Results4.1.Cell Elimination by Nanosecond Pulsed Irradiated NanorodsPhototoxic activity of nanorods bound to cells was determined by irradiating at the maximum of the LSPR absorption band around 800 nm and also at 532 nm, which was near the maximum TSPR absorption. Figure 5 shows the average cell-killing efficiency of the nanorods at different absorbed radiant energy. Fig. 5Fraction of the destroyed cell versus the absorbed mean energy per particle when irradiated at the longitudinal surface plasmon resonance peak wavelength between 770 and 810 nm (red squares) and at the transversal surface plasmon resonance band 532 nm (green circles). Absorbed mean energy was calculated from the absorption cross-sections at the irradiation wavelengths, taking the random orientation of the nanorods into account.  At maximum applied radiant exposure, up to 90% of the nanorods-loaded Karpas 299 cells were damaged, while the control cells, Karpas 299 cells without gold nanorods, exhibit an average cell death between 5% and 15% independently of the radiant exposure. These values are typical for pipette-handled cell cultures. For 50% cell death (LD50) a five-times higher radiant exposure was needed with near infrared irradiation (red squares), which converts to a 15-fold increased energy deposition in the nanoparticles compared to a 532-nm irradiation (green circles). Both, the gold nanospheres and nanorods were not internalized, but attached to the cell surface, as we could verify by silver staining cells after incubation. 4.2.Optical Properties of Irradiated NanorodsThe low efficacy of the NIR irradiation may be caused by large individual variation of the particle absorption or by loss of absorption during the irradiation. Synthesis of gold nanorods produces polydisperse samples that have variations in the particle volume and eccentricity. This results in an inhomogeneous broadening of the absorption band which is considerably broader than the calculated spectra for a monodisperse solution (Fig. 6). Considering a normal distribution of the aspect ratio at constant rod width causes a slight red shift: Larger particles exhibit a higher absorption at longer wavelength due to their increased volume. Ultraviolet/visible (UV-VIS) absorption spectra were measured in order to characterize the wavelength-dependent absorption of real nanorod solutions. Figure 6(a) shows a measured spectrum together with calculated spectra of gold nanorods with different aspect ratios, as they may contribute to the measured absorption. Besides the particle shape and size distribution the orientation of the particles toward the polarized laser introduces a significant variation of the deposited energy within the particles and thus the maximum temperature increase. Fig. 6(a) Calculated spectra (dashed lines) of different-sized nanorods with small-axis diameter of 10 nm and aspect ratios of 3.85, 4.00, 4.15, 4.30, and 4.45, which may contribute to the measured absorption spectrum (solid line). The inset shows a transmission electron microscopy (TEM) image of a sample of different sized particles before irradiation. (b) Calculated absorption spectra of nanorods with different aspect ratios at a constant volume (4 solid, 3.4 long dashed, 2.9 short dashed, 1.4 dotted). Inset: TEM image of particles with different shapes after irradiation. The length of the scale bar in the upper left corner of each image corresponds to 50 nm.  At sufficiently high temperatures, a partial or complete melting of the nanorods can occur and lead to deformations. These morphological changes result in a shift of the LSPR absorption band into the visible range and can be considered as a permanent bleaching. This is illustrated in Fig. 6(b) by calculating the particle absorption for different aspect ratios but constant volume. The inset shows a TEM image with particles, which exhibit different shapes after irradiation. The spectral position of the LSPR band depends very sensitively on the refractive index of the medium, which was water in our experiments. Laser-induced nanocavitation is probably the mechanism for permeabilization of a cell membranes and cell killing. The vapor layer from the expanding gas bubble decreases the refractive index of the surrounding medium from 1.33 to 1.03 (water vapor at 300°C, ambient pressure 1 bar). For a particle with 10-nm small-axis diameter and an aspect ratio of four, a vapor layer of only 2 nm causes a blue shift of the LSPR absorption peak by 98 nm [Fig. 7(a)]. At a fixed wavelength of 770 nm, which is in this case the peak position of the particle in water, the absorption cross-section will decrease from to (2 nm vapor). Figure 7(b) depicts the strong decline of absorption with increasing , which reaches a lower limit of approximately . Fig. 7(a) Longitudinal surface plasmon resonance (LSPR) absorption spectra of a nanorod with small-axis diameter of 10 nm and an aspect ratio of four, which is surrounded by a vapor layer of 0 nm (black), 0.5 nm (red), 1 nm (green) and 2 nm (yellow). (b) Absorption cross-section at the fixed wavelength of the maximum of LSPR absorption rapidly decreases with the thickness of the surrounding vapor layer. The long axis of the nanorod was considered to be parallel to the polarization of the incident light. Absorption was calculated by Eqs. (1) to (5). 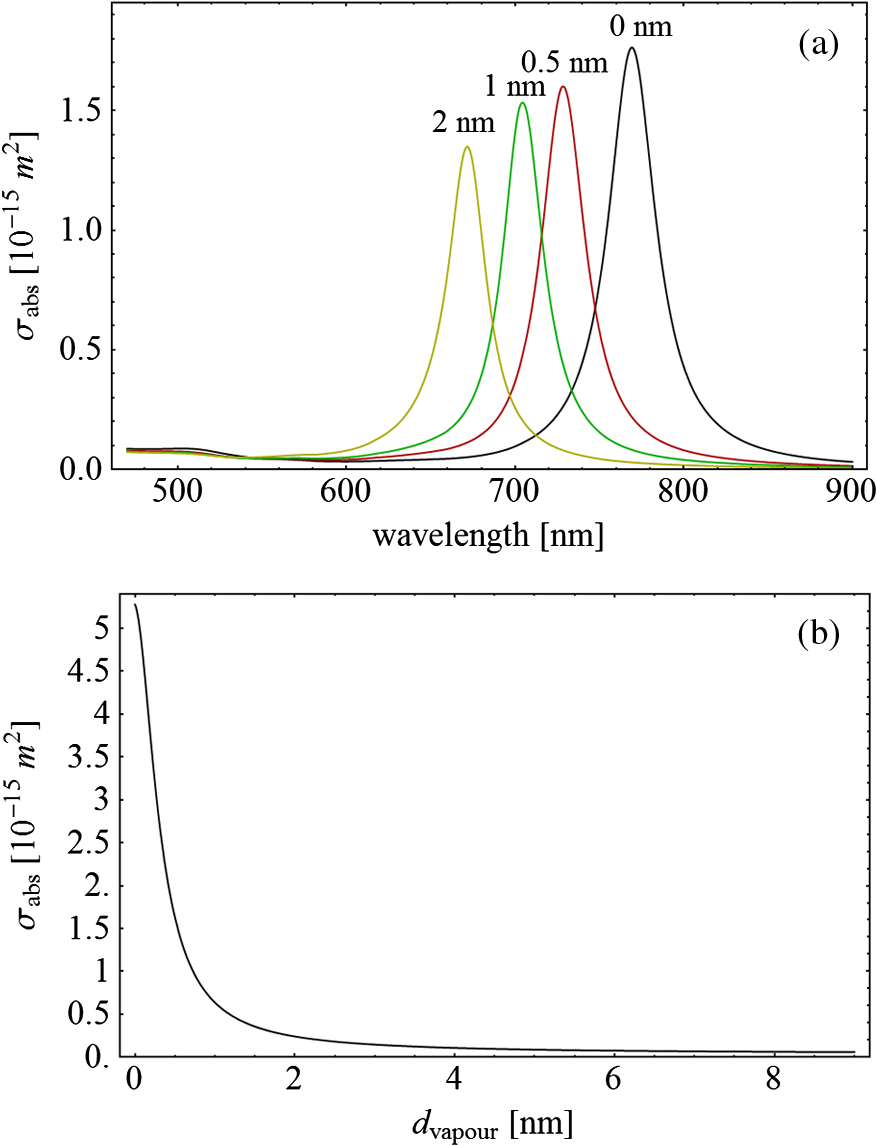 4.3.Temperature Increase Within and Around the NanorodsThe temperature in the particle is relevant for melting and shape changes that lead to permanent bleaching, whereas the temperature at the particle surface determines the formation of cavitation bubbles. Calculation of the temperatures inside and outside the particle according to Eqs. (8) to (12) show that under nanosecond irradiation the interface heat conductivity significantly affects the maximum particle temperature, but not the temperature outside of the particle (Fig. 8). Fig. 8Calculated temperature increase versus distance from the particle center for an infinite interface conductivity as well as for and . 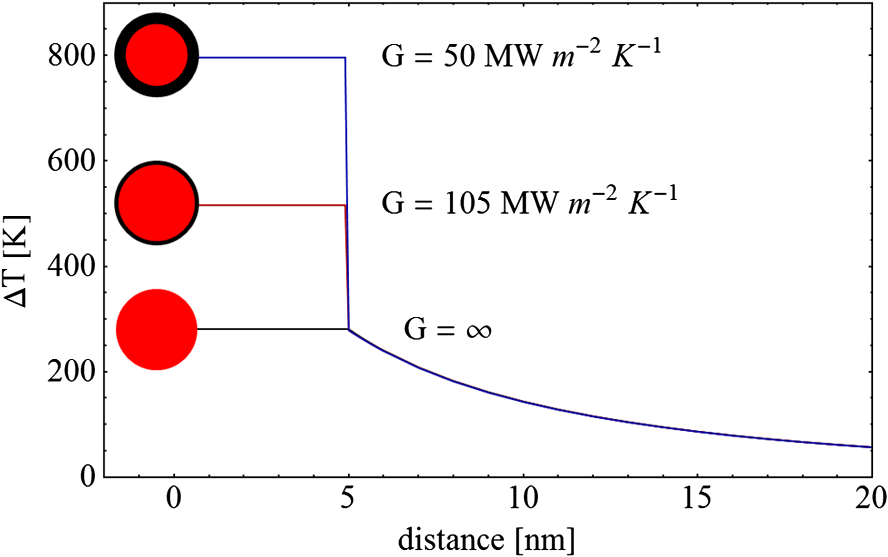 Obviously, the outer-temperature profile is predominately determined by the properties of the surrounding the medium, which dissipates the heat. For the interface conductivity , which is expected for gold particle in water, the temperature in the particle is 1.86 times the water temperature at the particle surface. Above a certain threshold temperature, probably the temperature of spinodal decomposition around 300°C, a vapor bubble is formed around the particles and rapidly expands from the particle surface. Due to the drastic nonlinear change of the optical and thermal properties of the system, temperatures can only be determined with Eqs. (8) to (12) until the particle surface reaches the spinodal point by a temperature increase of approximately 280 K. When a cavitation bubble is formed, absorption nearly instantaneously decreases and heat conduction breaks down. The nanorods absorption cross-section is reduced from down to a lower limit of . The further fate of the particle was calculated for adiabatic conditions. It was assumed that the total energy deposited after bubble expansion increases the particle temperature until the gold melts and then provides the latent heat for the phase change. The increase of the inner energy was calculated from the integral over the irradiance of the pulse starting with expansion of the bubble at : Thus, the irradiation of the particle can be divided into three phases (Fig. 9). During phase 1, which is governed by thermal diffusion and high absorption at the irradiation wavelength, the temperature on the particle surface rapidly increases up to the spinodal temperature. This is followed by phase 2 with adiabatic conditions and with a transient-absorption loss due to the shift of the LSPR, when the particle is surrounded by the vapor atmosphere. When the melting enthalpy is provided, the nanorod reshapes to a sphere (), which leads to a further loss of absorption. In phase 3, a spherical molten particle is further heated under adiabatic conditions. Due to the low residual absorption only slight temperature increase is expected. Melting will be responsible for the permanent loss of infrared (IR) absorption, which was observed. The experimental data show permanent bleaching at irradiances above . For modeling the temperature in the particle irradiated at this threshold two cases are considerable: In the first case the melting immediately starts after bubble formation at a temperature considerably below the melting point of bulk gold and the temperature of the particle remains constant until the laser pulse has delivered the latent heat for complete melting (Fig. 9). When the bubble forms, the particle has already reached a temperature of more than 600°C, where surface melting of the particles was described.32 At the end of the melting process the particle has turned into a sphere and the LSPR has completely vanished, if the particle is solidified and is surrounded by water. In the second case, the particle is heated under adiabatic conditions within the vapor atmosphere until melting temperature of bulk gold (1064°C) is reached, and then the latent heat of melting is provided until the nanorod reshapes to a sphere. In the first case is sufficient for complete melting. For the second case, if complete melting requires higher particle temperatures, phase 3 may not be reached for the particle, and only partial melting and deformations can occur. Here, at the end of the pulse only 20% of particle is molten. However, it is expected that this is enough to permanently shift the LSPR away from the irradiation wavelength. Fig. 9(a) Calculation of the increase of the inner particle energy (solid line) after irradiation of the particle with 10-nm small-axis diameter and aspect ratio of four at . The long axis is aligned parallel to the electric field of the irradiation. A real pulse shape as shown by the measured irradiance (dashed line) was used in the calculation. (b) Calculated temperature on the particle surface (dashed line) and inside (solid line) of a nanorod. First, the particle is heated in thermal contact to the surrounding medium until the cavitation threshold on the surface is reached (phase 1). The vapor atmosphere causes transient-absorption loss and thermal isolation. If the particle starts melting due to surface effects, the particle temperature (solid line in phase II and III) remains constant until the melting enthalpy is reached (phase 2). The nanorod is converted to as spherical particle within picoseconds. In phase 3 the molten spherical particle is only marginally heated due to nearly complete loss of absorption. The dotted line curve shows a heating curve in the adiabatic phase 2 when the particle is heated until the melting temperature of bulk gold is reached.  4.4.Absorption Loss After Irradiation and Optoacoustic Measurements with Nanoparticle SamplesAbsorption spectra of gold nanorod solutions after irradiation with five laser pulses between 6.5 and revealed changes of LSPR and TSPR absorption starting above [Fig. 10(a)]. A strong monotonous decrease of peak absorption around 800 nm and a slight increase of absorption around 532 nm with increasing radiant exposure were observed [Fig. 10(b)]. This behavior indicates a shape transformation from elongated to spherical particles. Changes of the particle shape were found explicitly in TEM images taken after irradiation (Fig. 11). At lower radiant exposure partial deformation of the particles including -shapes (circles in Fig. 11) were observed. These particles seem to be at an early stage of melting, and the energy deposition was not sufficient to undergo a complete transformation to a spherical shape favored by surface tension of liquid gold. With increasing radiant exposure, the fraction of particles participating in the melting process increased, because also for lower absorption cross-sections, which may result from a nonoptimal wavelength of the LSPR band or orientation of the particle, radiant exposure was sufficient to reach melting temperatures. Thus, the number of spherical particles after irradiation increased. Remaining unaffected particles demonstrated the particle selection due to the polarized absorption. A quantitative analysis from TEM images is impractical due to the drying processes of the sample solution on the TEM grid, which results in a nonhomogeneous particle distribution. Thus, quantitative determination of the particle concentration and size distribution was not done. Fig. 10(a) UV/VIS spectra of nanorod suspension after irradiation with five pulses at 785 mm: black—non-irradiated, blue-, green-, yellow-, orange-, red-, magenta-. The arrows indicate change of absorption due to increase of the radiant exposure. (b) Change of peak absorption of the TSPR (red circles) and LSPR band (black squares) with radiant exposure. The black and the red dashed lines indicate the absorbance of nanorods that were not irradiated. 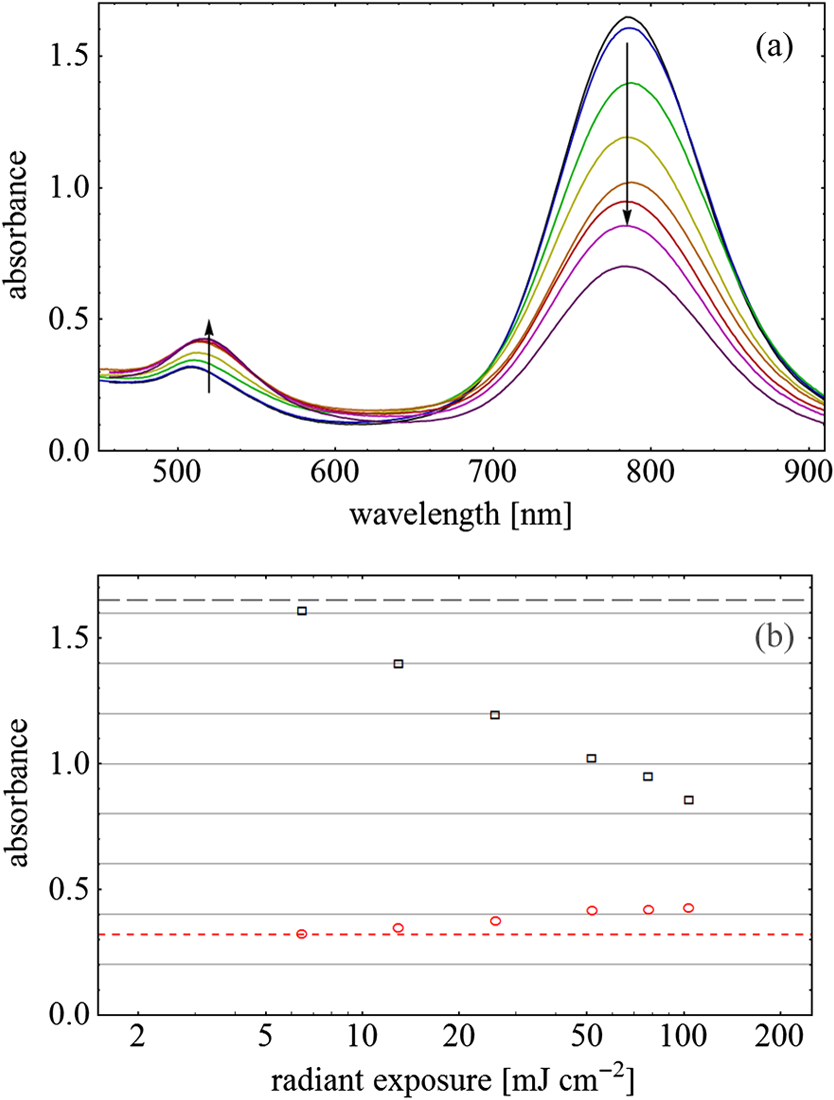 Fig. 11TEM images of nanorods after irradiation. Radiant exposure ranged from to . Black circles mark partly melted particles.  The results of spectral measurements and TEM imaging were confirmed by measurements of the transmitted energy during irradiation. When measuring the transmitted energy for each pulse we observed that the apparent absorption, which we calculated, decreased as the pulse irradiance was increased from 2 to (Fig. 12). Below a radiant exposure with the measured absorption of the first applied pulse of the series varied only within a small range from the absorption measured with the UV-VIS spectrometer. Above that exposure the fraction of absorbed light gradually decreased, a process which remained reversible up to radiant exposure with and is therefore referred to as transient bleaching (TB). In this range the mean absorption of the pulses applied in a series varied only slightly from the absorption measured for the first pulse. The absorption loss observed for irradiations with or more was nonreversible and is therefore referred to as permanent bleaching (PB). Also the mean absorption measured after reaching a stable value was significantly smaller than the absorption measured for the first pulse. This PB results in a gradual decrease from pulse to pulse, which is observed in the yellow and magenta curves for 5 and 11.6 mJ cm−2 in Fig. 12(a). Fig. 12(a) Average absorbance, which was calculated from transmitted light for a sequence of irradiating laser pulses. Each curve shows the absorbance of 500 sequential pulses at an irradiance of 0.8 (black), 2.3 (blue), 3.3 (red), 3.7 (brown), 4.0 (green), 5.0 (yellow) and (magenta). At irradiation with absorption decreased from pulse to pulse and led to permanent bleaching (PB). For irradiations below that level, the PB was not observed over the irradiation time, though the average absorbance drops with radiant exposure (TB, transient bleaching). (b) Average absorbance of the first (black squares) and the 500th pulse (red circles) versus radiant exposure. The black line (horizontal) indicates the absorbance of nanorods that were not irradiated.  Also in transient-absorption measurements the effects of transient and permanent bleaching were observed. During exposure with , the measured absorption by the nanorod sample decreased from 1.0 to approximately 0.4 (Fig. 13, black line). Transient-absorption measurements of water (gray line) demonstrate the accuracy of the measurements. The increased noise at the beginning and the end of the measurement range are due to the low pulse irradiance and the temporal modulation of the Q-switched pulses. Fig. 13Transient absorbance of a nanorod suspension during irradiation with (black line) and baseline, which was measured with distilled (gray line). 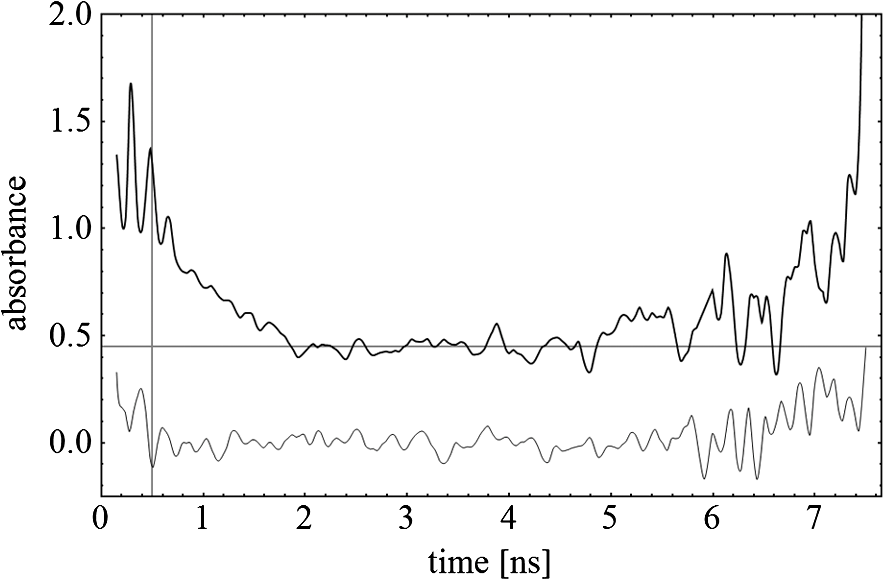 A comparison of the absorption change with temperatures calculated in and around the particle should identify the reason for the absorption loss. Based on Eqs. (1) to (13), temperatures were calculated for a nanorod with short-axis diameter of 10 nm and an aspect ratio of 4, when irradiated with a nanosecond laser pulse of (Fig. 14). Within 200 ps the temperature inside the particle (solid line) and in water at the surface (dashed line) increased by 780 and 300 K, respectively. At this point, due to the formation of a vapor bubble around the nanorod a TB set in, which reduced the absorbance from 1.65 to approximately 0.9 within the first 0.5 ns. The loss of absorbance continued down to 0.35, which was reached after 2 ns. Further, PB manifests in a decrease of the absorption measured for the first irradiation pulse (black dots) to the fifth pulse (hollow squares). Though TB reduces the absorption cross-section from to due to the thermal insulation of the gas bubble the irradiation pulse can provide the melting enthalpy within 1.5 ns. This leads to permanent bleaching and causes the absorption decrease measured from pulse to pulse. Fig. 14Comparison of the transient-absorption change measured for the first pulse (filled dots) and the fifth pulse (hollow squares) at a radiant exposure of with calculated particle temperatures inside the particle (solid line) and on the surface (dashed line). Transient and permanent bleaching (TB, PB) are visible as the differences to the initial absorption of 1.65 (black, dashed line, right). Temperature increases were calculated for a 10-nm small-axis nanorod with aligned parallel to the electric field of the incident laser light (). At a surface temperature increase of 280 K the expansion of a vapor bubble around the nanorod is assumed, which leads to the transient bleaching of absorbance from 1.65 to 0.9 in the first 0.5 ns. Further energy absorbed with provides the melting enthalpy until, at 1.5 ns, complete melting leads to permanent bleaching, which decreased absorption for following pulses.  Permanent bleaching saturates at a radiant-exposure-dependent level. Due to the distribution of particle size and orientation, only a certain fraction of particles can take part in cavitation formation, partial and complete melting. Under assumption of normal distributed particle sizes (constant rod diameter of 10 nm and varying aspect ratio between 3.55 and 4.65) as well as considering a random orientation toward the polarized light, the expected TB was calculated. It was assumed that the absorption cross-section of particles that reached 300°C on the surface dropped to as calculated in Fig. 7(b). The comparison of measured and calculated transient absorbance loss were only in decent agreement (Fig. 15) as a discrepancy between measured and calculated absorbance during irradiation remained. In the case of irradiation with the calculated absorbance decreased to 0.16 and for to 0.01, compared to the lowest measured absorbance of 0.25 and 0.10 respectively. This is quite reasonable considering the simplifications in our models and the neglect of odd shaped particles or clusters, which will not exhibit the extensive TB and PB of nanorods. Fig. 15Measured (solid lines) and calculated (dashed lines) absorption loss during the first three nanoseconds of irradiation at the LSPR absorption peak with (a) and (b) . 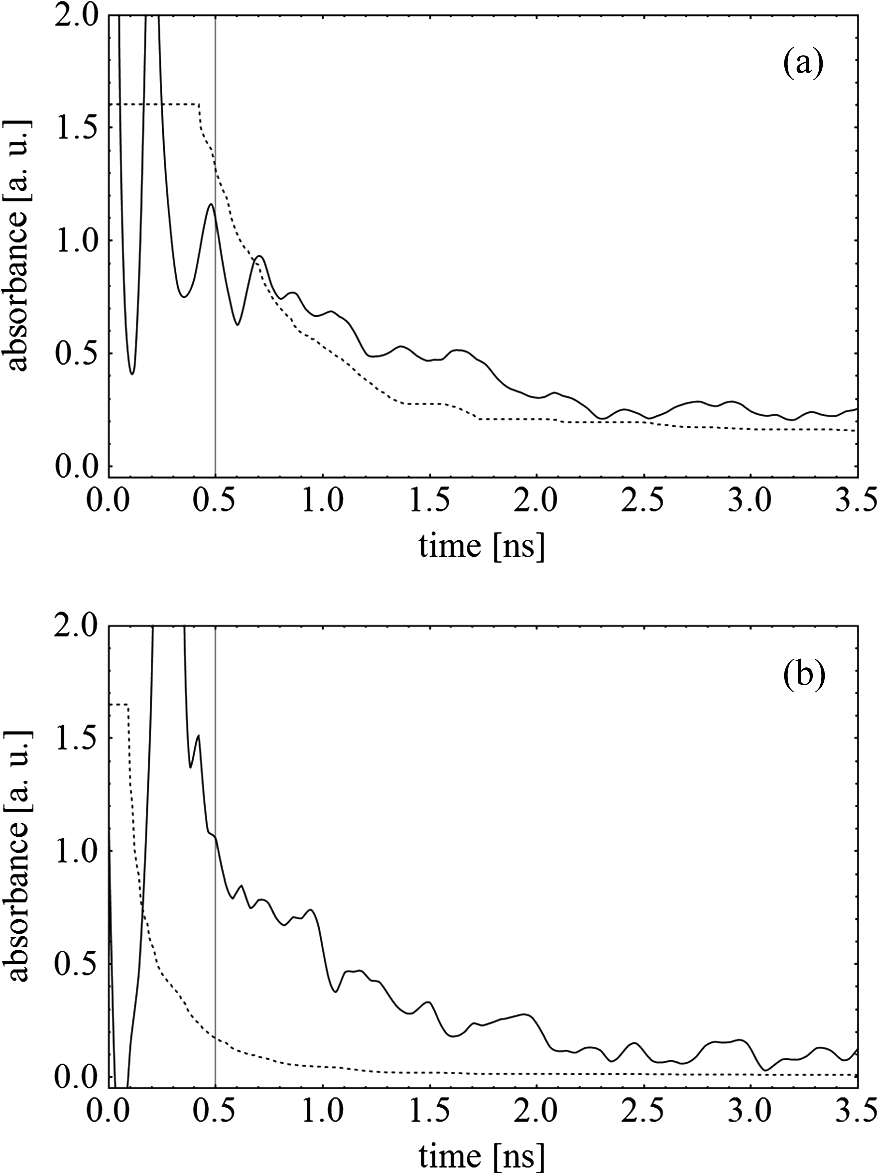 Transient bleaching was independently confirmed by the optoacoustic measurements. The normalized optoacoustic signal decreased when the nanorods were irradiated at their LSPR peak wavelength [Fig. 16(a)]. Hence the fraction of energy absorbed by the nanorods decreased with the radiant exposure. In comparison to the results of NIR irradiation the normalized signal did not decrease when the particles were irradiated with 532 nm [Fig. 16(b)]. Above , showed additional strong modulations caused by cavitation. Fig. 16The amplified output voltage from the transducer (a) was measured for pulsed irradiation of a nanorod solution at the longitudinal surface plasmon resonance peak wavelength at radiant exposures ranging from 1.5 to . The optoacoustic signal increases with . The corresponding normalized optoacoustic signals (b) exhibit decreasing amplitude (arrows) with increasing irradiation above . For irradiations at 532 nm with radiant exposures ranging from 0.9 to remained constant above strong signal increase and change of the signal form were observed. 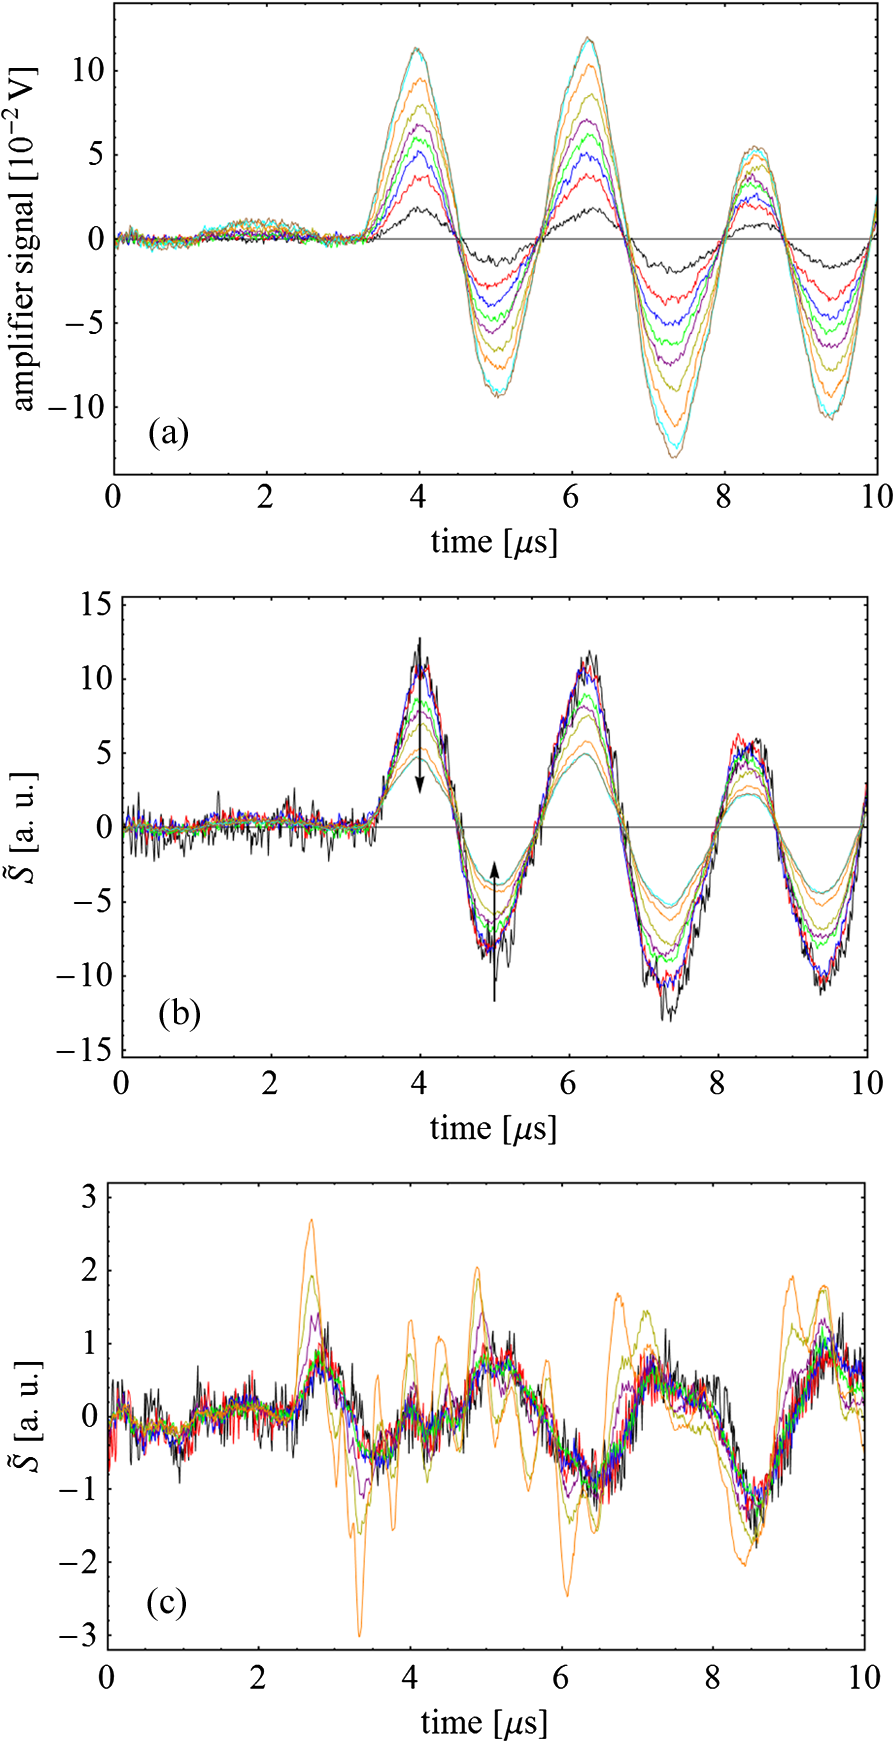 5.DiscussionWhen irradiating nanoparticles with nanosecond pulsed laser, a variety of thermal and mechanical effects are expected. Medical applications (e.g., cell destruction or contrast enhancement in optoacoustic imaging) are related to the deposited energy and resulting temperature increase within and around the particle. Efficient cell destruction mediated by nanorods requires radiant exposures that inevitably lead to cavitation, which is also the cause for contrast enhancement in optoacoustic diagnostics, where cell death must be prevented. Direct thermal damage is for two reasons most likely not responsible for the cell damage in nanosecond irradiation times.
Our thermal model helped to clarify the role of transient and permanent bleaching of the plasmon-resonance absorption of irradiated nanorods. The response to laser pulses with durations above thermal confinement is described. The model considers thermal conduction and the change of optical properties of the nanoparticles due to the temperature increase. Figure 17 summarizes the effects involved in nanosecond pulsed irradiation of gold nanorods. Fig. 17Model for transient bleaching, permanent bleaching, and shape transformation during the nanosecond pulse irradiation. is the longitudinal surface plasmon resonance (LSPR) absorption cross-section of the LSPR band in the NIR.  In the experiments three fluency ranges were found, governed by nanocavitation-related transient and permanent bleaching. At irradiant exposure below transient bleaching dominates. Due to the high absorption efficiency at the LSPR peak wavelength, sufficient heat is generated within the particles, so that the surrounding water vaporizes explosively. The strong sensitivity of the LSPR absorption to the refractive indices leads subsequently to a shift of the absorption band into the visible wavelength range. A thin vapor layer of a few nanometers is sufficient to reduce, within picoseconds, the absorption at the irradiation wavelength by almost two orders of magnitude from the initial value. In the transient-absorption measurements, onset of cavitation was responsible for a strong absorption decrease within the first 0.5 ns of measurement, where the low signal prohibited definite determination. We conclude that a fast and reversible loss of particle absorption is caused by vaporization of water, as the particle surface yields a certain threshold temperature. The changing local refractive index at the particle shifts the LSPR absorption band to a smaller wavelength, reducing the absorption cross-section by two orders of magnitude. However, with increasing irradiation and thermal insulation of the particle, the residual absorption of vapor-surrounded particles was sufficient for continuous heating until particle melting occurs. TEM images of irradiated samples show partial melting resulting in deformed and odd-shaped rods. This shape transformation of the nanorods caused a permanent change in optical absorption, which was also reflected in the absorption spectra taken after irradiation. Further, with increasing radiant exposure, an increasing number of spherical particles was found in the irradiated samples. Remaining unaffected particles emphasize that permanent bleaching of the LSPR band follows transient bleaching only if further absorbed energy under thermal-isolation conditions provides the melting enthalpy. For nanorods the efficiency of absorption strongly depends on the particle size and orientation of the long axis to the incident-light polarization. In the irradiation experiments the measured signals represent an integral over the different nanocavitations around randomly distributed particles. For this reason the distinct energy dependencies of cavitation onset and expansion of the vapor bubble or possible radius of impact could not be determined. Only single-particle experiments will be able clarify these processes in detail. The effectiveness of IR irradiated nanorods depends on their LSPR absorption, which is determined by the shape of the particles and the refractive index of the surrounding medium. Both a change of the refractive index and a change the particle shape lead to a loss of absorption. The absorption loss due to nanocavitation occurs at lower radiant exposure, starts on a picosecond timescale and is transient, whereas the change of the particle size, which is observed at a slightly higher exposure, is permanent. The reshaping is always accompanied by nanocavitation and transient bleaching. For the targeted cell killing by nano-cavitation, transient bleaching limits the effect of a single pulse, whereas permanent bleaching prevents an additive effect of a pulse series. Though nanocavitation reduces also the absorption of spherical particles at 530 nm by 60% to 70%, there is still at least an order magnitude higher residual absorption, which together with the insulation by the bubble further increases the particle temperature. This leads, according to the optoacoustic (OA) measurements, to larger cavitation bubbles. Beside the bleaching effects, the polarization dependence of the LSPR band reduces the effectiveness of the nanorods. In principle, circular polarized light will increase the total absorbed energy by interacting with the component of the particle orientation which lies in the plane perpendicular to the direction of the beam propagation. Still, a huge number of particles not aligned perpendicularly to the propagation axis will be less optimally excited. We tested irradiation with circular polarized light, but did not see much improvement in cell killing. Hence, compared to nanospheres, the nanorods suffer not only from considerably stronger bleaching, but also from an orientation-dependent absorption. 6.ConclusionsIn conclusion, gold nanorods in water exhibit an extreme sensitivity of their LSPR peak position to a bubble formation around particles, leading to bleaching during the laser pulse. This bleaching is reversible as long as further energy, which is absorbed with lower efficiency, does not heat the particles above the melting point. In case the energy density within the particle reaches the melting enthalpy, partial or even complete melting will cause permanent bleaching. Thus, the biological experiments of cell killing with NIR irradiated nanorods underlie self-limiting effects. The energy deposition at the NIR absorption maximum is strongly limited, together with the mechanical destruction range. In addition to a photothermal reshaping of the gold nanorods,33 the rapid shift of the LSPR peak position already limits the effects of nanorods on cells during nanosecond pulsed irradiation. The higher cell-killing efficiency of nanorods when irradiated with nanosecond pulses at 532 nm is also explained by our calculations. The TSPR peak absorption band around 520 nm varies only by 40% due to orientation to the electric-field vector of the incident light to the partial orientation, which is much lower compared to the total loss of the LSPR absorption. Also, an expanding vapor bubble has no limiting impact on TSPR absorption band. Hence, it is possible to deposit thermal energy in a larger fraction of particles on the cell surface by irradiating with 532 nm than with pulsed NIR radiation. In addition, melting of nanorods does not lead to a permanent bleaching of TSPR absorption, but even increases it. Thus, irradiation around the TSPR absorption band is much more efficient, while the application of rod-shaped nanoparticles for the use of cell destruction with nanosecond irradiation around the LSPR band is self-limited by transient bleaching and permanent melting effects. Ultrafast single-particle transient-absorption spectroscopy is underway to investigate the dynamics of nanocavitation more precisely. Future studies will primarily concentrate on cavitation threshold, expansion speed and radius of the vapor bubbles. Further, the interaction of nanocavitation with cell membranes will be studied. These investigations will provide the base for new applications of nanorods in cell killing or as a contrast agent in optoacoustic imaging. AcknowledgmentsWe thank colleagues at the Institute of Molecular Medicine and Experimental Immunology, in particular Ina Hahn, for the helpful discussions. We also thank Heidrun Keul of the DWI at the RWTH Aachen for providing additional nanoparticles. The work was supported by the German Ministry of research (BMBF, 13N9175, NP-SRT). ReferencesG. Hüttmannet al.,
“High precision cell surgery with nanoparticles?,”
Med. Laser Appl., 17
(1), 9
–14
(2002). http://dx.doi.org/10.1078/1615-1615-00039 Google Scholar
C. Yaoet al.,
“Influence of laser parameters on nanoparticle-induced membrane permeabilization,”
J. Biomed. Opt., 14
(5), 054034
(2009). http://dx.doi.org/10.1117/1.3253320 JBOPFO 1083-3668 Google Scholar
B. Radtet al.,
“Laser-generated micro- and nanoeffects: inactivation of proteins coupled to gold nanoparticles with nano- and picosecond pulses,”
Proc. SPIE, 4432
(1), 16
–24
(2001). http://dx.doi.org/10.1117/12.446518 PSISDG 0277-786X Google Scholar
B. Radt, Inaktivierung von Proteinen und Zellen durch Laserbestrahlung von Mikropartikeln, Institute of Biomedical Optics, Lübeck
(2002). Google Scholar
J. Neumann, Mikroskopische Untersuchungen zur laser- induzierten Blasenbildung und -dynamik an absorbierenden Mikropartikeln, Institute of Biomedical Optics, Lübeck
(2005). Google Scholar
D. O. LapotkoE. LukianovaA. A. Oraevsky,
“Selective laser nano-thermolysis of human leukemia cells with microbubbles generated around clusters of gold nanoparticles,”
Lasers Surg. Med., 38
(6), 631
–642
(2006). http://dx.doi.org/10.1002/(ISSN)1096-9101 LSMEDI 0196-8092 Google Scholar
V. P. Zharovet al.,
“Photothermal nanotherapeutics and nanodiagnostics for selective killing of bacteria targeted with gold nanoparticles,”
Biophys. J., 90
(2), 619
–627
(2006). http://dx.doi.org/10.1529/biophysj.105.061895 BIOJAU 0006-3495 Google Scholar
E. Y. HlebD. O. Lapotko,
“Photothermal properties of gold nanoparticles under exposure to high optical energies,”
Nanotechnology, 19
(35), 355702
(2008). http://dx.doi.org/10.1088/0957-4484/19/35/355702 NNOTER 0957-4484 Google Scholar
L. Tonget al.,
“Gold nanorods mediate tumor cell death by compromising membrane integrity,”
Adv. Mater., 19
(20), 3136
–3141
(2007). http://dx.doi.org/10.1002/adma.200701974 ADVMEW 0935-9648 Google Scholar
C. M. Pitsillideset al.,
“Selective cell targeting with light-absorbing microparticles and nanoparticles,”
Biophys. J., 84
(6), 4023
–4032
(2003). http://dx.doi.org/10.1016/S0006-3495(03)75128-5 BIOJAU 0006-3495 Google Scholar
S. Tersteggeet al.,
“Laser-assisted photoablation of human pluripotent stem cells from differentiating cultures,”
Stem Cell Rev., 6
(2), 260
–269
(2010). Google Scholar
G. HüttmannC. YaoE. Endl,
“New concepts in laser medicine: towards a laser surgery with cellular precision,”
Med. Laser Appl., 20
(2), 135
–139
(2005). http://dx.doi.org/10.1016/j.mla.2005.03.010 Google Scholar
H. LiaoC. L. NehlJ. H. Hafner,
“Biomedical applications of plasmon resonant metal nanoparticles,”
Nanomedicine (Lond.), 1
(2), 201
–208
(2006). http://dx.doi.org/10.2217/17435889.1.2.201 Google Scholar
K. Kimet al.,
“Photoacoustic imaging of early inflammatory response using gold nanorods,”
Appl. Phys. Lett., 90
(22), 223901
(2007). http://dx.doi.org/10.1063/1.2743752 APPLAB 0003-6951 Google Scholar
P.-C. Liet al.,
“In vivo photoacoustic molecular imaging with simultaneous multiple selective targeting using antibody-conjugated gold nanorods,”
Opt. Express, 16
(23), 18605
–18615
(2008). http://dx.doi.org/10.1364/OE.16.018605 OPEXFF 1094-4087 Google Scholar
A. Agarwalet al.,
“Targeted gold nanorod contrast agent for prostate cancer detection by photoacoustic imaging,”
J. Appl. Phys., 102
(6), 064701
(2007). http://dx.doi.org/10.1063/1.2777127 JAPIAU 0021-8979 Google Scholar
C. F. BohrenD. R. Huffman, Absorption and Scattering of Light by Small Particles, Wiley, New York
(1983). Google Scholar
H. C. van de Hulst, Light Scattering by Small Particles, Dover Publications Inc., Mineola, NY
(1981). Google Scholar
U. KreibigM. Vollmer, Optical Properties of Metal Clusters, 25th ed.Springer, Berlin, Heidelberg
(1995). Google Scholar
C. Sönnichsen, Plasmons in Metal Nanostructures, Cuvillier, Göttingen
(2001). Google Scholar
J. Pérez-Justeet al.,
“Gold nanorods: synthesis, characterization and applications,”
Coord. Chem. Rev., 249
(17–18), 1870
–1901
(2005). http://dx.doi.org/10.1016/j.ccr.2005.01.030 CCHRAM 0010-8545 Google Scholar
S. LinkM. A. El-Sayed,
“Spectral properties and relaxation dynamics of surface plasmon electronic oscillations in gold and silver nanodots and nanorods,”
J. Phys. Chem. B, 103
(40), 8410
–8426
(1999). http://dx.doi.org/10.1021/jp9917648 JPCBFK 1520-6106 Google Scholar
S. LinkM. A. El-Sayed,
“Optical properties and ultrafast dynamics of metallic nanocrystals,”
Ann. Rev. Phys. Chem., 54
(1), 331
–366
(2003). http://dx.doi.org/10.1146/annurev.physchem.54.011002.103759 ARPLAP 0066-426X Google Scholar
L. M. Liz-Marzán,
“Nanometals: formation and color,”
Mater. Today, 7
(2), 26
–31
(2004). http://dx.doi.org/10.1016/S1369-7021(04)00080-X MATOBY 0096-4867 Google Scholar
P. Mulvaney,
“Surface plasmon spectroscopy of nanosized metal particles,”
Langmuir, 12
(3), 788
–800
(1996). http://dx.doi.org/10.1021/la9502711 LANGD5 0743-7463 Google Scholar
S. W. PrescottP. Mulvaney,
“Gold nanorod extinction spectra,”
J. Appl. Phys., 99
(12), 123504
(2006). http://dx.doi.org/10.1063/1.220F12 JAPIAU 0021-8979 Google Scholar
E. S. KooijB. Poelsema,
“Shape and size effects in the optical properties of metallic nanorods,”
Phys. Chem. Chem. Phys., 8
(28), 3349
–3357
(2006). http://dx.doi.org/10.1039/b518389h PPCPFQ 1463-9076 Google Scholar
P. B. JohnsonR. W. Christy,
“Optical constants of noble metals,”
Phys. Rev. B, 6
(12), 4370
–4379
(1972). http://dx.doi.org/10.1103/PhysRevB.6.4370 PRBMDO 0163-1829 Google Scholar
H. S. CarslawJ. C. Jaeger, Conduction of Heat in Solids, Oxford University Press, Oxford
(1959). Google Scholar
A. Plechet al.,
“Laser-induced heating and melting of gold nanoparticles studied by time-resolved x-ray scattering,”
Phys. Rev. B, 70
(19), 195423
(2004). http://dx.doi.org/10.1103/PhysRevB.70.195423 PRBMDO 1098-0121 Google Scholar
M. Rohret al.,
“Quantum yields of the photochromic equilibrium between bacteriorhodopsin and its bathointermediate : femto-and nanosecond optoacoustic spectroscopy,”
J. Phys. Chem., 96
(14), 6055
–6061
(1992). http://dx.doi.org/10.1021/j100193a074 JPCHAX 0022-3654 Google Scholar
Y. WangS. TeitelC. Dellago,
“Structural and shape transformation of gold nanorods studied by molecular dynamics simulation,”
J. Comput. Theor. Nanosci., 4
(2), 282
–290
(2007). 1546-1955 Google Scholar
H. Takahashiet al.,
“Photothermal reshaping of gold nanorods prevents further cell death,”
Nanotechnology, 17
(17), 4431
–4435
(2006). http://dx.doi.org/10.1088/0957-4484/17/17/024 NNOTER 0957-4484 Google Scholar
|