
|
|
|
Hearing loss is the most frequent sensory deficit in the human population, affecting more than 250 million people in the world. The National Center for Health Statistics estimates that 37 million adults (17%) in the United States have hearing difficulty. Analysis of a large database of audiometric records from the University of Minnesota reveals that 39% of patients diagnosed with hearing loss have conductive hearing loss (CHL) either alone (15%) or in combination with SNHL (24%).1 There are several contemporary audiological tests that are commonly used to diagnose middle ear function for CHL. However, these contemporary tests of middle ear function do not provide the vibration of the ossicles behind an intact tympanic membrane (TM). For example, audiometry can identify an air-bone gap in hearing thresholds, the hallmark of CHL, but not the cause of the hearing loss.2 Tympanometry can measure the compliance of the whole eardrum and middle ear complex but does not provide specific information about the ossicular chain.3 A normal tympanogram does not rule out an ossicular problem, and an abnormal tympanogram does not rule it in.4 Laser-Doppler vibrometry (LDV) has been widely used to investigate middle ear function in animals5 and human temporal bones with the sound-induced motion of the TM.6–8 Although the direct measurement of TM mobility can be measured with LDV, and it seems to be a natural tool for investigating CHL, but it can’t provide direct vibration measurement of the ossicular chain through the intact TM. Moreover, it is not clear that this technology would be successful in identifying the causes of CHL when the eardrum or the ossicular chain has been altered, such as in patients who have had surgeries for chronic otitis media or cholesteatoma. Although the feasibility of OCT has been demonstrated to image the morphology of human middle ear and TM,9,10 the use of optical coherence tomography (OCT) for middle vibrometry in humans has not previously been reported. In this study, we report a novel application of spectral domain phase-sensitive optical coherence tomography (SD PS-OCT)11 to measure vibrations of middle ear (ME) structures such as the TM and ossicular chain with high sensitivity though the intact TM. The technique is based on SD PS-OCT to produce a depth-resolved vibration map by using Fourier transform (FT) analysis of the measured phase changes in the spectral interferograms induced by the acoustic stimulation of ME structures. In this letter, we present, as an initial demonstration, the application of SD PS-OCT to 2-D cross-sectional vibration imaging of normal and abnormal human cadaver temporal bone. Figure 1 depicts an experimental setup of SD PS-OCT, which includes a fiber-based, Michesion type spectral-domain interferometer. A broadband, 1,300-nm superluminescent diode (56-nm FWHM) was coupled into the interferometer via an optical coupler. The spectrometer consisted of a 50-mm focal length collimator, a transmitting grating, an achromatic lens with a 150-mm focal length, and a 14-bit, 512-pixel InGaAs line-scan camera with a maximum acquisition rate of 20 kHz. This spectrometer setup had a spectral resolution of 0.155 nm, which gave a maximum imaging depth of (in air).The measured axial imaging resolution of the system was in air, and with a 50-mm-focal-length objective lens in the sample arm, the lateral resolution was . The phase sensitivity of the system was estimated to be around 7.5 mrad, corresponding to a displacement sensitivity of 785 pm. Fig. 1Experimental setup of the SD-PS OCT system. L1–L5, lenses; PC, polarization controller; FC, fiber coupler; DG, diffraction grating; OC, optical circulator; RM, reference mirror; SLD, superluminescent diode; DCM, diachronic mirror; COMP, computer.  In order to extract the vibrational information from the ME structures, a MB mode-scanning protocol was implemented for acquiring the spectral domain interferogram data. The MB-mode scan acquires M-scans along the transverse direction at 200 transverse points with a scan range of 3 mm. Within each step, the data acquisition time was , and it requires to scan 200 steps across the sample surface [denoted by the dotted rectangle in Fig. 2(a)]. During image acquisition, the temporal bone was stimulated using an acoustic stimulation frequency of 500 Hz, as shown in Fig. 1. Then the acquired interferogram signals were analyzed using a custom processing phase algorithm to map the depth-resolved cross-sectional vibration. First, the reference background OCT image was subtracted from the data sets, and fast Fourier transformations (FFTs) were taken for each column of the M-mode data sets to calculate the complex OCT signals from the spectral data. Amplitude of the FFT was used to reconstruct the conventional OCT structural image. The phase was then calculated for each corresponding pixel of the M-mode image, and the phase differences between adjacent A-lines were computed, which were proportional to the modulation of the optical path difference induced by the acoustic stimulation. The phase difference between adjacent -scans, and , can be calculated as where denotes the complex conjugate. Then the FTs of this measured phase differences [i.e., Eq. (1)] can be calculated as , where is the frequency variable of interest for the ME acoustic stimulation, and and are the magnitude and phase of the signal at frequency . Thus, peak magnitude of FFT within of the modulation frequency (500 Hz) was taken for each M-mode OCT data set, which was used to obtain a 2-D depth-resolved cross-sectional vibration map.Fig. 2(a) Schematic of transverse image of ME orthogonal to Malleus (Ma). (b) OCT cross-sectional structural image corresponding to the dotted rectangle in (a). TM indicates tympanic membrane; Ma, malleus; In, incus.  To demonstrate the feasibility of imaging depth-resolved cross-sectional vibration map of ME structures through the intact TM, we imaged the excised right and left intact temporal bones harvested from a fresh human cadaver, without previous fixation. This avoided changes in optical properties associated with fixation. We obtained these human temporal bones with a history of otologic disease from the Oregon Health and Science University (OHSU) Body Donation Program. The obtained temporal bones were stored in lactate Ringer’s at 4°C before and between measurements. The TM was left intact. Access to the ME and the ossicles were obtained by posterior tympanotomy, removal of the vertical segment of the facial nerve, and posterior atticotomy. The ME space was open to air during OCT vibrometry measurements. In order to deliver acoustic stimulus during imaging, a speaker probe tube was placed near the eardrum with an acoustic sound level of 65 dB SPL at 500 Hz. During typical structural imaging mode, the prepared temporal bone was placed in a dish and oriented towards the OCT beam, as shown in Fig. 2(a). The corresponding full-range cross-sectional OCT structural image of the right temporal bone is shown in Fig. 2(b). The mirror image generated due to the symmetric property of FFT was removed manually for ease of interpretation of the image. Important anatomical features in the ME such as TM, malleus (Ma), and incus (In) are clearly identified in the OCT image. Next, we tested the feasibility of our proposed SD PS-OCT system for imaging the acoustically induced vibration levels of ME structures through the intact TM. The left temporal bone of the human cadaver was imaged using the proposed MB-mode scanning protocol with an acoustic stimulation level of 65 dB SPL at 500 Hz. Figure 3(a) shows the full-range OCT cross-sectional structural image of ME structures of the left temporal bone of the human cadaver, and Fig. 3(b) shows a corresponding cross-sectional vibrational image. Fig. 3(a) Structural image of left temporal image. (b) Corresponding vibration image. TM indicates tympanic membrane; Ma, malleus; In, incus.  According to the standard model of ME mechanics, the displacements in the ossicles are small compared to those in the TM.12 At low frequencies, the angular velocities of the Ma and In are similar (both in amplitude and phase), and they rotate approximately around a common axis, while at high frequencies, the angular-velocity amplitude and phase of malleus and incus are relatively different, indicating that they rotate around different axes. We plotted the vibration amplitude levels of TM, umbo (U), Ma, and In, and the measured vibration amplitude levels are well correlated with the standard ME model at low acoustic stimulation frequency,10 which is shown in Fig. 4. Fig. 4Relative vibration amplitude plot of different ME structures of a normal human cadaver temporal bone. 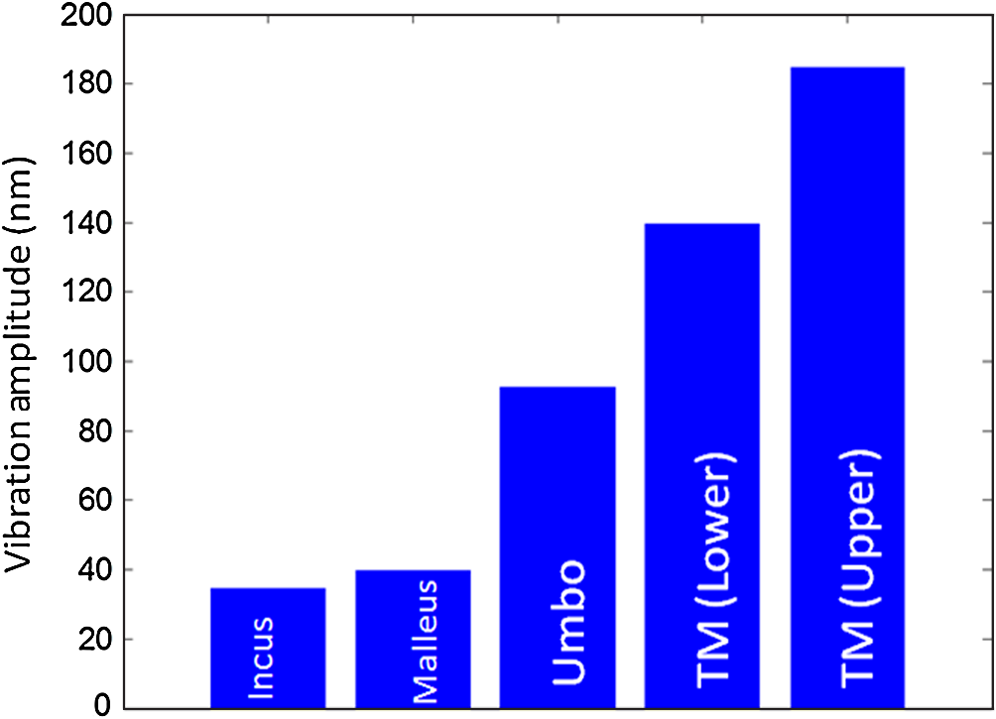 To test the diagnostic utility of our proposed system, we imaged the right temporal bone of the same cadaver, which has an incidental finding of ossicular fixation. Fig. 5(a) shows the OCT structural image, and Fig. 5(b) shows the corresponding vibration image with an acoustic stimulation level of 65 dB SPL at 500 Hz. Compared with normal ME, the ear with ossicular fixation demonstrates reduced vibration of the TM and no vibration from the ossicular chain, due to fixation of the In and the stapes. Fig. 5(c) and 5(d) show the structural and corresponding vibration image after the In and the stapes are freed and the incudostapedial joint is severed. The maneuvers mobilize the ossicular chain and consequently increase its vibration amplitude, as shown in Fig. 5(d). In summary, we have demonstrated the feasibility of SD PS-OCT for imaging depth-resolved vibration of ME structures through the intact TM, and its diagnostic utility on a human cadaver temporal bone. The ability of SD PS-OCT to perform ME vibrometry through intact TM suggests that there may be applications in the diagnosis and preclinical evaluation of ME abnormalities. Fig. 5(a) Structural image of right temporal bone with ossicular fixation. (b) Corresponding vibrational image. (c) Structural image of right temporal bone after mobilization of In and stapes and separation of the incudostapedial joint. (d) Corresponding vibrational image. TM indicates tympanic membrane; Ma, malleus; In, incus; SF, Stapes footplate.  AcknowledgmentsThis work was supported by grants from the National Institute of Deafness and other Communication Disorders (R01DC0005983 and R01DC00141), and the National Center for Research Resources (KL2RR024141). ReferencesR. H. MargolisG. Saly,
“Asymmetric hearing loss: definition, validation, and prevalence,”
Otol. Neurotol., 29
(4), 422
–431
(2008). http://dx.doi.org/10.1097/MAO.0b013e31816c7c09 1531-7129 Google Scholar
J. Hood,
“The principles and practice of bone conduction audiometry,”
Laryngoscope , 70 1211
–1228
(1960). http://dx.doi.org/10.1288/00005537-196009000-00001 0023-852X Google Scholar
R. G. WilliamsP. M. Haughton,
“Tympanometric diagnosis of middle ear effusions,”
J. Laryn. Otol., 91
(11), 959
–962
(1977). Google Scholar
P. M. HaughtonK. Pardoe,
“A comparison of otoscopy and tympanometry in the diagnosis of middle ear effusion,”
Clin. Phys. Physiol. Meas., 3
(3), 213
–220
(1982). http://dx.doi.org/10.1088/0143-0815/3/3/005 CPPMD5 0143-0815 Google Scholar
J. J. Rosowskiet al.,
“Measurements is of middle-ear function in the Mongolian gerbil, a specialized mammalian ear,”
Audiol Neurootol., 4
(3–4), 129
–136
(1999). http://dx.doi.org/10.1159/000013831 ANEOFO 1420-3030 Google Scholar
M. S. M. G. VlamingL. Feenstra,
“Studies of the mechanics of the normal human middle ear,”
Clin. Otolaryngol., 11
(5), 353
–363
(1986). COTSD2 Google Scholar
N. Stascheet al.,
“Middle ear transmission disorder: tympanic membrane vibration analysis by laser-Doppler vibrometry,”
Acta Otolaryngol., 114
(1), 59
–63
(1994). Google Scholar
R. L. GoodeG. BallS. Nishihara,
“Measurement of umbo vibration in human subjects—methods and possible clinical applications,”
Am. J. Otol., 14
(3), 247
–251
(1993). http://dx.doi.org/10.1016/0196-0709(93)90068-I AJOTDP 0196-0709 Google Scholar
H. R. Djalilianet al.,
“Imaging the human tympanic membrane using optical coherence tomography in vivo,”
Otol. Neurotol., 29
(8), 1091
–1094
(2008). http://dx.doi.org/10.1097/MAO.0b013e31818a08ce 1531-7129 Google Scholar
R. Heermannet al.,
“Application of optical coherence tomography (OCT) in middle ear surgery,”
Laryngorhinootologie, 81
(6), 400
–405
(2002). http://dx.doi.org/10.1055/s-2002-32213 0935-8943 Google Scholar
R. K. WangA. L. Nuttall,
“Phase-sensitive optical coherence tomography imaging of the tissue motion within the organ of Corti at a subnanometer scale: a preliminary study,”
J. Biomed. Opt., 15
(5), 056005
(2010). http://dx.doi.org/10.1117/1.3486543 JBOPFO 1083-3668 Google Scholar
H. Caiet al.,
“A biological gear in the human middle ear,”
Proc. COMSOL Conf., 28
(46),
(2010). Google Scholar
|


