|
|
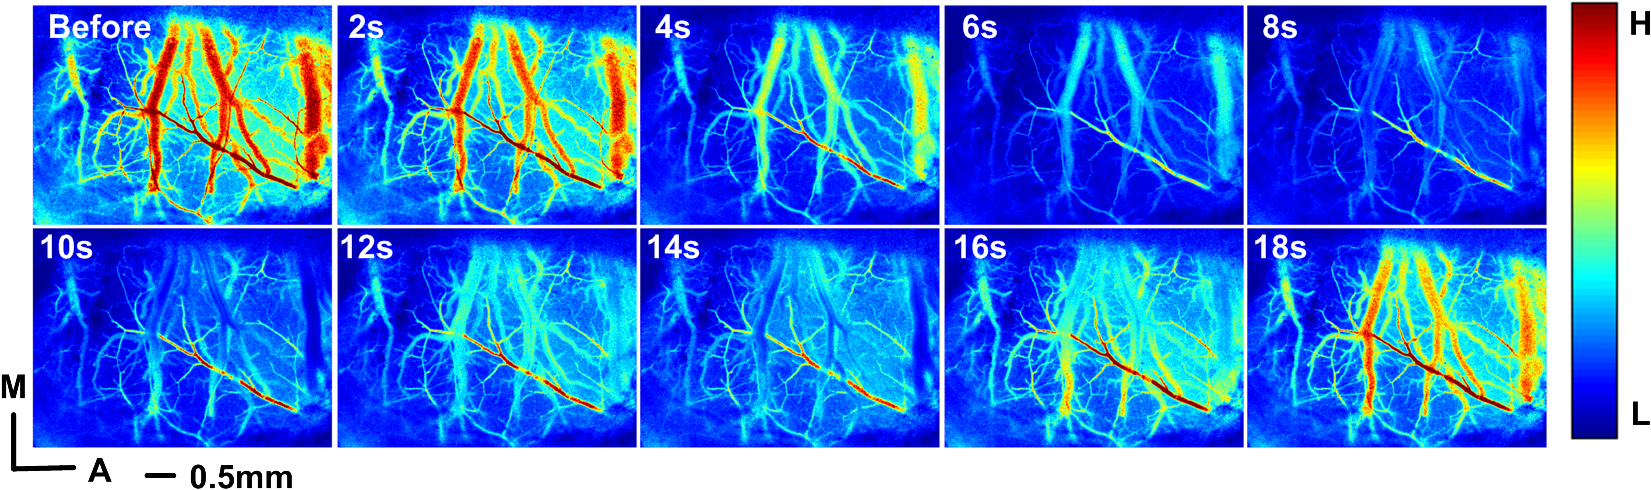
1.IntroductionCerebral hypoperfusion is often induced by hypovolemia, artery stenosis, atherosclerosis, etc., and results in a deficiency of oxygen needed in cerebral metabolism. It brings damage to the brain with different severity by causing ischemia of neural cells, such as impairment of working memory and gait performance, ocular ischemic syndrome, white matter lesions, cognitive dysfunction, and so on.1–6 Studies indicate that cerebral hypoperfusion often comes along with stroke, Alzheimer’s disease (AD), and vascular dementia (VD),7–9 which threaten our lives due to the high mortality and disability rate. Therefore, early monitoring of the hypoperfusion and prophylactic treatment are important. The previous measurements of cerebral blood flow (CBF) in chronic cerebral hypoperfusion showed that the changes in CBF could be divided into three phases: acute ischemia phase, chronic oligemia phase, and restitution phase.10–12 In acute ischemia phase, temporal (several minutes or more) occlusion of ipsilateral or bilateral common carotid artery (CCA) can induce transient cerebral hypoperfusion. Some studies reported that CBF velocity decreased to minimum in several seconds and recovered to baseline within several minutes in transient cerebral hypoperfusion in rats using laser Doppler Flowmetry (LDF).13,14 Other studies showed that hemoglobal oxygen saturation () or hemoglobin oxygenation decreased in several seconds immediately after the CCA occlusion using near-infrared spectroscopy (NIRS) or diffuse optical tomography (DOT).15–17 These aforementioned techniques have the potential to detect cerebral hypoperfusion at the early stage by monitoring rapid hemodynamic response or oxygen metabolism changes. However, due to the low spatial resolution of these techniques, they could only measure the average CBF or hemoglobin oxygenation changes in small areas or volumes instead of the changes in a single blood vessel, so they could not obtain accurate parameter values. Another group successfully performed dynamic observations of hemodynamic response and oxygen metabolism changes in the cortex induced by acute ischemia using laser speckle imaging (LSI) and multispectral reflectance imaging with high spatio-temporal resolution,18 nevertheless, the monitoring was short of depth information. Dysfunction of brain or necrosis of brain tissue caused by cerebral hypoperfusion could be avoided if complete detection and timely treatment are performed, especially in critical brain traumatic patients. A fast and complete detection of hypoperfusion can be used to determine whether blood transfusion is needed.19 Therefore, a complete three dimensional (3D) imaging monitoring with high spatio-temporal resolution is needed to perform early detection of cerebral hypoperfusion. The newly developed LSI is an optical technique for full field imaging of blood flow velocity without scanning.20–22 The blood flow velocity of the cerebral cortex is obtained with LSI with high spatial and temporal resolution, which exhibits great advantages in the study of physiological and pathological dynamic changes of brain blood circulation.23–27 Functional photoacoustic microscopy (fPAM) is a hybrid imaging technique that combines high optical absorption contrast and low ultrasonic scattering in biological tissues, and can image microvessels and cells with high resolution.28–33 The parameters such as and total hemoglobin concentration (HbT) of the cerebral cortex can be acquired from multiwavelength measurements by fPAM without exogenous contrast agents.34–37 Based on the detection of time-resolved ultrasonic waves, the depth information of the blood vessels in the cerebral cortex can be obtained. By combining these two techniques, it is possible to implement imaging monitoring of CBF, , and HbT in single blood vessels at different depths in the cerebral cortex with high temporal resolution. So it holds the potential in the complete assessment of hemodynamic and metabolic changes that occurred at an early time in cerebral hypoperfusion, which makes early detection of cerebral hypoperfusion possible. In this paper, we made transient cerebral hypoperfusion models in rats by ligation of unilateral common carotid artery (UCCA), LSI, and fPAM were utilized to monitor changes in CBF, , and HbT in cortex blood vessels with high spatio-temporal resolution before and after ligation of UCCA. A complete study in both cerebrovascular hemodynamic responses and brain tissue oxygen metabolic changes in transient cerebral hypoperfusion was performed. 2.Materials and Methods2.1.LSI and fPAM SystemThe schematic of our fPAM system is shown in Fig. 1(a). In brief, the system consists of a tunable dye laser (Cobra-Stretch, Sirah), a computer controlled scanner integrated with dark-field illumination and high-frequency ultrasonic detection, and a digital oscilloscope.29 The photoacoustic signals from the ultrasonic transducer were sampled by the digital oscilloscope, which was triggered by synchronized pulses produced by a fast photodiode. Simultaneously, the synchronous pulses from the digital oscilloscope were sent to the motion controller to transmit the command to the scanner, the raster scan across the plane was performed. To realize multi-wavelength fPAM, the wavelength of laser should be synchronously tuned in scanning. Another photodiode was used to monitor fluctuation of the deposition of laser energy, and the incident laser energy density on the sample surface is about , which is well within the ANSI safety standard () in the spectral regions used here. The measured lateral and axial resolution are 45 and 15 μm, respectively. The maximum imaging depth in chicken breast tissue is 3.1 mm. In our previous works, we designed a LSI system and obtained high imaging quality by improving the laser speckle contrast analysis method.20,38 As shown in Fig. 1(b), the system is made up of laser source, beam collimation and adjustment, photoelectric imaging, data collection, and image processing. The beam from the He–Ne laser illuminated the cranial window with an incident angle of about 30 deg after magnification and collimation. A series of speckle patterns were captured by a 12 bit charge coupled device (CCD) camera (Pixelfly qe, PCO; ) for subsequent data processing. The CCD camera was attached to a stereomicroscope (Z16 APO, Leica; working distance 97 mm) with a magnification of , consequently, the spatial resolution was estimated to be about 20 μm. To guarantee accurate velocity measurement, the aperture diaphragm is well adjusted to ensure that the average speckle size is about two pixels, and the variable attenuator is also well adjusted to ensure the light intensity matches the dynamic range of the CCD camera. 2.2.General Surgical PreparationsMale wistar rats () weighting 200 to 250 g, obtained from Hubei center of disease control and prevention, were used in the experiments. All experimental procedures were performed according to the institutional animal care and use committee of Hubei province. The rats were intraperitoneally anesthetized with a mixture of a-chloralose and urethane, and an additional one-fifth of the initial dose was administrated per hour to maintain a state unresponsive to toe pinching. Body temperature of the rats was kept constant at by utilizing a feedback-controlled heating pad. Left femoral artery was cannulated for continuous measurement of arterial pressure and blood gases. The anesthetized rat was placed in a stereotaxic apparatus. A midline scalp incision was made, and then an about cranial window at 3.5 mm lateral to and 3.5 mm posterior to the bregma was made with intact dura using a high speed dental drill. Normal saline was used to bath the skull for cooling during drilling. The cranial window was bathed with artificial cerebrospinal fluid to maintain physiological environment of brain and prevent cortex from drying. The photograph of a rat with a cranial window is shown in Fig. 1(c). 2.3.CCA LigationAfter the craniotomy, the rat was allowed to rest for 30 min. Then, the ipsilateral CCA ligation was performed. Since a fast occlusion and recanalization of CCA in situ is needed in the experiments, the common ligation method is not adaptive. Therefore, we utilized a special method to realize the ligation quickly and recovery simply. After a midline cervical incision, the UCCA was exposed and freed from its sheath and vagus nerve, which was carefully separated and maintained. A 4-0 silk suture was placed around the exposed UCCA, and the two ends of the suture were both pulled through a transparent silicone tube with an inner diameter of 0.8 mm and a length of 2 cm. When performing the ligation, draw the suture until the CCA is pulled into the tube for about 2 mm. Thus, the blood flow in the UCCA to ipsilateral brain was interrupted due to the stress of the tube and the pulled suture. When the CCA was completely occluded, we find that the part of CCA in the tube turned white, as shown in Fig. 1(d). After the occlusion, the tube was pulled back from the CCA for recanalization. To conduct occlusion and recanalization quickly and to avoid damage to the vessels, the tube and the suture were lubricated. 2.4.Experimental ProtocolIn each trial, the craniotomy and the ipsilateral CCA isolation in a rat was randomly arranged. Then, after a stabilization period of 30 min, the LSI and fPAM were performed, respectively. The rat was placed in a stereotaxic apparatus, LSI started at 5 min before the UCCA ligation, as a base level, and continued for 2 to –3 min after the ligation. When LSI was completed, the blood flow was restored immediately by release the ligation. After a recovery period of about 2 h, fPAM was performed. Firstly, structural images of the cortex blood vessels were obtained by a two dimension (2-D) single wavelength (584 nm) scan. Then, several blood vessels were selected to perform dual wavelength continuous b-scans for functional monitoring, the observed time points was set as same as the experiments with LSI. In our studies, the scanning step was 30 μm. Although statistical error is reduced by arranging the LSI and fPAM observation of the same rat in a random order, the time interval of the observations should be the same to guarantee the validity and reproducibility of changes of the parameters. 2.5.Image AnalysisPhotoacoustic imaging, which images the distribution of optical energy deposition (or optical absorption distribution) in tissue based on the detection of ultrasonic wave induced by absorption of pulsed laser energy, presents intrinsic physiologic specific absorption of tissues.28,39 In this paper, the maximum-amplitude projection (MAP) along the axis was used for 2-D image reconstruction. For functional parameter monitoring, a series of continuous images were acquired by sequential dual-wavelength line scanning of the same selected blood vessels. Before calculating the value, the threshold method was applied to the MAP image to eliminate the pixels with low signal-to-noise ratio. The threshold was selected as the intensity of the half-maximum of the chosen vessels, and then the pointwise value was calculated with the multi-wavelength method. Consequently, the value of each vessel was defined as the average value of located in this vessel. Here, we describe the multi-wavelength method for calculation simply. In brief, when oxyhemoglobin () and deoxyhemoglobin () are treated as the dominant absorbing compounds in blood, the image could be calculated using least-squares fitting as:34 where where Here, and are the concentrations of and , respectively. is the proportionality coefficient, and and are the molar extinction coefficients () of the two forms of hemoglobin at wavelength , respectively. is the collected photoacoustic signal with wavelength . The wavelengths of 576 and 584 nm were selected for dual wavelength continuous line scans for calculation. The HbT value of each vessel was calculated from single-wavelength line scan at 584 nm for it is an isosbestic wavelength of and . Before calculating the HbT value, the same threshold method was used as it is applied in calculation to define the pixels included for calculation of the HbT value of each vessel. The HbT value of each pixel included in the chosen vessel was defined as the intensity of the MAP image at 584 nm. Consequently, the HbT value of each vessel was defined as the average value of HbT located in this vessel. The or HbT value of each rat was achieved by averaging the or HbT value of the chosen vessels.LSI is an optical technique for the imaging of blood flow velocity. The relative flow velocity is calculated from laser speckle contrast, which is defined as a ratio of standard error and mean amplitude of optical intensity of the speckle pattern. The speckle pattern is formed by interference of diffused laser and is modulated by moving particles.20,38,40 The laser speckle temporal contrast analysis method was used to achieve high spatial resolution. A velocity image was derived from a speckle contrast image, which was calculated from 50 continuously captured frames of original laser speckle patterns. To achieve fast blood flow visualization, the graphics processing unit was used to accelerate the calculations.41 To maintain high temporal resolution, a sliding window along the time sequences of the original speckle patterns was applied to achieve the velocity images. Each original speckle pattern with index had its corresponding velocity image, which was acquired from a series of speckle patterns with the indices form speckle patterns. The velocity images were displayed in real time, and the frame rate of velocity image was 20 fps. In practical measurements, we applied a time interval of 2 s to save and display the data of the velocity image. Thus, the temporal resolution of the velocity image was 2 s in our measurements. The CBF value of each vessel was calculated by averaging the velocity in the selected area of the chosen vessel, and the CBF value of each rat was achieved by averaging the CBF value of the chosen vessels. In functional parameter measurements, about three or four micro veins with diameters ranging from about 20 to 100 μm in the partial cranial window were selected for observation according to the anatomic structure and blood flow velocity of brain blood vessels. Before calculating the time profiles of the parameters, the MAP image from PAM has been spatially co-registered with the LSI image using control point registration method based on the global affine transformation model, and the corresponding bifurcations of the same vessel in two images are usually selected as control point pairs. All the average base value of each parameter of a rat before occlusion was set to 100%, and the values of each parameter of a rat after occlusion were normalized by its base value in percent. The final dynamic profile of each parameter was averaged from all the rats in the experiments over the time. All the changed values were presented as . The paired -test was used to determine significant differences of each parameter at a given second compared to its basal level. 3.Results3.1.LSI and PAM of Rat Vasculature in the Cerebral CortexFigure 2 shows LSI image and 2D PAM image of blood vessels in the same region of a rat partial brain cortex. Although the contrast mechanism is different, LSI and PAM both can exhibit the structure of blood vessels in brain cortex explicitly with high spatial resolution. Figure 2(a) is a whitelight picture of the rat brain cortex, Fig. 2(b) shows the velocity image of the brain cortex with LSI. Because LSI is based on scattering properties of the moving scatterers in brain cortex, the structural image of the blood vessels in cortex can be obtained with good contrast by utilizing the velocity discrepancy of the scattered particles in blood vessels and surrounding brain tissue. Figure 2(c) shows the 2D PAM image of the cortex with laser wavelength of 584 nm. The structural imaging of cortex vasculature is achieved with high contrast due to the high optical absorption contrast between blood vessels and the surrounding brain tissues. As shown in Fig. 2(a)–2(c), the structural images of the brain cortex vasculature in LSI and fPAM agree well with the whitelight picture. Therefore, LSI and fPAM both have the ability to image the brain cortex vasculature with good quality, and it is the base of functional imaging by combing these two imaging techniques. As shown in Fig. 2(b), the cortex arteries with relatively high CBF velocity were imaged with high contrast, while the veins were imaged with relatively low contrast. It demonstrates that LSI has an advantage on imaging the arteries even if their calibers are much smaller than the veins. According to the difference of blood flow velocity of the vessels and their directions and calibers, one can differentiate the arterial branches from the venous ones for further functional imaging detection. In Fig. 2(b), we can identify the vessel with the arrow label of “1” to be an artery branch and the vessel with the arrow label of “2” to be a vein branch. Compared with LSI, the artery labeled with “1” and the vein labeled with “2” both have high contrast in PAM in Fig. 2(c), and both have a high signal-to-noise ratio (SNR) of about 30 dB. The small veins in the region with the label of dotted circle in Fig. 2(b) were imaged with low contrast, the detailed branches of the vessels could be hardly identified; while the corresponding PAM image in Fig. 2(c) shows the branches clearly. Fig. 2LSI and PAM image of rat partial brain cortex and the registered image of the two images. (a) Whitelight picture of the cortex, (b) LSI image of the cortex, (c) PAM image of the cortex, (d) photoacoustic section image at the location indicated by solid line in (c), and (e) the superimposition of the spatial registered PAM image on the LSI image (A, anterior; M, medial; H, high; L, low). 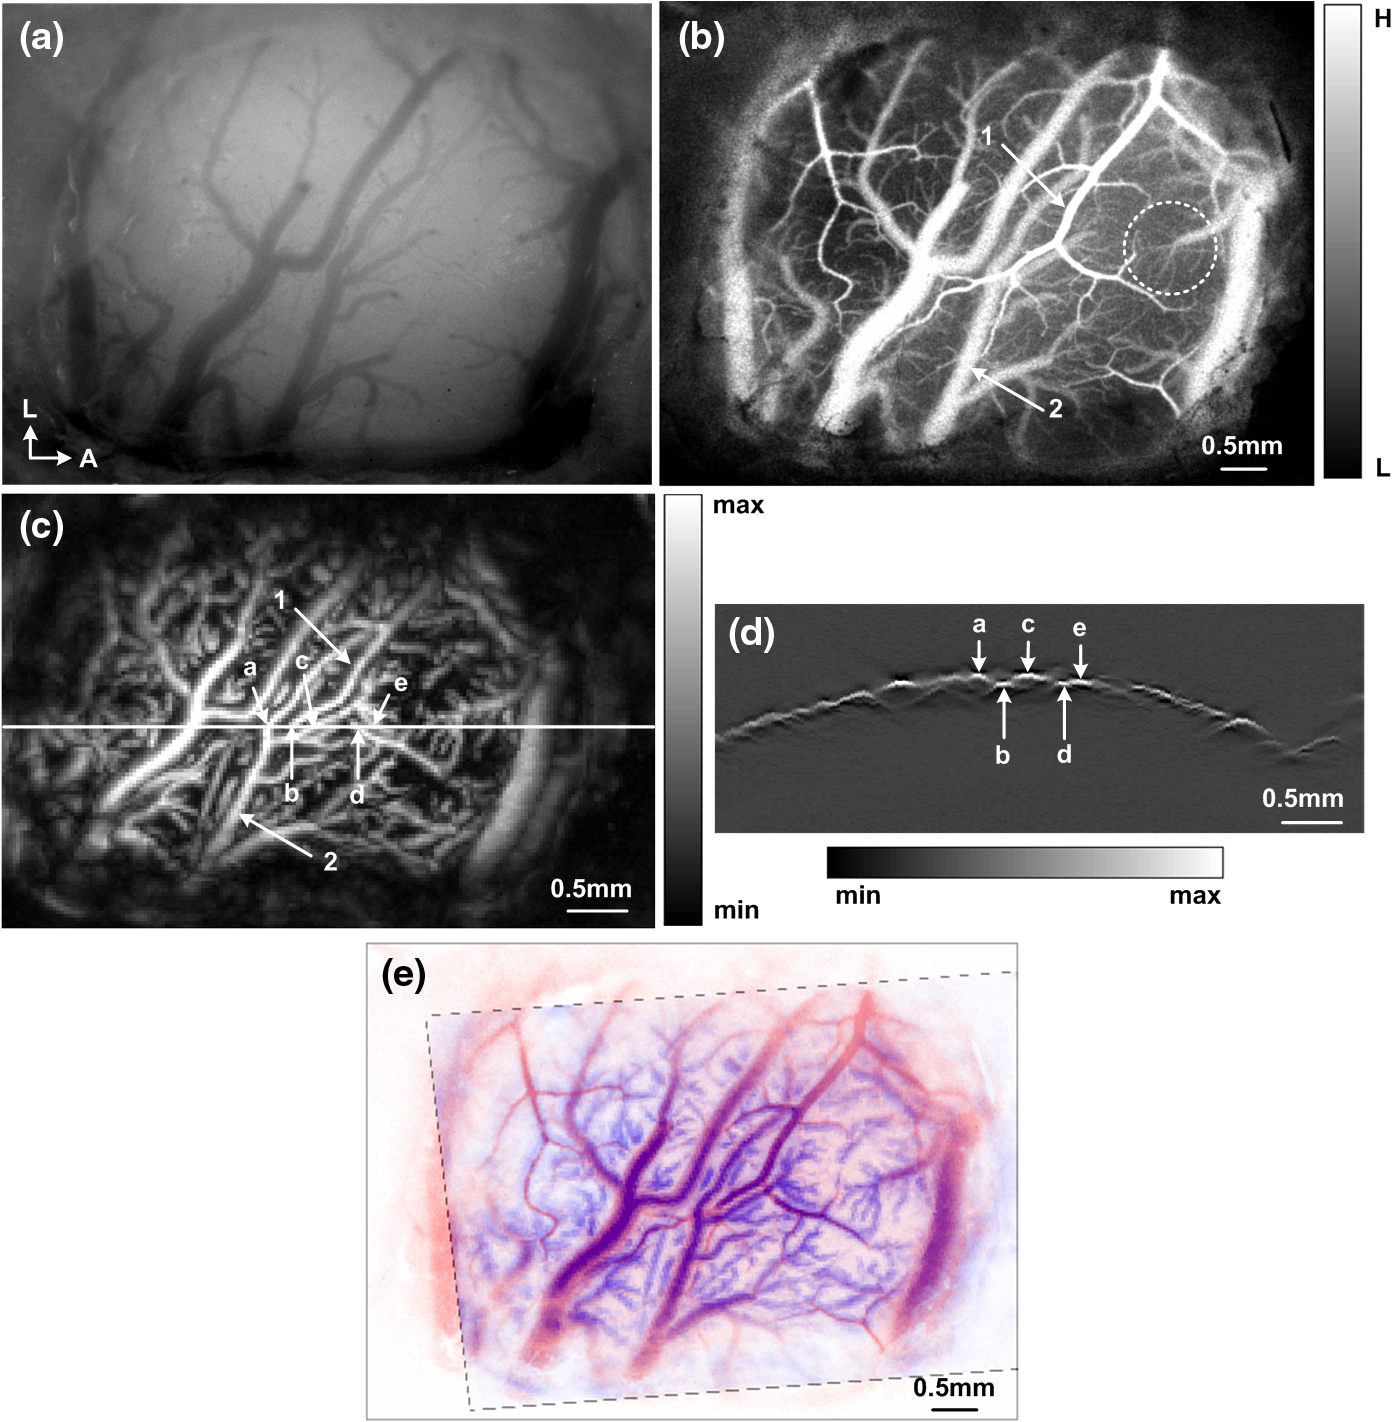 Comparing Fig. 2(b) with Fig. 2(c), there is a lack of depth information in the LSI image, while partial depth information of the cortex vasculature can be identified from the 2D PAM image. For example, we may make a mistake of considering that the artery with the label of “1” is located above the vein with the label of “2” in LSI image, but in fact, the artery goes through beneath the vein in PAM image. The depth locations of the vessels could be well identified in photoacoustic section image in Fig. 2(d), which is a b-scan image at the location indicated by the solid line in Fig. 2(c). As shown in Fig. 2(d), the blood vessels with the label of “a,” “c,” and “e” are the branches of the vein labeled with “2,” and the vessels with the label of “b” and “d” are the branches of the artery labeled with “1,” it can be clearly seen that the vein is above the artery at the location imaged. As shown in Fig. 2(e), the PAM image of the cortex vasculature after image registration using the LSI image as the reference is superimposed on the LSI image. From Fig. 2(e), the following are indicated: Firstly, images of the cerebral cortex vasculature using the two imaging techniques agree well. Secondly, fPAM and LSI complementarily provide complete 2D structural information about cortex vasculature, the superimposed image exhibits more structural information than the single image modality. Especially at the locations where the vessels seems to be superposed in the 2D images, such as the “superpositions” of the artery “1” and the vein “2,” the depth locations are clearly described. 3.2.Dynamic Monitoring of CBF, and HbT in Rat Transient Cerebral HypoperfusionThe exemplar blood vessels selected in LSI and PAM image of a rat brain cortex for monitoring of the functional parameters in transient cerebral hypoperfusion are shown in Fig. 3. The LSI image of the cortex is shown in Fig. 3(a), the 2D PAM image of the corresponding region indicated by dashed rectangle in Fig. 3(a) is shown in Fig. 3(b). The continuous photoacoustic b-scan imaging was performed at the location indicated by a dotted line in Fig. 3(b), the corresponding section image was shown in Fig. 3(c). The venous blood vessels with the label of “V1,” “V2,” and “V3” in Fig. 3(b) were selected for continuous dual wavelength fPAM according to the method mentioned above, in order to monitor the changes of and HbT in these vessels before and after UCCA ligation. The change of CBF was calculated from these blood vessels in the corresponding LSI image. It is worth noting that we conduct image registration of PAM and LSI before the calculation. The section images of the selected vessels labeled in Fig. 3(b) are shown in Fig. 3(c) with the same labels. Here, the different depth locations of the vessels are clearly described, and several deeper blood vessels labeled with dotted arrow are also shown in Fig. 3(c), while they could not be found in LSI image. Moreover, these deeper blood vessels are also almost invisible in 2D PAM, also suggesting that the section imaging in depth direction is very essential. Fig. 3The exemplar blood vessels selected in LSI and PAM image of a rat brain cortex for dynamic imaging monitoring. (a) LSI image of the brain cortex, (b) 2D PAM image of the corresponding region in cortex indicated by dashed rectangle in (a), and (c) b-scan PAM image at the location indicated by dotted line in (b). The blood vessels with the label of “V1,” “V2,” and “V3” are the selected vessels for functional monitoring.  Figure 4 presents the dynamic changes of CBF, HbT, and in micro veins in ipsilateral cortex after UCCA ligation from ten rats. The parameters of each rat after ligation were normalized by their baseline values. As shown in Fig. 4(a), the rapid changes of all the parameters occurred in about 30 s after UCCA ligation, which were indicated by a rectangle, and the expanded profiles were shown in Fig. 4(b). As shown in Fig. 4(b), CBF decreased abruptly to () of base level in 6 s after ligation, then recovered rapidly to in the next 30 s; dropped to () of base level in 6 s after ligation, then fluctuated around this level in the next 30 s; HbT also presented a little decrease to () of base level in 6 s after ligation, then recovered slowly. From Fig. 4(a), we can see that the parameters all came back over time after a transient decrease. CBF went up slowly after a rapid recovery to of baseline; an apparent recovery tendency in was found at about 40 s after the decrease; HbT slowly recovered to of baseline in about 60 s after the decline, and then fluctuated to baseline level. In short, right after UCCA ligation, CBF decreased very much, decreased less and HbT decreased the least. Furthermore, the responses to UCCA occlusion in the parameters were different: there was an immediate recovery after an abrupt drop in CBF right after the occlusion; while there was a period of fluctuation after decrease in after the occlusion; HbT presented a little decrease right after UCCA ligation and an immediate increase with small magnitude after the occlusion. In summary, the recovery of was lagged behind the recovery of CBF after decrease, and the temporal profile of HbT was similar to that of CBF, except that the magnitude of decrease of CBF was greater than that of HbT. Fig. 4Dynamic monitoring of CBF, , and HbT in rat brain transient hypoperfusion. (a) Average time courses of the three parameters before and after UCCA occlusion, and (b) the expand profiles indicated by rectangle in (a). “0” is the ligation time point.  The time profiles in Fig. 4 represent hemodynamic responses and changes in blood oxygenation level in ipsilateral cerebral cortex induced by UCCA occlusion in rats. As seen in Fig. 4, the changes of CBF were much greater than the others. The abrupt decrease and rapid recovery made it a transient hypoperfusion status in the brain cortex. Figure 5 shows an exemplar response of CBF in a rat before and after the UCCA ligation. The time serial velocity images reflect the temporal and spatial cerebral cortex blood velocity responses to transient cerebral hypoperfusion. As shown in Fig. 5, the blood velocity in the ipsilateral partial cerebral cortex decreased to the minimum level at 6 to 8 s after ligation, then recovered to a relative high level in several seconds. 4.DiscussionThe results shown in Figs. 2 and 3 illuminate that LSI and fPAM both have the ability to image the cerebral cortex blood vessels with high spatial resolution, and each has advantages over the other one, so they could complement each other for high quality cortex vasculature image. LSI has the capacity to distinguish fine artery branches, while fPAM provides depth section images of blood vessels with high and homogenous contrast. Therefore, the completed structural information of cortex blood vessels, including the fine branches of the vessels, recognition of artery and vein and the 3-D spatial locations of the vessels, could be obtained by combining the two image techniques. Due to the high spatial resolution, a single micro blood vessel can be located precisely, and the minor structural anomalies indicating the early pathological changes of brain tissue could be discovered. From Fig. 4, we can conclude that the complete information about hemodynamic responses and oxygen metabolism changes of the cerebral cortex induced by transient cerebral hypoperfusion could be obtained by using the two techniques with high temporal resolution. Some groups have reported a decrease of CBF in ipsilateral cortex after UCCA ligation in rats. For example, Busch et al. have found that CBF in ipsilateral cortex decreased to 55% of base level after UCCA ligation in rat using LDF.13 Livnat et al. have also found a falling of CBF in ipsilateral cortex to about 72% of base level after UCCA ligation in rats by LDF.14 Our data reveal that CBF decrease to 37% of base level at 6 s after the ligation and rapidly restore to 71% in 30 s. It is worth noting that the earlier changes of CBF are detected in our system compared to the results mentioned above. Comparing their results at different time points with ours, the data are generally agree, except that the magnitude of decrease in our observation is slightly greater. The reason for this discrepancy may be that we are looking at single micro venous vessels with higher resolution, while LDF measures average CBF in small regions of the cortex. A study using near infrared spectroscopy (NIRS) by Wiernsperger et al. shows a reduction in blood volume and also a decrease in hemoglobin saturation in rat ipsilateral cortex after UCCA ligation.16 Another study using DOT by Bluestone et al. suggests that the cerebral HbT (or blood volume) and hemoglobin oxygenation both decrease immediately after UCCA occlusion in rats, and then recover to the base level over time.17 There are some differences between their results. For instance, in Wiernsperger’s study, no recovery procedure in blood volume and hemoglobin saturation was observed in 5 min after clamping UCCA, while Bluestone discovered apparent recovery in these parameters in 60 s after UCCA occlusion. In addition, the decrease in blood volume is greater than the one in hemoglobin saturation in Wiernsperger’s study, while it is opposite in Bluestone’s study. The possible reasons for these discrepancies may be technique diversity and the different detection regions in the cerebral cortex. Our results agree with Bluestone’s study on the issues mentioned above, moreover, we have found that the recovery in hemoglobin saturation delays to the one in blood volume after the occlusion, it is the same phenomenon observed in Bluestone’s study. In addition, the decrease in HbT and hemoglobin oxygenation in our study is a little bigger than the ones in the previous reports mentioned above. The reasons may be as follows. Firstly, fPAM has the ability to locate a single cerebral micro blood vessel with high spatial resolution instead of a region of several millimeters in NIRS or DOT. Furthermore, we focus on the observation of micro veins instead of the average of the arteries and the veins. Secondly, since photoacoustic imaging is based on high optical absorption contrast between blood vessels and surrounding tissues, it has high sensitivity and specificity in detection of blood vessels.28,29,42 Finally, we monitor the change in blood, which describes the blood oxygenation levels directly compared with the monitoring of , , or in blood. Here, is defined as , and represents change in optical density from the initial baseline. Where, and are the original light signal intensity and the intensity resulting from surgical manipulations, respectively.16 The time courses of the parameters in Fig. 4 also shows the relations between the changes in CBF, , and HbT, which illustrate the associated information between hemodynamic response and oxygen metabolism occurred in transient cerebral hypoperfusion in rats. The results show that: First, with a great reduction in CBF, there is a relatively small decline in HbT and a moderate decrease in . It is similar to the previous report in acute focal cerebral ischemia in mice by Jones.18 Second, the response velocity and the variation trend in CBF are similar to the ones in HbT after UCCA occlusion, a similar relation has been found in Jones’s study.18 Third, the response in delays to the one in HbT after the occlusion, especially in the recovery phase, this is in accordance with the result in Bluestone’s study in rats.17 With a dramatic reduction in CBF, HbT decreases relatively little in the initial 6 s after UCCA occlusion, suggesting either no alteration in cerebral vascular caliber or slight vasoconstriction occurred in the initial several seconds after occlusion.18,43 Because of a large reduction in CBF, blood spends more time passing through the capillary bed and is deoxygenated, which results in a reduction of in the veins. Simultaneously, because of an abrupt reduction in blood oxygen supply, the brain tissue is in a hypoxia status, so the quick cerebral hemodynamic responses occur subsequently.44,45 Due to autoregulation mechanism, such as vasodilatation and establishment of collateral circulation, etc., CBF restores fast as a result. The blood oxygen supply restores with the rapid restoration of CBF to alleviate brain tissue anoxia, not until CBF restores to a relatively high level does venous present an apparent recovery. Therefore, the recovery in venous is later than the one in CBF after occlusion. In addition, HbT in veins has little decline in the period of transient cerebral hypoperfusion, which agrees with the previous study.17 The reasons may be cerebrovascular reserve capacity and establishment of collateral circulation, etc. On the whole, the change pattern of these parameters and their correlation information represent the characteristics about hemodynamic response and oxygen metabolism change of transient cerebral hypoperfusion. Identifying early abnormal changes in the cerebrovasular diseases correlated with hypoperfusion is of great significance. The time serial LSI images in Fig. 5 display the spatio-temporal cerebral cortex blood velocity responses to transient cerebral hypoperfusion in a rat. The blood velocity decreased to the minimum at 6 to 8 s after occlusion, due to the fast collateral circulation rebuilding or other autoregulation effects, it restored to a relatively high level rapidly. The collateral blood mainly derives from the circle of Willis: the anterior cerebral artery in frontal part of the Willis circle, and the posterior cerebral artery and the posterior communicating artery in the posterior part of Willis circle.46–48 The results manifest the rapid hemodynamic responses of ipsilateral cortex to UCCA occlusion in rats. The current data acquisition time for a 0.9 mm wide single wavelength PAM B-scan image with a scan step of 30 μm is about 1 s, and a dual wavelength fPAM image of the same size needs 6 s, including the time for wavelength changing of the dye laser and the time for scanning. That is, the time resolution for our current fPAM monitoring is 6 s. If we improve the repeat frequency of the laser from 30 Hz to 1 KHz, the same size of B-scan image will take about several tens milliseconds,49 but the improvement of time resolution of multiple wavelength fPAM is still subjected to the time assumption for tuning laser wavelength. Besides high time resolution, high spatial resolution and the capacity of 3D image make our method especially preponderant in early detection of cerebral hypoperfusion. Other potential applications in cerebrovascular diseases are immeasurable, such as intraoperative monitoring and post-treatment therapeutic efficacy evaluation in brain vascular malformations or brain aneurysm,50 guidance for precise excision of the micro infarct tissues in brain ischemia, etc.51 Although all the measurements are from the cerebral cortex, many studies manifest that there are significant changes in blood velocity and oxygen metabolism in cerebral cortex induced by cerebral hypoperfusion.7,12,52,53 The experimental results demonstrate that the early complete detection of the cerebral hypoperfusion could be realized by using LSI and fPAM, and it is a promising method to distinguish the potential patients who are suffering from brain diseases related to hypoperfusion or ischemia. Thus, damage caused by brain hypoperfusion would be prevented if the timely treatments are conducted. Nevertheless, because of the setup difference between LSI and fPAM, the multiple physiological information about the brain cortex can’t yet be fused into one image for simple and precise detection. We will improve our systems and integrate the two imaging techniques together to realize automatic spatial-temporal registration and multiple information fusion in the future. 5.ConclusionWe have successfully performed a multi-parameter and 3-D image monitoring of transient cerebral hypoperfusion in rats with high spatio-temporal resolution using fPAM and LSI. Combined, the two image techniques allows for complete monitoring of information about hemodynamic responses and oxygen metabolism changes in the cerebral cortex. It has been verified that the method has the ability to detect cerebral hypoperfusion in the early stages by using transient cerebral hypoperfusion models in rats through UCCA occlusion. Therefore, the prevention of damage to brain tissue and brain dysfunction caused by hypoperfusion would be possible using the method, and prevention of ischemia stroke, AD, and VD would also be possible in a certain degree. As a complement to the existing imaging strategy, it holds the potential to serve as a favorable method for studying cerebrovascular diseases related to hypoperfusion in animal models and early detection of cerebral hypoperfusion clinically. AcknowledgmentsThis work was supported by the Science Fund for Creative Research Group (Grant No. 61121004), Specific International Scientific Cooperation (Grant No. 2010DFR30820), and the National Science Foundation of China (Grant No. 61078072). ReferencesM. Shibataet al.,
“Selective impairment of working memory in a mouse model of chronic cerebral hypoperfusion,”
Stroke, 38
(10), 2826
–2832
(2007). http://dx.doi.org/10.1161/STROKEAHA.107.490151 SJCCA7 0039-2499 Google Scholar
J. Kawamuraet al.,
“Leukoaraiosis correlates with cerebral hypoperfusion in vascular dementia,”
Stroke, 22
(5), 609
–614
(1991). http://dx.doi.org/10.1161/01.STR.22.5.609 SJCCA7 0039-2499 Google Scholar
C. Sartiet al.,
“Persistent impairment of gait performances and working memory after bilateral common carotid artery occlusion in the adult Wistar rat,”
Behav. Brain Res., 136
(1), 13
–20
(2002). http://dx.doi.org/10.1016/S0166-4328(02)00090-6 BBREDI 0166-4328 Google Scholar
M. Shibataet al.,
“White matter lesions and glial activation in a novel mouse model of chronic cerebral hypoperfusion,”
Stroke, 35
(11), 2598
–2603
(2004). http://dx.doi.org/10.1161/01.STR.0000143725.19053.60 SJCCA7 0039-2499 Google Scholar
J. E. Kimet al.,
“Cognitive dysfunction in 16 patients with carotid stenosis: detailed neuropsychological findings,”
J. Clin. Neurol., 3
(1), 9
–17
(2007). http://dx.doi.org/10.3988/jcn.2007.3.1.9 1004-1648 Google Scholar
D. Lavinskyet al.,
“Chronic bilateral common carotid artery occlusion: a model for ocular ischemic syndrome in the rat,”
Graefes Arch. Clin. Exp. Ophthalmol., 244
(2), 199
–204
(2006). http://dx.doi.org/10.1007/s00417-005-0006-7 GACODL 0721-832X Google Scholar
O. C. Suteret al.,
“Cerebral hypoperfusion generates cortical watershed microinfarcts in Alzheimer disease,”
Stroke, 33
(8), 1986
–1992
(2002). http://dx.doi.org/10.1161/01.STR.0000024523.82311.77 SJCCA7 0039-2499 Google Scholar
L. R. Caplanet al.,
“Is hypoperfusion an important cause of strokes? If so, how?,”
Cerebrovasc. Dis., 21
(3), 145
–153
(2006). http://dx.doi.org/10.1159/000090791 CERDDD 0146-6917 Google Scholar
A. Ruitenberget al.,
“Cerebral hypoperfusion and clinical onset of dementia: the Rotterdam study,”
Ann. Neurol., 57
(6), 789
–794
(2005). http://dx.doi.org/10.1002/(ISSN)1531-8249 ANNED3 0364-5134 Google Scholar
E. FarkasP. G. M. LuitenF. Bari,
“Permanent, bilateral common carotid artery occlusion in the rat: a model for chronic cerebral hypoperfusion-related neurodegenerative diseases,”
Brain Res. Rev., 54
(1), 162
–180
(2007). http://dx.doi.org/10.1016/j.brainresrev.2007.01.003 BRERD2 0165-0173 Google Scholar
G. D. LeyJ. B. NshimyumuremyiI. Leusen,
“Hemispheric blood flow in the rat after unilateral common carotid occlusion: evolution with time,”
Stroke, 16
(1), 69
–73
(1985). http://dx.doi.org/10.1161/01.STR.16.1.69 SJCCA7 0039-2499 Google Scholar
T. Otoriet al.,
“Long-term measurement of cerebral blood flow and metabolism in a rat chronic hypoperfusion model,”
Clin. Exp. Pharmacol. Physiol., 30
(4), 266
–272
(2003). http://dx.doi.org/10.1046/j.1440-1681.2003.03825.x CEXPB9 0305-1870 Google Scholar
H. J. Buschet al.,
“Arteriogenesis in hypoperfused rat brain,”
J. Cerebr. Blood Flow Metab., 23
(5), 621
–628
(2003). http://dx.doi.org/10.1097/01.WCB.0000057741.00152.E4 JCBMDN 0271-678X Google Scholar
A. LivnatE. Barbiro-MichaelyA. Mayevsaky,
“Mitochondrial function and cerebral blood flow responses under unilateral carotid occlusion in rats,”
Proc. SPIE, 7180 718003
(2009). http://dx.doi.org/10.1117/12.808734 PSISDG 0277-786X Google Scholar
S. Fantiniet al.,
“Non-invasive optical monitoring of the newborn piglet brain using continuous-wave and frequency-domain spectroscopy,”
Phys. Med. Biol., 44
(6), 1543
–1563
(1999). http://dx.doi.org/10.1088/0031-9155/44/6/308 PHMBA7 0031-9155 Google Scholar
N. WiernspergerA. L. SylviaF. F. Jobsis,
“Incomplete transient ischemia: a non-destructive evaluation of in vivo cerebral metabolism and hemodynamics in rat brain,”
Stroke, 12
(6), 864
–868
(1981). http://dx.doi.org/10.1161/01.STR.12.6.864 SJCCA7 0039-2499 Google Scholar
A. Y. Bluestoneet al.,
“Three-dimensional optical tomographic brain imaging in small animals, part 2: unilateral carotid occlusion,”
J. Biomed. Opt., 9
(5), 1063
–1073
(2004). http://dx.doi.org/10.1117/1.1784472 JBOPFO 1083-3668 Google Scholar
P. B. Joneset al.,
“Simultaneous multispectral reflectance imaging and laser speckle flowmetry of cerebral blood flow and oxygen metabolism in focal cerebral ischemia,”
J. Biomed. Opt., 13
(4), 044007
(2008). http://dx.doi.org/10.1117/1.2950312 JBOPFO 1083-3668 Google Scholar
J. SmithS. BrickerB. Putnam,
“Tissue oxygen saturation predicts the need for early blood transfusion in trauma patients,”
Am. Surgeon, 74
(10), 1006
–1011
(2008). Google Scholar
P. C. Liet al.,
“Imaging cerebral blood flow through the intact rat skull with temporal laser speckle imaging,”
Opt. Lett., 31
(12), 1824
–1826
(2006). http://dx.doi.org/10.1364/OL.31.001824 OPLEDP 0146-9592 Google Scholar
H. Y. Chenget al.,
“Modified laser speckle imaging method with improved spatial resolution,”
J. Biomed. Opt., 8
(3), 559
–564
(2003). http://dx.doi.org/10.1117/1.1578089 JBOPFO 1083-3668 Google Scholar
A. K. Dunnet al.,
“Dynamic imaging of cerebral blood flow using laser speckle,”
J. Cerebr. Blood Flow Metab., 21
(3), 195
–201
(2001). http://dx.doi.org/10.1097/00004647-200103000-00002 JCBMDN 0271-678X Google Scholar
C. Ayataet al.,
“Laser speckle flowmetry for the study of cerebrovascular physiology in normal and ischemic mouse cortex,”
J. Cerebr. Blood Flow Metab., 24
(7), 744
–755
(2004). http://dx.doi.org/10.1097/01.WCB.0000122745.72175.D5 JCBMDN 0271-678X Google Scholar
W. H. Luoet al.,
“A modified mini-stroke model with region-directed reperfusion in rat cortex,”
J. Cerebr. Blood Flow Metab., 28
(5), 973
–983
(2008). http://dx.doi.org/10.1038/sj.jcbfm.9600591 JCBMDN 0271-678X Google Scholar
A. K. Dunnet al.,
“Spatial extent of oxygen metabolism and hemodynamic changes during functional activation of the rat somatosensory cortex,”
Neuroimage, 27
(2), 279
–290
(2005). http://dx.doi.org/10.1016/j.neuroimage.2005.04.024 NEIMEF 1053-8119 Google Scholar
P. Miaoet al.,
“Detecting cerebral arteries and veins: from large to small,”
J. Innov. Opt. Health Sci., 3
(1), 61
–67
(2010). Google Scholar
W. H. Luoet al.,
“Tracing collateral circulation after ischemia in rat cortex by laser speckle imaging,”
J. Innov. Opt. Health Sci., 1
(2), 217
–226
(2008). Google Scholar
H. F. Zhanget al.,
“Functional photoacoustic microscopy for high-resolution and noninvasive in vivo imaging,”
Nat. Biotechnol., 24
(7), 848
–851
(2006). http://dx.doi.org/10.1038/nbt1220 NABIF9 1087-0156 Google Scholar
X. Q. Yanget al.,
“High-resolution photoacoustic microscope for rat brain imaging in vivo,”
Chin. Opt. Lett., 8
(6), 609
–611
(2010). http://dx.doi.org/10.3788/COL COLHBT 1671-7694 Google Scholar
L. D. Liaoet al.,
“Imaging brain hemodynamic changes during rat forepaw electrical stimulation using functional photoacoustic microscopy,”
Neuroimage, 52
(2), 562
–570
(2010). http://dx.doi.org/10.1016/j.neuroimage.2010.03.065 NEIMEF 1053-8119 Google Scholar
S. HuK. MaslovL. V. Wang,
“Optical-resolution photoacoustic microscopy for in vivo volumetric microvascular imaging in intact tissues,”
Handbook of Photonics for Biomedical Science, 361
–375 CRC Press, Taylor & Francis Group, London
(2010). Google Scholar
V. P. Zharovet al.,
“Photoacoustic flow cytometry: principle and application for real-time detection of circulating single nanoparticles, pathogens, and contrast dyes in vivo,”
J. Biomed. Opt., 12
(5), 051503
(2007). http://dx.doi.org/10.1117/1.2793746 JBOPFO 1083-3668 Google Scholar
E. I. Galanzhaet al.,
“In vivo multispectral, multiparameter, photoacoustic lymph flow cytometry with natural cell focusing, label-free detection and multicolor nanoparticle probes,”
Cytometry A, 73
(10), 884
–894
(2008). http://dx.doi.org/10.1002/cyto.a.v73a:10 1552-4922 Google Scholar
H. F. Zhanget al.,
“Imaging of hemoglobin oxygen saturation variations in single vessels in vivo using photoacoustic microscopy,”
Appl. Phys. Lett., 90
(5), 053901
(2007). http://dx.doi.org/10.1063/1.2435697 APPLAB 0003-6951 Google Scholar
E. W. SteinK. MaslovL. H. V. Wang,
“Noninvasive, in vivo imaging of blood-oxygenation dynamics within the mouse brain using photoacoustic microscopy,”
J. Biomed. Opt., 14
(2), 020502
(2009). http://dx.doi.org/10.1117/1.3095799 JBOPFO 1083-3668 Google Scholar
I. Y. Petrovaet al.,
“Optoacoustic monitoring of blood hemoglobin concentration: a pilot clinical study,”
Opt. Lett., 30
(13), 1677
–1679
(2005). http://dx.doi.org/10.1364/OL.30.001677 OPLEDP 0146-9592 Google Scholar
Y. Y. Petrovet al.,
“Multiwavelength optoacoustic system for noninvasive monitoring of cerebral venous oxygenation: a pilot clinical test in the internal jugular vein,”
Opt. Lett., 31
(12), 1827
–1829
(2006). http://dx.doi.org/10.1364/OL.31.001827 OPLEDP 0146-9592 Google Scholar
J. J. Qiuet al.,
“Spatiotemporal laser speckle contrast analysis for blood flow imaging with maximized speckle contrast,”
J. Biomed. Opt., 15
(1), 016003
(2010). http://dx.doi.org/10.1117/1.3290804 JBOPFO 1083-3668 Google Scholar
L. H. V. Wang,
“Multiscale photoacoustic microscopy and computed tomography,”
Nat. Photon., 3
(9), 503
–509
(2009). http://dx.doi.org/10.1038/nphoton.2009.157 1749-4885 Google Scholar
H. Y. ChengY. M. YanT. Q. Duong,
“Temporal statistical analysis of laser speckle images and its application to retinal blood-flow imaging,”
Opt. Exp., 16
(14), 10214
–10219
(2008). http://dx.doi.org/10.1364/OE.16.010214 OPEXFF 1094-4087 Google Scholar
S. S. LiuP. C. LiQ. M. Luo,
“Fast blood flow visualization of high-resolution laser speckle imaging data using graphics processing unit,”
Opt. Exp., 16
(19), 14321
–14329
(2008). http://dx.doi.org/10.1364/OE.16.014321 OPEXFF 1094-4087 Google Scholar
S. A. Ermilovet al.,
“Laser optoacoustic imaging system for detection of breast cancer,”
J. Biomed. Opt., 14
(2), 024007
(2009). http://dx.doi.org/10.1117/1.3086616 JBOPFO 1083-3668 Google Scholar
E. FarkasF. BariT. P. Obrenovitch,
“Multi-modal imaging of anoxic depolarization and hemodynamic changes induced by cardiac arrest in the rat cerebral cortex,”
Neuroimage, 51
(2), 734
–742
(2010). http://dx.doi.org/10.1016/j.neuroimage.2010.02.055 NEIMEF 1053-8119 Google Scholar
S. HuK. MaslovL. H. V. Wang,
“Noninvasive label-free imaging of microhemodynamics by optical-resolution photoacoustic microscopy,”
Opt. Exp., 17
(9), 7688
–7693
(2009). http://dx.doi.org/10.1364/OE.17.007688 OPEXFF 1094-4087 Google Scholar
C. AalkjaerH. Nilsson,
“Vasomotion: cellular background for the oscillator and for the synchronization of smooth muscle cells,”
Br. J. Pharmacol., 144
(5), 605
–616
(2005). http://dx.doi.org/10.1038/sj.bjp.0706084 BJPCBM 1476-5381 Google Scholar
D. S. Liebeskind,
“Collateral circulation,”
Stroke, 34
(9), 2279
–2284
(2003). http://dx.doi.org/10.1161/01.STR.0000086465.41263.06 SJCCA7 0039-2499 Google Scholar
D. S. LiebeskindL. H. Sansing,
“Willisian collateralization,”
Neurology, 63
(2), 344
(2004). NEURAI 0028-3878 Google Scholar
E. FarkasP. G. M. Luiten,
“Cerebral microvascular pathology in aging and Alzheimer's disease,”
Prog. Neurobiol., 64
(6), 575
–611
(2001). http://dx.doi.org/10.1016/S0301-0082(00)00068-X PGNBA5 0301-0082 Google Scholar
C. P. Favazzaet al.,
“In vivo photoacoustic microscopy of human cutaneous microvasculature and a nevus,”
J. Biomed. Opt., 16
(1), 016015
(2011). http://dx.doi.org/10.1117/1.3528661 JBOPFO 1083-3668 Google Scholar
A. Raabeet al.,
“Laser Doppler imaging for intraoperative human brain mapping,”
Neuroimage, 44
(4), 1284
–1289
(2009). http://dx.doi.org/10.1016/j.neuroimage.2008.10.049 NEIMEF 1053-8119 Google Scholar
N. S. Litofskyet al.,
“The use of lobectomy in the management of severe closed-head trauma,”
Neurosurgery, 34
(4), 628
–633
(1994). NEQUEB Google Scholar
H. Yaoet al.,
“Cerebral blood flow and oxygen metabolism in patients with vascular dementia of the Binswanger type,”
Stroke, 21
(12), 1694
–1699
(1990). http://dx.doi.org/10.1161/01.STR.21.12.1694 SJCCA7 0039-2499 Google Scholar
S. Taket al.,
“Quantitative analysis of hemodynamic and metabolic changes in subcortical vascular dementia using simultaneous near-infrared spectroscopy and fMRI measurements,”
Neuroimage, 55
(1), 176
–184
(2011). http://dx.doi.org/10.1016/j.neuroimage.2010.11.046 NEIMEF 1053-8119 Google Scholar
|