|
|
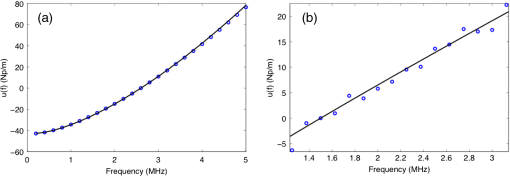
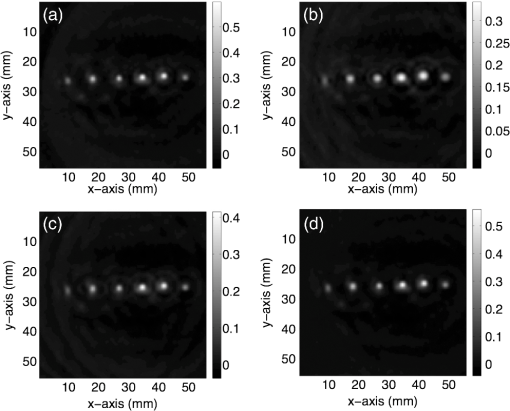
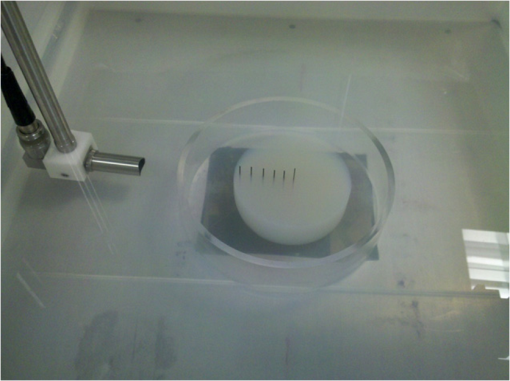
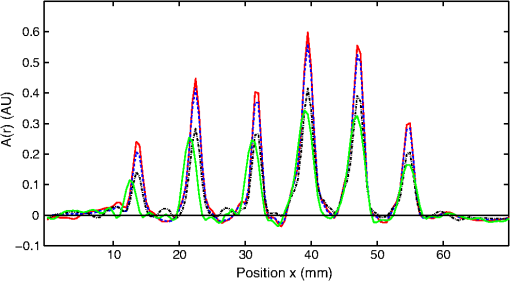
1.IntroductionPhotoacoustic computed tomography (PCT) is a rapidly emerging biophotonic imaging modality that combines optical image contrast with ultrasound detection.1–4 In PCT, the object is illuminated with a pulsed optical wavefield, resulting in the generation of acoustic wavefields via the thermoacoustic effect. From measurements of the acoustic wavefields, a tomographic reconstruction algorithm is employed to obtain an image that depicts the spatially variant absorbed optical energy density distribution within the object. Because the optical absorption properties of tissue are highly related to its molecular constitution, biomedical applications of PCT can reveal the pathological condition of the tissue5,6 and therefore facilitate a wide-range of diagnostic tasks.2,7–11 The thermoacoustically induced pressure signals measured in PCT are broadband and acoustic attenuation is frequency-dependent. It has been demonstrated12 that the fidelity of reconstructed images can degrade if acoustic attenuation is not compensated for in the PCT reconstruction algorithm. However, relatively few tomographic reconstruction algorithms are available for such compensation for acoustic attenuation.12–17 Moreover, all of the previously investigated methods have assumed that the acoustic attenuation properties of the object are homogeneous. An important biomedical application in which that assumption will be grossly violated is transcranial PCT,18 in which the models of acoustic attenuation in soft-tissue and skull bone have distinct forms. In this work, we report an investigation of PCT reconstruction of optical absorbers embedded in a heterogeneous, lossy medium. A time-reversal-based reconstruction algorithm proposed by Treeby et al.,14 which was previously demonstrated for media possessing homogeneous acoustic absorption properties, is modified for acoustically heterogeneous and lossy acoustic media obeying a power law attenuation model. As described below, in general the attenuation coefficient component of the power law is permitted to be spatially variant, while the power law exponent is required to be constant. When the object contains materials, such as bone and soft-tissue, that are modeled using power law attenuation models with distinct exponents, we demonstrate that the effects of acoustic attenuation due to the most strongly attenuating material (e.g., bone) can be compensated for if the attenuation due to the other less attenuating material(s) (e.g., soft-tissue) is neglected. Experiments with phantom objects are conducted to corroborate our findings. 2.Time Reversal with Heterogeneous AbsorptionLet denote the thermoacoustically induced pressure wavefield at location and time . Upon propagating out of the object, the pressure wavefields are temporally sampled by use of point-like ultrasonic transducers located at a collection of positions on a closed measurement aperture that surrounds the object. We assume that the effect of the transducer’s electrical impulse response on the measured data has been appropriately deconvolved.10 The sought after absorbed energy density is related to the induced pressure wavefield at as where is the dimensionless Grueneisen parameter. From knowledge of the measured data , an estimate of , or equivalently, , can be obtained by use of a tomographic reconstruction algorithm.The measured data contain the effects of acoustic attenuation, which is experienced by the pressure wavefield upon propagating to the ultrasonic transducer locations. For a wide variety of materials, including biological tissues, the acoustic attenuation coefficient can be described by a frequency power law of the form19 where is the temporal frequency in MHz, is the frequency-independent attenuation coefficient in , and is the power law exponent that is typically in the range of 0 to 3.0.20To compensate for acoustic attenuation corresponding to a power law model, Treeby et al.14 proposed a method based on time-reversal image reconstruction principles for a lossy acoustic medium. The reconstruction method operates by iteratively solving the following three coupled acoustic equations backward in time: subject to the initial and boundary conditions: Here, is the acoustic particle velocity, is the speed of sound (SOS), and are the acoustic and ambient density, respectively, denotes the pressure data measured at transducer location , and denotes the maximum time at which the were recorded. The quantities and describe the acoustic absorption and dispersion proportionality coefficients that are defined asAcoustic attenuation is modeled by the absorbing equation of state in Eq. (5), which employes two lossy derivative operators based on the fractional Laplacian to separately accounts for the acoustic absorption and dispersion that are consistent with Eq. (2). Attenuation compensation is achieved by reversing the absorption proportionality coefficient in sign but leaving the equivalent dispersion parameter unchanged during the time-reversal reconstruction. As described in Ref. 14, the solution of these equations yields an image that depicts in which the effects of acoustic attenuation have been compensated for. Image reconstruction based on Eqs. (3)(4)–(5) can be accomplished by use of the -space pseudospectral method.21 Compared with other numerical methods, like the finite-difference time-domain method, -space pseudospectral methods can significantly improve the computational efficiency by employing the fast Fourier transform (FFT) algorithm to compute the spatial derivatives. The accuracy of the temporal derivatives can also be improved by using k-space adjustments.14 However, to date, this method has only been investigated for reconstructing objects that possess homogeneous acoustic attenuation parameters, i.e. objects whose acoustic attenuation is described by a fixed power law with a constant attenuation coefficient and power law exponent . We modified the original implementation of the k-space model21 for use with heterogeneous lossy media. Specifically, two modifications were implemented: (1) The k-space adjustment parameter in Eq. (15) in Ref. 14 was removed. This parameter is not required because the equation of state [Eq. (5)] does not involve temporal derivatives, and -space adjustment is only used to improve the stability and accuracy of the computation of temporal derivatives in the -space method; and (2) The implementation was modified to permit in Eq. (7) to be a spatially varying quantity . Note that although can be spatially variant, the power law exponent is required to be a constant in the -space time-reversal method. When the object is composed of soft tissues, the assumption of a constant power law exponent is justified. However, when the object contains regions corresponding to distinct power law exponents, which occurs, for example, in the presence of both bone and soft-tissue, the reconstruction method must be modified to avoid image blurring and distortions due to use of a fixed power law exponent. When acoustic attenuation due to a single power law exponent is dominant, e.g., the skull attenuation in transcranial PCT, we propose a simple strategy for circumventing this problem. Namely, the acoustic attenuation effects due to the most strongly attenuating component (e.g., bone) can be compensated for by use of the correct power law parameters, while the less important attenuation effects due to the other component(s) are neglected. Let denote the region of support of the most strongly attenuating object component and let and denote the quantities that specify the power law in Eq. (2) for this component. If one specifies and for and otherwise, the k-space time-reversal reconstruction method described above will compensate for acoustic attenuation resulting from the most strongly attenuating component. 3.Computer SimulationsTo corroborate the correctness of the modified wave solver code for use with acoustically heterogeneous, lossy media, a computer-simulation study was conducted. The modified wave solver was employed to simulate the propagation of a monopolar pulsed acoustic plane-wave through a one-dimensional heterogeneous lossy medium. The assumed propagation medium consisted of an acoustically absorbing structure of length that was embedded in an infinite homogeneous lossless medium with a SOS and density corresponding to water at room temperature. The SOS and density of the absorbing structure were and , and its acoustic attenuation was assumed to be described by the power law with and . When solving Eqs. (3)–(5) the k-space wave solver employed a computational grid of dimension (51.2 mm), a time step of 1 ns, and a total simulation time of 40 μs. The pressure wavefield that was propagated through the acoustically inhomogeneous medium was computed as a function of time at the edge of the computational grid. Samples of the magnitude of its one-dimensional Fourier transform were computed by use of the discrete Fourier transform. The pressure wavefield was also computed at the same location for the case when the acoustic heterogeneity was absent, with the corresponding Fourier magnitude spectrum being denoted as . The frequency-dependent attenuation coefficient was estimated from the simulated measurements as:22 where is a reference frequency. The estimated and the corresponding true values given by were plotted together in Fig. 1(a) and found to be nearly identical. The mean square error between the curves was 0.48.Fig. 1A plot of the simulated data function (blue circles) and the expected function (solid line) from 0 to 5 MHz (panel a). This curve corresponds to and . A plot of the experimentally determined data function (blue circles) and the best fit curve (solid line) (panel b). This curve corresponds to and .  4.Experimental ValidationAn experimental PCT study was conducted to demonstrate the use of the modified time-reversal image reconstruction method for use with acoustically heterogeneous, lossy media. A well-characterized phantom, displayed in Fig. 2, represented the to-be-imaged object. The phantom contained 6 optically absorbing structures (pencil leads) embedded in agar. These structures were surrounded by an acrylic cylinder that had inner and outer radii of 7.1 and 7.6 cm, respectively, and a height of 3 cm. The density and SOS of the acrylic were measured and found to be and . The optical absorbers and acrylic cylinder were immersed in water and irradiated by a laser beam from the top. Light from a tunable dye laser (NS, Sirah), pumped by a Q-switched Nd:YAG laser (PRO-350-10, Newport) at 630 nm was used as the illumination source, and the incident laser fluence on the target surface was with a 10 Hz pulse repetition rate. The photoacoustic (PA) signals were detected by use of a single ultrasound transducer that was scanned along a circular trajectory of radius 9.5 cm. The transducer was cylindrically focused and therefore, the reconstruction problem was treated as a two-dimensional (2-D) one. The photoacoustic signals were recorded with 20 MHz sampling rate at 1000 equally spaced locations on the scanning circle and were amplified by a 50-dB amplifier (5072 PR, Panametrics, Waltham, MA). It has been demonstrated that the 2-D time reversal algorithm can yield accurate reconstructed images if the maximum time of signal recording time is sufficiently large.23 Therefore, 20,000 temporal samples were acquired at each recording location to ensure that the magnitudes of the PA signals at the cut-off time were sufficient small (approximately at the noise level). In the image reconstruction procedure we sought to compensate for acoustic attenuation of the PA signals due to the acrylic cylinder, which represented the dominant acoustic absorber in the object. To determine the absorption parameters and of acrylic, a transmission experiment was conducted by use of a modified broadband through-transmission technique proposed by He.22 A flat acrylic specimen of thickness 11 mm was employed, whose composition was identical to the acrylic cylinder. The transmitting and receiving transducers employed were both Panametrics V306, having a central frequency of 2.25 MHz with a bandwidth of 70%. From transmission measurements with and without the acrylic specimen present, the corresponding amplitude spectra and were computed and used to calculate the measured values in Eq. (8). A nonlinear least squares method was used to fit the measured data to the frequency power law. Figure 1(b) displays the measured values (blue circles) and the fitted curve (solid line). The estimated absorption parameters were found to be and . For use in the time-reversal reconstruction code, the 2-D SOS map , density map , and attenuation coefficient were constructed. The maps and were assigned the values for acrylic within the annular region occupied by that material and assigned the values and elsewhere. Similarly, the map was assigned the value within the annular region occupied by the acrylic and was set to zero elsewhere, reflecting that we neglected the relatively weak acoustic attenuation due to the water bath and agar. The power law exponent was set at , as determined above. The measured PA signals were pre-processed by a curvelet denoising technique prior to application of the image reconstruction algorithm. The images were reconstructed on a grid of of dimension 0.5 mm. To mitigate noise amplification in the reconstructed images, the time-reversed pressure signals were subjected to a low-pass filter specified by a tapered cosine window. The filter cutoff frequency corresponded to the frequency at which the value of average power spectrum of PA signals matched the noise level. Two additional images were reconstructed to demonstrate the relative importance of compensating for the SOS and density heterogeneities vs. acoustic attenuation. One image was reconstructed by employing a constant SOS value of and constant density value of in the reconstruction algorithm, but properly compensated for the attenuation in the acrylic cylinder. The second image was reconstructed by properly incorporating the spatially variant SOS and density distributions in the reconstruction algorithm, but ignored acoustic attenuation. The reconstructed images are displayed in Fig. 3. Figure 3(a) displays the reference image corresponding to the case where the acrylic cylinder was absent. Figure 3(b)–3(d) displays images of the phantom when the acrylic cylinder was present: Fig. 3(b) displays the image obtained by assuming the constant SOS and mass density values described above but compensating for the acoustic attenuation due to the acrylic; Fig. 3(c) displays the image reconstructed by properly compensating for the spatially variant SOS and density distributions but neglecting acoustic attenuation; the image in Fig. 3(d) was reconstructed by properly compensating for both the spatially variant SOS and density distributions and acoustic attenuation due to the acrylic cylinder. Fig. 3The reconstructed image depicting the six optical absorbers in four cases: (a) the acrylic shell was absent during imaging (reference image); (b) the acrylic shell was present and the SOS and density heterogeneities were ignored in the reconstruction method but acoustic attenuation was compensated for; (c) the acrylic shell was present and the SOS and density heterogeneities were compensated for in the reconstruction method but the acoustic attenuation was ignored; and (d) the acrylic shell was present and the SOS and density heterogeneities and acoustic attenuation were compensated for in the reconstruction method.  We found that compensation for SOS and density heterogeneities without attenuation compensation [Fig. 3(c)] yields better spatial resolution than compensation for only attenuation [Fig. 3(b)]. Specifically, the average full-width-at-half-maximum (FWHM) of the optical absorbers in Fig. 3(c) was 25% less than the average FWHM in Fig. 3(b). These results confirm that, for the object studied, the SOS and mass density heterogeneities can influence the reconstructed image more strongly than acoustic attenuation.17 However, as expected, Fig. 3(d) reveals that compensation for both SOS and density heterogeneities along with acoustic attenuation yields the image that possesses the best spatial resolution. This is most noticeable for the optical absorber closest to the acrylic cylinder (far left absorber in the reconstructed images). For that structure, the FWHM in the vertical direction was further reduced by 40% over the FWHM corresponding to Fig. 3(c). This can be explained by the fact that the average acoustic path length through the acrylic cylinder for PA waves generated from the optical absorber closest to the cylinder is longer than for PA waves generated from the other optical absorbers. Profiles through the centers of the reconstructed images are displayed in Fig. 4. The profiles denoted by solid red, solid green, dotted black, and dashed blue lines correspond to the images in Fig. 3(a)–3(d), respectively. The averaged peak magnitude of the six optical absorbers in the reconstructed image with compensation of both SOS and density heterogeneities along with acoustic attenuation (dashed blue line) is 92% of that corresponding to the reference image (solid red line). The averaged peak magnitude in the reconstructed image that compensated only for SOS and density heterogeneities and neglected acoustic attenuation (dotted black line) was 64% of the averaged peak magnitude in the reference image (solid red line), while the reconstructed image that only compensated for acoustic attenuation (solid green) was 57% of that corresponding to the reference image. One notes that in the reconstructed image that only compensates for attenuation (solid green), not only is the peak magnitude underestimated, but the peak positions are also shifted as compared to the reference image. These shifts are larger for the optical absorbers closer to the acrylic cylinder. This demonstrates that, even for relatively simple heterogeneous SOS distributions, using a constant effective SOS value in the reconstruction algorithm can result in image distortions. 5.SummaryWe have investigated the use of a time-reversal algorithm for PCT image reconstruction that can compensate for acoustic attenuation in heterogeneous lossy acoustic media. For applications in which acoustic attenuation in a multi-component object is described by frequency power laws having distinct exponents, we demonstrated that the acoustic attenuation due to the most strongly attenuating component can be effectively compensated for. The transmission experiment outlined in this paper to estimate the acoustic attenuation properties of the cylinder is impractical for in-vivo imaging applications. In that case, adjunct imaging data, such as a CT image of the skull24,25 may provide a means of estimating , as well as information about the skull geometry, for use with the time-reversal algorithm. We believe that our findings will facilitate the further development of PCT for important applications including transcranial brain imaging. AcknowledgmentsThe authors acknowledge Brad Treeby and Ben Cox for helpful discussions regarding the k-Wave toolbox and Zijian Guo for useful discussions regarding the design of the experiment. Chao Huang, Robert W. Schoonover, and Mark A. Anastasio acknowledge support in part by NIH awards EB010049 and EB009715. Liming Nie and Lihong V. Wang acknowledge support by the NIH awards EB010049, CA134539, EB000712, CA136398, and EB008085. L.V.W. has a financial interest in Microphotoacoustics, Inc. and Endra, Inc., which, however, did not support this work. ReferencesL. V. Wang,
“Prospects of photoacoustic tomography,”
Med. Phys., 35
(12), 5758
–5767
(2008). http://dx.doi.org/10.1118/1.3013698 MPHYA6 0094-2405 Google Scholar
M. XuL. V. Wang,
“Photoacoustic imaging in biomedicine,”
Rev. Sci. Instrum., 77
(4), 041101
(2006). RSINAK 0034-6748 Google Scholar
A. A. OraevskyA. A. Karabutov,
“Optoacoustic tomography,”
Biomedical Photonics Handbook, CRC Press, Boca Raton, FL
(2003). Google Scholar
L. V. Wang,
“Photoacoustic imaging and spectroscopy,”
Photoacoustic Imaging and Spectroscopy, CRC Press, Boca Raton, FL
(2009). Google Scholar
W. Joineset al.,
“Microwave power absorption differences between normal and malignant tissue,”
Int. J. Radiat. Oncol. Biol. Phys., 6
(6), 681
–687
(1980). http://dx.doi.org/10.1016/0360-3016(80)90223-0 IOBPD3 0360-3016 Google Scholar
W. CheongS. PrahlA. Welch,
“A review of the optical properties of biological tissues,”
IEEE J. Quant. Electron., 26
(12), 2166
–2185
(1990). http://dx.doi.org/10.1109/3.64354 IEJQA7 0018-9197 Google Scholar
R. KrugerD. ReineckeG. Kruger,
“Thermoacoustic computed tomography-technical considerations,”
Med. Phys., 26
(9), 1832
–1837
(1999). http://dx.doi.org/10.1118/1.598688 MPHYA6 0094-2405 Google Scholar
M. Haltmeieret al.,
“Thermoacoustic computed tomography with large planar receivers,”
Inverse Probl., 20
(5), 1663
–1673
(2004). http://dx.doi.org/10.1088/0266-5611/20/5/021 INPEEY 0266-5611 Google Scholar
B. T. Coxet al.,
“Two-dimensional quantitative photoacoustic image reconstruction of absorption distributions in scattering media by use of a simple iterative method,”
Appl. Opt., 45
(8), 1866
–1875
(2006). http://dx.doi.org/10.1364/AO.45.001866 APOPAI 0003-6935 Google Scholar
K. Wanget al.,
“An imaging model incorporating ultrasonic transducer properties for three-dimensional optoacoustic tomography,”
IEEE Trans. Med. Imaging, 30
(2), 203
–214
(2011). http://dx.doi.org/10.1109/TMI.2010.2072514 ITMID4 0278-0062 Google Scholar
Z. XuQ. ZhuL. Wang,
“In vivo photoacoustic tomography of mouse cerebral edema induced by cold injury,”
J. Biomed. Opt., 16
(6), 066020
(2011). http://dx.doi.org/10.1117/1.3584847 JBOPFO 1083-3668 Google Scholar
P. J. La RivièreJ. ZhangM. A. Anastasio,
“Image reconstruction in optoacoustic tomography for dispersive acoustic media,”
Opt. Lett., 31
(6), 781
–783
(2006). http://dx.doi.org/10.1364/OL.31.000781 OPLEDP 0146-9592 Google Scholar
Y. XuL. V. Wang,
“Time reversal and its application to tomography with diffracting sources,”
Phys. Rev. Lett., 92
(3), 033902
(2004). http://dx.doi.org/10.1103/PhysRevLett.92.033902 PRLTAO 0031-9007 Google Scholar
B. E. TreebyE. Z. ZhangB. T. Cox,
“Photoacoustic tomography in absorbing acoustic media using time reversal,”
Inverse Probl., 26
(11), 115003
(2010). http://dx.doi.org/10.1088/0266-5611/26/11/115003 INPEEY 0266-5611 Google Scholar
P. Burgholzeret al.,
“Compensation of acoustic attenuation for high-resolution photoacoustic imaging with line detectors,”
Proc. SPIE, 6437 643724
(2007). http://dx.doi.org/10.1117/12.700723 PSISDG 0277-786X Google Scholar
D. ModgilM. A. AnastasioP. J. La Rivière,
“Photoacoustic image reconstruction in an attenuating medium using singular value decomposition,”
in IEEE Nucl. Sci. Conf. R.,
4489
–4493
(2008). http://ieeexplore.ieee.org/xpls/abs_all.jsp?arnumber=4774277&tag=1 Google Scholar
X. L. Den-BenD. RazanskyV. Ntziachristos,
“The effects of acoustic attenuation in optoacoustic signals,”
Phys. Med. Biol., 56
(18), 6129
–6148
(2011). http://dx.doi.org/10.1088/0031-9155/56/18/021 PHMBA7 0031-9155 Google Scholar
L. NieZ. GuoL. V. Wang,
“Photoacoustic tomography of monkey brain using virtual point ultrasonic transducers,”
J. Biomed. Opt., 16
(7), 076005
(2011). http://dx.doi.org/10.1117/1.3595842 JBOPFO 1083-3668 Google Scholar
T. L. Szabo,
“Time domain wave equations for lossy media obeying a frequency power law,”
J. Acoust. Soc. Am., 96
(1), 491
–500
(1994). http://dx.doi.org/10.1121/1.410434 JASMAN 0001-4966 Google Scholar
T. L. Szabo,
“Diagnostic ultrasound imaging,”
Diagnostic Ultrasound Imaging: Inside Out, Elsevier, Oxford, UK
(2004). Google Scholar
B. TreebyB. Cox,
“-wave: MATLAB toolbox for the simulation and reconstruction of photoacoustic wave fields,”
J. Biomed. Opt., 15
(2), 021314
(2010). http://dx.doi.org/10.1117/1.3360308 JBOPFO 1083-3668 Google Scholar
P. He,
“Determination of ultrasonic parameters based on attenuation and dispersion measurements,”
Ultrason. Imag., 20
(4), 275
–287
(1998). http://www.cs.wright.edu/people/faculty/phe/Research/U-Imaging-98.pdf ULIMD4 0161-7346 Google Scholar
Y. HristovaP. KuchmentL. Nguyen,
“Reconstruction and time reversal in thermoacoustic tomography in acoustically homogeneous and inhomogeneous media,”
Inverse Probl., 24
(5), 055006
(2008). http://dx.doi.org/10.1088/0266-5611/24/5/055006 INPEEY 0266-5611 Google Scholar
J. F. Aubryet al.,
“Experimental demonstration of noninvasive transskull adaptive focusing based on prior computed tomography scans,”
J. Acoust. Soc. Am., 113
(1), 84
–93
(2003). http://dx.doi.org/10.1121/1.1529663 JASMAN 0001-4966 Google Scholar
S. PichardoV. SinK. Hynynen,
“Multi-frequency characterization of the speed of sound and attenuation coefficient for longitudinal transmission of freshly excised human skulls,”
Phys. Med. Biol., 56
(1), 219
–250
(2011). http://dx.doi.org/10.1088/0031-9155/56/1/014 PHMBA7 0031-9155 Google Scholar
|


