|
|
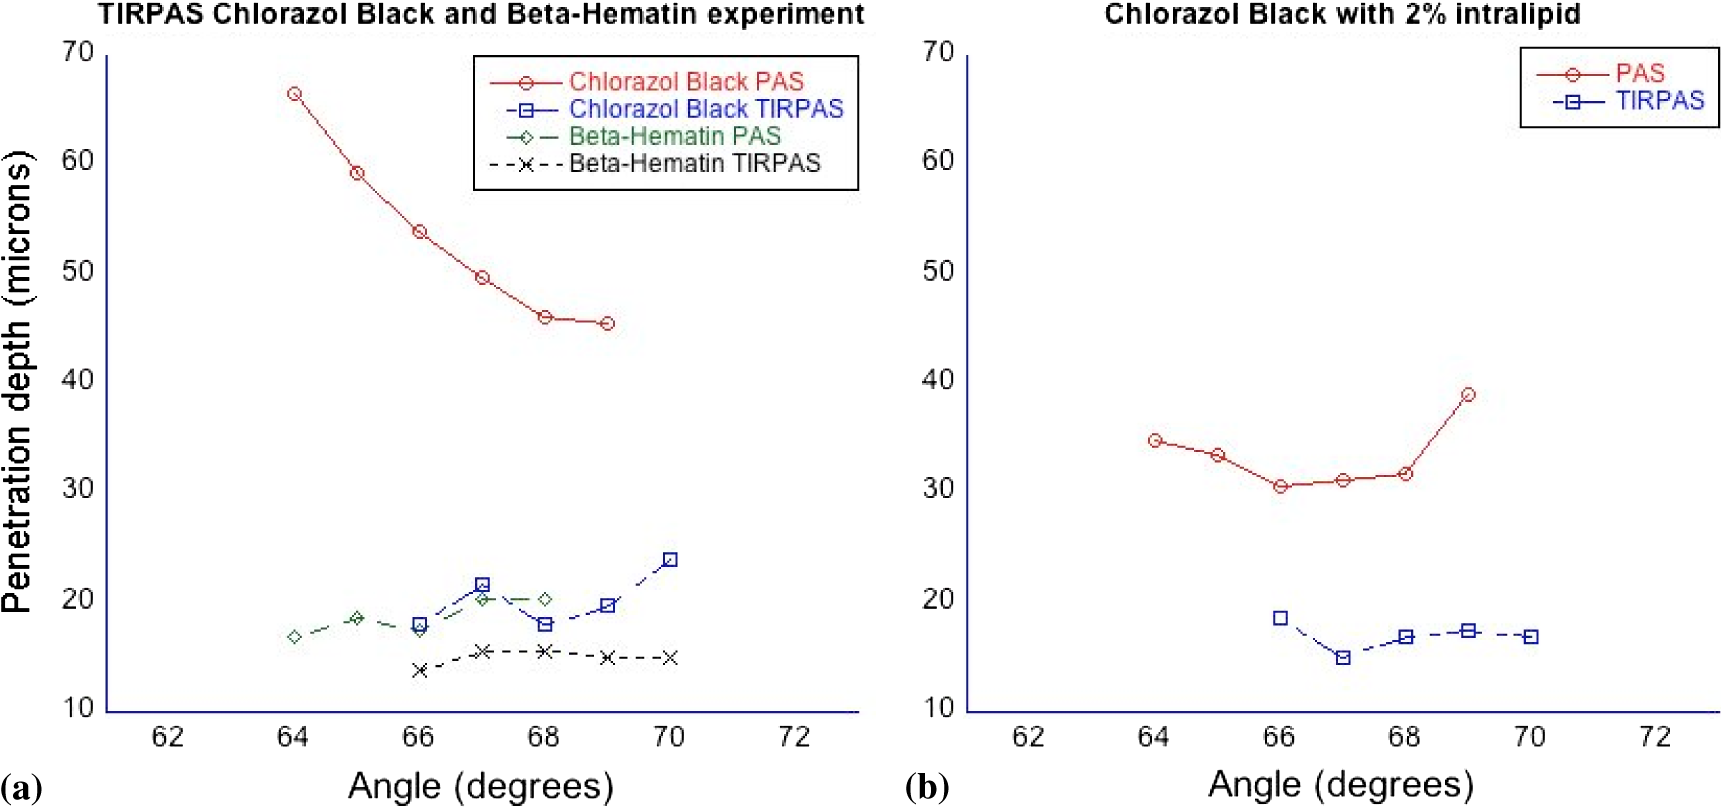
1.IntroductionSensors using the evanescent field have become extremely useful in the past few years. These sensors have been created to detect a wide variety of materials. Some of the more important uses of this technology have been to detect 2,4-dinitrotoluene,1 pesticides,2 pathogens,3 nucleic acids,4 gases,5 and disease markers such as the HER2 breast cancer marker.6 These sensors function by measuring the interaction of the evanescent field, a non-propagating near field optical wave, with the target. In the early 1980s, Hinoue et al.7–10 developed a total internal reflection photoacoustic spectroscopy (TIRPAS) technique to detect dyes in a sample that used the evanescent field to create acoustic waves. Unfortunately, the sensitivity of the device was limited to the detection of highly absorbing dyes that could easily be seen with the eye and was unable to provide a meaningful detection of biological analytes due to the lack of high peak-power lasers. This technique was modified and expanded in order to excite the samples under 1 MW peak-power conditions as opposed to the high speed beam chopper with a 5 mW continuous wave laser used previously. This giga fold increase in peak-power allows for the detection of microgram quantities of -hematin that brings the TIRPAS technology into the useful realm of biological analyte sensing. Current commercial absorption-based evanescent field biosensors, such as internal reflection spectroscopy elements pioneered by Harrick,11 are problematic with low absorbance materials. In internal reflection spectroscopy the measured absorption is determined from the difference between a reference reflection with no sample and the sample’s reflected light. This difference is often very small for nearly optically transparent materials in the visible wavelengths. Consequently, complicated and expensive multiple internal reflection systems must typically be created to overcome this limitation. Fortunately, however, since TIRPAS generates an active source of ultrasound with the interaction between the analyte and the evanescent field there is no inherent ultrasonic background during sampling. Any absorption that can be distinguished by an acoustic transducer will result in detection of a low absorption analyte without the need for a reference reflection. It is important to mention that this technology of generating acoustic waves from total internal reflection is completely distinct from Paltauf et al.12 who used a glass/sample interface to detect acoustic waves by the local disturbance in the index of refraction from the acoustic waves. Conversely, in TIRPAS, the acoustic wave occurs from the absorption of the evanescent field at the glass/sample interface by the sample. 1.1.Background of Hemazoin and -HematinHemozoin is a chemical byproduct found in human blood that has been infected with malaria. The formation of hemozoin by the malaria parasite Plasmodium falciparum begins once the parasite has infected an erythrocyte of the host. This stage of disease development is characterized by a period of growth for the parasite that is fueled by amino acids of the host cell’s cytoplasmic hemoglobin broken down inside a digestive vacuole.13 The byproduct of hemoglobin digestion is molecular heme, a compound that harms the parasite by inhibiting enzymes, peroxidizing membranes, and producing oxidative free radicals. Plasmodium falciparum is incapable of digesting heme, and must resort to polymerizing heme into hemozoin, an inert molecule made of heme monomers joined to one another by iron-carboxylate bonds. Infection causes the erythrocyte to eventually rupture and hemozoin is released into the blood stream, where some of it is engulfed by leukocytes via phagocytosis while some of it remains in the bulk blood. Due to the difficulty in obtaining samples of hemazoin testing with an optically analogous material was preferred for these experiments. -Hematin is a viable analogue for hemozoin in detection systems based on spectroscopic methods, such as TIRPAS, because -hematin has the same optical and structural properties as hemozoin.14 -Hematin was used for testing the TIRPAS system due to the availability and cost compared to actual hemozoin crystals. As a synthetically derived material, -hematin is created by the precipitation of haemin in an acetate buffer.14 The reasonably high optical absorption of -hematin in the visible spectrum (Fig. 1) allows for the use of a standard laser harmonic wavelength, 532 nm, for photoacoustic excitation. In addition, the average size of -hematin is on the order of the evanescent field penetration depth in the TIRPAS experiments. This should give rise to little background signal since the evanescent field can not penetrate into larger absorbing structures such as red blood cells that are at least an order of magnitude larger than the crystals. -hematin and chlorazol black dye, two optically similar materials, are used to show the potential of TIRPAS as a biosensor for the detection of malaria, while advantages and disadvantages of the system with regards to its detection capability are also discussed. Additionally, through the angle experiments and previous theory, the shape and size of the photoacoustic effect is related to absorption, index of refraction, and optical penetration depth. These variables affect any type of photoacoustic spectroscopy by changing the pressure maxima and distribution, however the exact understanding of how the excitation under TIRPAS conditions functions was more completely understood with the following experiments. 2.Materials and MethodsA schematic of the TIRPAS device is visualized by Fig. 2. Fig. 2Setup for TIRPAS along with how the beam TIR and non TIR reflected portions differ with angle.  2.1.ExperimentsAll testing was performed on the same hybrid TIRPAS/photoacoustic spectroscopy setup. Both angle experiments were accomplished by selectively blocking the beam with a spatial filter as explained in Sec. 2.6. The dilution experiment was performed by spatial filtering the beam to leave a laser beam filtered below the critical angle. This left an excitation beam that was a semi-circular spot undergoing TIRPAS excitation at the highest radiant exposure and penetration depth available for TIRPAS in this setup. 2.2.Laser and Optical FiberA Q-switched Nd:YAG laser (Surelite I-20 doubled to 532 nm, Continuum, Santa Clara, California) was coupled through 1000 μm 0.37 NA optical fiber (BFH37-1000, Thorlabs, Newton, New Jersey). The laser was pulsed at 20 Hz at a duration of 5 ns with energies ranging from 5 to 6 mJ. This optical fiber was coupled to a set of lenses designed to collimate the output before entering the hemicylindrical lens. 2.3.Coupling OpticsLaser light coming from the optical fiber was then input to a system of lenses that collimated the light for TIRPAS excitation. The 100 mm (LA1509, Thorlabs, Newton, New Jersey), 50 mm (LA1131, Thorlabs, Newton, New Jersey), and (LC2679, Thorlabs, Newton, New Jersey) lenses were used to collimate the laser light in that order. 2.4.Sample Holder and Transducer ElectronicsThe hemicylindrical lens was mounted to a rotational stage and to an XYZ stage (481-A, Newport, Irvine, California and LT3, Thorlabs, Newton, New Jersey), which allowed the hemicylindrical lens to be adjusted to position the total internal reflected spot as well as to change the angle of incidence of the incoming laser light. The voltage response of a polyvinyldiene fluoride (PVDF) transducer was amplified by a 350 MHz preamplifier (SR445A, Stanford Research Systems, Sunnyvale, California). The amplifier was then attached to a 200 MHz four-channel digital storage oscilloscope (TDS 2024B, Tektronix, Beaverton, Oregon) through coaxial cable (2249-C-24, Pomona, Everett, Washington). A silicon photodiode (DET10A, Thorlabs, Newton, New Jersey) was used to trigger the oscilloscope. 2.5.PVDF TransducerA gold coated PVDF transducer was used as the acoustic sensor to detect ultrasonic waves. This sensor was similar to the designs used in John Viator’s dissertation15 except that the element was not etched and a layer of silicone was added to protect the sensing material and to prevent the sample from staining the transducer. This coating did not introduce significant reflections due to its close impedance match with the sample, which was mostly water. The acoustic impedance of the silicone was 1.1 MRayls which is a close match to water’s 1.5 MRayls. At normal incidence this boundary gives a reflection coefficient of approximately 2%. In addition, we used a brass mask to create an approximately square active area in the center of the transducer to be used as the detection area. 2.6.Spatial FilterHarrick11 suggests a method of collimating the output to the interface by equation . where d is the distance of the source to the prism and is the index of refraction of the hemicylindrical lens. Unfortunately, due to the large radius of the lens and the large numerical aperture of the optical fiber, 37, less than 1 mJ of energy was possible for TIRPAS excitation under this configuration. Therefore, was not used and a spatial filter was used to block selected angles of excitation for the TIRPAS and photoacoustic spectroscopy experiments to compensate for the lack of collimation at the interface. An XYZ stage (PT3, Thorlabs, Newton, New Jersey) holding a spatial filter was used between light undergoing TIRPAS and photoacoustic spectroscopy excitation respectively as can be seen in Fig. 2. Since the pre-hemicylindrical lens collimation caused a significant divergence angle across the length of the total internal reflection spot, angles of light were blocked under photoacoustic spectroscopy excitation when TIRPAS was being studied and under TIRPAS excitation when photoacoustic spectroscopy was being studied. This setup introduced a continuum of angles that collectively gave rise to the photoacoustic signal in each experimental case. 2.6.1.Electrical impedance mismatchesAn important aspect of TIRPAS is the proper utilization of impedance matched cables and amplifiers. In photoacoustic spectroscopy, the frequencies are usually not significantly high enough to cause many reflections in the electrical connections; however, in TIRPAS, even with the lower frequencies we can obtain electrical reflections in the cable that cause significant ringing in the signal and will occur without proper impedance matching. impedance cables were used to obtain appropriate signals. 2.7.TIRPAS and -HematinThe macrostructure of -hematin is a 100 nm by 300 nm crystalline rod that has the ability to create a hydrogen bond to neighboring -hematin crystals. The size of a typical red blood cell is on the order of several microns, at least an order of magnitude larger than the -hematin crystals. The size of -hematin is ideal for photoacoustic detection through TIRPAS because it is on the same order of magnitude as the penetration depth of the evanescent field, which means that the background signal from hemaglobin can be reduced by appropriately choosing the penetration depth in TIRPAS by setting the angle of excitation. 2.8.-Hematin Synthesis40 g of NaOH pellets were dissolved into 60 ml of stirred distilled water to create a 12.9 M NaOH solution while covering the beaker to prevent evaporation. While rapidly stirring 75 ml of 17.1 M glacial acetic acid 12.9 M NaOH was added drop-wise until the pH of the titrated buffer solution was 4.5. Distilled water was added until the total solution volume became 100 ml. 34 ml of 0.1 M NaOH solution was heated to 60°C 175.5 mg of haemin (Sigma-Aldrich, St. Louis, MO) was dissolved in the NaOH solution while stirring the covered beaker. 20.7 ml of the acetic acid buffer was heated to 60°C. The haemin solution was neutralized with 3.4 ml of 1 M HCl solution. After stirring for 5 min the 20.7 ml of acetic acid buffer was added to the neutralized haemin solution. The resulting solution was covered and stirred at 60°C for 2 h. The solution was then put in an ice bath for 10 min. The cooled solution was filtered over 8.0 μm nitrocellulose filter paper (Millipore, Billerica, MA) and the filtered precipitate was washed with distilled water and dried for 5 min. The solid -hematin was desiccated for 48 h. Finally, -hematin was stored in PBS suspension away from light exposure at 4°C until use. 2.8.1.Determining the critical angleThe non-zero divergence of the beam allowed for a simple visual determination of the critical angle (see Fig. 2). Using safety goggles the reflected spot was observed undergoing TIR from a scattering surface placed after the light had exited the hemicylindrical lens. The scattered laser spot had two components. One side of the spot is visibly darker due to the increased loss from the reflected light not being under total internal reflection due to the continuum of divergence angles. The other side is lighter and is indicative of the light that is undergoing evanescent absorption at the glass/sample interface. The interface between the brighter and darker sections of the spot indicates the position where the critical angle occurs. Changing the angle of the hemicylindrical lens relative to the incident laser beam will shift the position of this line and thus the proportion of the spot that is undergoing TIRPAS and photoacoustic spectroscopy respectively. The resulting excitation spot is spatially filtered with the aid of the reflected spot to make the measurements of TIRPAS and photoacoustic spectroscopy independent of each other (Fig. 3). Fig. 3(a) Basic physical setup for TIRPAS. (b) Divergent light after passing through the prism/sample interface. The TIR position is represented by the line between the lighter and darker shades at the bottom of the cone. The darker shade represents the part of the excitation beam in photoacoustic spectroscopy and the brighter shade represents the part of the excitation beam under TIRPAS excitation. 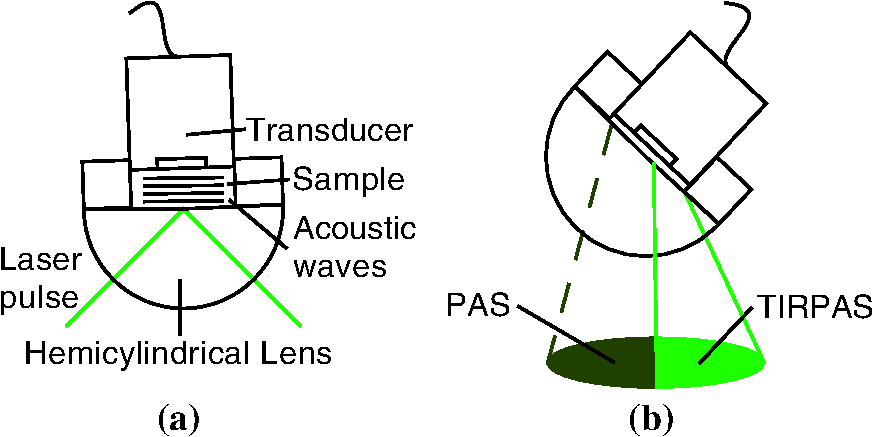 2.9.TIRPAS Angle Test with Chlorazol BlackChlorazol Black with an absorption coefficient of at 532 nm was used in order to assume a low absorption condition, less than 10% absorption per interaction, to simplify the evanescent absorption equations as stated by Harrick.11 The angle of the hemicylindrical lens was changed relative to the incident laser light by a rotational stage (481-A, Newport, Irvine, California). This experiment was performed five times and the values were averaged (Fig. 4). Fig. 4(a) Five averages of the top left graph in Fig. 5. (b) An outlier in the angle measurement. As can be seen in both the outlier and the averaged graph there is a significant transition in penetration depth at 67 deg. This corresponds to the penetration depth difference between photoacoustic spectroscopy and TIRPAS excitation.  2.10.TIRPAS Detection Limit Test with Chlorazol BlackDilutions of an initial Chlorazol Black solution were excited at 532 nm. The detection limit was defined by a signal to noise ratio of ~3:1. The laser spot was spatially filtered to produce the largest portion of the spot at the critical angle for the dilution because the penetration depth of the evanescent field is the largest under this condition. 2.11.Matlab AnalysisIn order to rapidly analyze the photoacoustic signals recorded on the oscilloscope, a graphical user interface (GUI) was developed in MATLAB to import the data and determine the penetration depth of a given signal. The GUI determines the penetration depth as a user-defined percentage of the maximum value of the desired photoacoustic waveform. Using the cursor, the user is able to visually define the time domain of the photoacoustic signal prior to the percent-maximum calculation in order to avoid bias due to noise and extraneous acoustic effects that might also have been recorded in the data file. The program displays the location of the percent-maximum on the plot of the original waveform in addition to displaying its value for user verification of correct penetration depth. The program is available at http://kolbe.missouri.edu/Matlab.html, listed as PenetrationDepth.zip. 3.ResultsOn the right side of Fig. 5 the comparison between the two types of excitation, TIRPAS and photoacoustic spectroscopy, can be seen. The TIRPAS waveform has a much sharper decay than the typical photoacoustic spectroscopy waveform. Fig. 5(a) How the optical penetration depth changes based upon angle. (b) The difference in signal width between TIRPAS and photoacoustic spectroscopy waveforms at the critical angle.  The graph on the left of Fig. 5 displays how the optical penetration depth reduces in magnitude versus an increasing excitation angle. The measured penetration depths under TIRPAS excitation and the measured penetration depths under photoacoustic spectroscopy excitation never cross. These measurements, despite using some of the same angles and both being excited using some form of the photoacoustic effect, show different optical penetration depths when the when photoacoustic spectroscopy and TIRPAS data are contrasted. The graph on the right shows the physical effect of this difference in penetration depth on single waveforms between photoacoustic spectroscopy and TIRPAS excitation. The TIRPAS waveform rises much faster than its corresponding photoacoustic spectroscopy counterpart. On the left side of Fig. 4 the average of four tests to determine the penetration depth in both photoacoustic spectroscopy and TIRPAS is shown. There is a significant drop in penetration depth at the critical angle between photoacoustic spectroscopy and TIRPAS excitation. The right side of Fig. 4 shows an anomalous reading, which may have been caused by setup movement during the experiment, but is displayed for completeness. A dilution experiment was performed with chlorazol black dye dissolved in water to determine the approximate detection limit of the system. The approximate detection limit was . Such a low absorption would be difficult to detect using photoacoustic spectroscopy due to the very large optical path length needed for excitation. Figure 6 shows an experiment determining the penetration depth of a non-zero scattering material. The figure on the left shows the penetration depths of standard chlorazol black dye and -hematin in both photoacoustic spectroscopy and TIRPAS excitation. The -hematin penetration depths are much closer in value for both photoacoustic spectroscopy and TIRPAS excitation. The figure on the right shows Chlorazol Black with a 2% intralipid optically scattering solution. Both TIRPAS and photoacoustic spectroscopy excitation values are much closer to each other, similar to the figure on the left for -hematin. 4.Discussion4.1.Relating Photoacoustic Absorption to the Index of Refraction in TIRPASIt is well known in both evanescent field sensing16–19 and in TIRPAS based sensing7–10,20 that the electric field decays evanescently with an exponential according to the equation where and refer to the electric field intensity at a certain depth and initial intensity at the interface, respectively, is the depth into sample, and is the penetration depth coefficient. The ability for the light to be absorbed into an analyte very close to the interface is dependent upon four fundamental properties: penetration depth, electric field strength, sampling area, and how well the sample and prism indexes of refraction are matched.11 Since the photoacoustic effect is caused by absorption of photons into materials that causes localized thermoelastic expansion to induce an acoustic wave, the penetration depth is one of the factors that controls the sensitivity of the TIRPAS device.The penetration depth is controlled by the following factors in the equation where , and are the index of refraction of the hemicylindrical lens and the sample, angle of excitation, and according to Muessig et al.20The 5 ns pulsed laser used was not fast enough to fall within a stress confined condition, however, a reasonable equation to explain the amount of power absorbed can still be obtained when the underlying causes of the absorption and the relationship of the absorption to the index of refraction, are considered. 4.2.Derivation of the Proportion for Photoacoustic AbsorptionIn Muessig et al.20 the authors describe an equation to relate the absorbed power to the penetration depth and to the strength of the electric field. For the experiments conducted a similar expression can be obtained by substituting the electric field with an average of the parallel and perpendicular electric fields. This does not completely explain our results due to the assumption that polarization interaction does not change with the angle of incidence. However, it does give a general overview to the interaction if each polarization is assumed to contribute equally to the absorbed power. In addition, if the terms and are known in the experiment being conducted their proportional contribution can be calculated by the amount each contributed to the excitation energy. The important variables regarding photoacoustic signal pressure can be explained by the following proportion where is the electric field intensity of the parallel polarization and is the electric field intensity of the perpendicular polarization and is the acoustic pressure. Absorption is directly related to the amount of acoustic pressure generated in a sample under photoacoustic excitation.From Muessig et al.,20 it has been shown that the electric field parallel to the interface is In addition, the electric field perpendicular to the surface is where , , , and are the values to indicate the proportion of each polarization used in excitation; in this case since each polarization is assumed to contribute half the photoacoustic response to the system, and and are the electric field intensities for parallel and perpendicular polarization respectively. The effective thickness of the evanescent field is controlled by the four factors, electric field intensity, penetration depth, index matching of the sample/hemicylindrical lens interface, and the sampling area. The equation above shows variables for three of the four factors, penetration depth, electric field, and index matching which agrees well with current theory. The sampling area would be included as a multiplication constant for the above equation since it should be proportional to the area of excitation.4.3.Plane Waves and TIRPASIn contrast to photoacoustic spectroscopy, the main observation was that every waveform regardless of the absorption is a plane wave. This concept can be better understood with a more thorough analysis of the interaction between the evanescent field and the target absorber. Plane waves can be understood by the near field/far field relationship in photoacoustic spectroscopy which is appropriate to apply when the transducer is closer than the boundary where , or in the acoustic near field, as found in Viator et al.21 is the distance from the transducer to the near field/far field boundary, and d is the beam diameter. Under this condition an acoustic piston is approximated where almost half the acoustic energy generated moves forward in the direction of excitation. In TIRPAS a similar effect is observed (see Figs. 4 and 5) which can be explained by the fact that the evanescent field only penetrates a very small amount, , into the medium and so an acoustic piston is nearly guaranteed for most optically absorbing materials. The acoustic piston phenomena made detection much less ambiguous than typical photoacoustic excitation where plane waves are only obtained if the sample is significantly absorbing and the spot size is very large according to . In the TIRPAS system a plane wave will be obtained for all absorbing materials unless the spot size for excitation is as small as the penetration depth or thickness of the sample, whichever is smaller, which would necessarily be a diffraction limited spot even for bulk excitation in the visible wavelengths. 4.4.Penetration DepthThe penetration depth of the evanescent field exponentially decays close to the interface of total internal reflection. The point where the evanescent field decays to 37% () of the incident energy is defined as the penetration depth and can be used as one factor to predict evanescent field interaction which is described by Eq. (2).16,17 The penetration depth is important for TIRPAS excitation which uses evanescent field absorption to detect the analyte. Physical sizes of analytes can range from an order of magnitude larger to an order of magnitude smaller than the penetration depth of the evanescent field () in typical biological systems. An example of this would be a cell which may be 10 μm in size compared to the size of a hemazoin crystal which is . By changing the penetration depth of the evanescent field, different analytes can be detected of different sizes since the field will interact with the material based upon its size along with its inherent optical absorption. 4.4.1.Stress confinementIn photoacoustic spectroscopy, the stress confinement equation describes an ideal condition where the pulse of the incident light occurs faster than the acoustic wave can propagate away and therefore the resulting acoustic wave represents how the light decays through the media. This allows for optical properties such as the absorption coefficient to be extracted from the data since there is no significant influence from the laser pulse duration which is conditionally met under stress confinement. This is explained in more detail by Viator et al.21 and Viator.15 where and is the absorption coefficient of the sample and is the speed of sound in the sample medium. Using this stress confinement condition and curve fitting the waveform with an exponential least squares regression algorithm, optical properties such as the absorption coefficient can be extracted from a curve fit of the waveform. Assuming that TIRPAS waveforms are stress confined, the experimental evidence should show that the waveforms’ penetration depth can change based upon a change in the evanescent field penetration depth. However, our data shows a reasonably flat line at all angles (see Figs. 4Fig. 5–6).Choi et al.,22 studied how the laser pulse duration affected the computed from curve fitting the waveforms collected by photoacoustic spectroscopy. It was shown that as the stress confinement condition was no longer satisfied, the estimation was increasingly underestimated until the highest achievable was asymptotically reached. In that case, one would expect the penetration depth, which is the inverse of , to hit a minimum value if the stress confinement condition is not met. This result is what the data shows (see Figs. 4 and 5) which suggests that the TIRPAS waveforms are not in stress confinement and are limited by the duration of the laser pulse. If laser light is delivered to a sample within the stress confinement condition, no significant amount of the acoustic energy has time to propagate away before the pulse ends. Since TIRPAS has a very small penetration depth, , then using the stress confinement estimate for TIRPAS is at maximum 0.33 ns around the largest penetration depth. 4.5.Signal AcquisitionSince the penetration depth of the evanescent field, even near the critical angle, is within hundreds of nanometers of the interface, most of the frequency components expected under stress confined TIRPAS would be in the low GHz range. Since the duration of the laser pulse was 5 ns, this limited the frequency range to the maximum obtainable via a 5 ns pulse. To determine this frequency range, we used a simple method15 and assumed a pulse duration of 5 ns where is the approximate frequency maximum of the resulting wave and is the pulse duration of the laser.The PVDF sensors used were reliable at frequencies up to approximately 100 MHz. Far beyond 100 MHz, the PVDF does not respond linearly to inputs. This may explain why the minimum penetration depth was sometimes twice the 7.5 μm minimum corresponding to a 5 ns pulse since the PVDF realistically stops giving consistent results beyond 10 to 15 μm penetration depth. The maximum sampling rate of the oscilloscope used was 200 MHz which would not be enough sampling to fully capture the signals appropriately if a picosecond laser were used in order to stay within the regime of stress confinement. However, due to the ns pulse duration issue mentioned above, the maximum frequency threshold was far below the maximum frequency of the oscilloscope and therefore, no distortion was expected. In Fig. 5 the difference in frequency components can be inferred when the penetration depths of photoacoustic spectroscopy and TIRPAS are compared. TIRPAS contains very high frequency components due to its penetration depth being on the order of a few hundred nanometers. The penetration depth of TIRPAS corresponds to a rise time of 5 ns in Fig. 5. Since the 200 MHz oscilloscope used can resolve faster differences than this, aliasing was not considered. 4.6.Signal ExplanationWith the above limitations in mind, it is important to note the differences detected between the TIRPAS signal and the photoacoustic spectroscopy signal at different angles of incidence. Figure 4 shows the measured penetration depth of the optical radiation versus the angle of incidence of the pulsed laser light onto the inner surface of the glass/sample interface. It should be noted that due to the beam divergence the angles listed are a continuum of angles from the critical angle to the most grazing angle. The penetration depth under angled photoacoustic spectroscopy excitation levels off as it is brought very close to the critical angle. A beam of light exciting a material will always have a lower penetration depth the larger the angle of incidence. When the critical angle is reached the penetration depth falls to the laser pulse/PVDF limited penetration depth for all angles at or beyond the critical angle. This much lower penetration depth is due to the fact that in photoacoustic spectroscopy the penetration depth is solely a function of the absorber in normal incidence, but in TIRPAS, the penetration depth is a function of the wavelength, index of refraction of the sample and substrate, and the angle of incidence at the interface, which gives rise to the evanescent field which controls the penetration depth. 4.7.Advantages of TIRPASThere are three advantages to TIRPAS compared to conventional spectroscopy and other evanescent field sensors. Since the excitation comes from the interaction of the evanescent field with the interface up to only a few hundred nanometers, biological analytes of interest can be size filtered for detection. This type of size filtering utilizing the evanescent field’s angularly dependent penetration depth allows for the analysis of harmful chemicals in biological fluids without the background from cellular components. TIRPAS produces easily discernible signals since almost all signals are plane waves as discussed previously. Moreover, the absorbed energy is converted to acoustic energy making redundant the need to change detectors based on wavelength and therefore, allowing the method to be utilized over the large optical spectrum without expensive or time consuming alterations to the setup.23 Finally, TIRPAS has the potential to determine the absorption spectrum of a material based upon peak to peak signal voltage in a similar way to internal reflection spectroscopy as discussed by Harrick.11 4.8.-Hematin and Optical ScatteringIn Fig. 6, the penetration depth for chlorazol black is typical for what is expected with photoacoustic spectroscopy and TIRPAS excitation. However, for -hematin the same setup parameters provide the same results for TIRPAS but generate different results for photoacoustic spectroscopy. From transmission electron microscopy images of -hematin in Fig. 7 it is observed that the length of individual crystals is on the order of the wavelength of light used (532 nm) as well as on the order of the penetration depth, . Due to -hematin’s size and shape the component for Mie scattering as well as Raleigh scattering should be significant with the sample and wavelength. A 2% intralipid solution was added to the chlorazol black dye of the same optical absorption coefficient used in other testing. This increased the scattering of the chlorazol black to visually approximate that of -hematin. In Fig. 6 the results of this test show that the same trend of the penetration depth under photoacoustic spectroscopy excitation with non-scattering chlorazol black solution is no longer observed. Instead a very similar result to the -hematin is observed where the penetration depth changes differently along with the overall penetration depths being much closer to those observed in TIRPAS. This effect can be explained by two factors. First, photoacoustic spectroscopy under stress confinement displays the distribution of photons in a material. Therefore, a scatterer, by changing the distribution of photons, can change the photoacoustic effect associated with it. Also, the addition of scattering material tends to make the penetration depth smaller since the distribution of photons is affected by both and . 5.ConclusionTIRPAS has the ability to detect chlorazol black dye at an absorption coefficient of . In addition, the results show how the penetration depth changes based upon the angle of incidence. Finally, the angle test of -hematin shows the potential for TIRPAS to be used as a biosensor for the early detection of malarial infection. AcknowledgmentsWe would like to acknowledge Bobbi J. Hauptmann and Ronald G. Phillips of the Boone County Lumber Building Technology Laboratory within the Department of Architectural Studies at the University of Missouri-Columbia. We would additionally like to acknowledge the Physics Machine Shop at the University of Missouri-Columbia. ReferencesY. Sunet al.,
“Optofluidic ring resonator sensors for rapid DNT vapor detection,”
Analyst (Amsterdam), 134
(7), 1386
–1391
(2009). http://dx.doi.org/10.1039/b900050j ANLYAG 0365-4885 Google Scholar
M. Zourobet al.,
“Optical leaky waveguide biosensors for the detection of organophosphorus pesticides,”
Analyst (Amsterdam), 132
(2), 114
–120
(2007). http://dx.doi.org/10.1039/b612871h ANLYAG 0365-4885 Google Scholar
H. Mukundanet al.,
“Waveguide-based biosensors for pathogen detection,”
Sensors, 9
(7), 5783
–5809
(2009). http://dx.doi.org/10.3390/s90705783 SNSRES 1424-8220 Google Scholar
H. P. Lehret al.,
“Real-time detection of nucleic acid interactions by total internal reflection fluorescence,”
Anal. Chem., 75
(10), 2414
–2420
(2003). http://dx.doi.org/10.1021/ac0206519 ANCHAM 0003-2700 Google Scholar
Y. Sunet al.,
“Rapid tandem-column micro-gas chromatography based on optofluidic ring resonators with multi-point on-column detection,”
Analyst (Amsterdam), 135
(1), 165
–171
(2010). ANLYAG 0365-4885 Google Scholar
J. T. GohringP. S. DaleX. Fan,
“Detection of HER2 breast cancer marker using the opto-fluidic ring resonator biosensor,”
Sens. Actuators B. Chem., 146
(1), 226
–230
(2010). http://dx.doi.org/10.1016/j.snb.2010.01.067 0925-4005 Google Scholar
T. HinoueY. ShimaharaY. Yokoyama,
“Photoacoustic observation of solid-liquid interface by means of total internal reflection technique,”
Chem. Lett., 12
(2), 225
–228
(1983). http://dx.doi.org/10.1246/cl.1983.225 CMLTAG 0366-7022 Google Scholar
T. Hinoueet al.,
“Photoacoustic spectrometry by total internal reflection technique: dependence of photoacoustic signal intensity on concentration and optical path,”
Bunseki Kagaku, 33 E459
–E466
(1984). http://dx.doi.org/10.2116/bunsekikagaku.33.11_E459 BNSKAK 0525-1931 Google Scholar
T. HinoueH. MurataY. Yokoyama,
“Photoacoustic spectrometry coupled with total internal reflection technique: theory and experiment,”
Anal. Sci., 2 401
–406
(1986). http://dx.doi.org/10.2116/analsci.2.401 ANSCEN 0910-6340 Google Scholar
T. HinoueM. KawabeY. Yokoyama,
“Measurement of concentration profile of dye at glass-solution interface by photoacoustic spectrometry coupled with total internal reflection technique,”
Chem. Soc. Jpn., 60 3811
–3813
(1987). http://dx.doi.org/10.1246/bcsj.60.3811 0369-4208 Google Scholar
N. Harrick, Internal Reflection Spectroscopy, Harrick Scientific Corporation, New York
(1987). Google Scholar
G. PaltaufH. Schmidt-KloiberH. Guss,
“Light distribution measurements in absorbing materials by optical detection of laser-induced stress waves,”
Appl. Phys. Lett., 69
(11), 1526
–1528
(1996). http://dx.doi.org/10.1063/1.117993 APPLAB 0003-6951 Google Scholar
L. Florenset al.,
“A proteomic view of the malaria parasite life cycle,”
in Proc. 50th ASMS Conf. on Mass Spectrometry and Allied Topics,
59
–60
(2002). Google Scholar
T. EganW. MavusoK. Ncokazi,
“The mechanism of beta-hematin formation in acetate solution. parallels between hemozoin formation and biomineralization processes,”
Biochemistry, 40
(1), 204
–213
(2001). http://dx.doi.org/10.1021/bi0013501 BICHAW 0006-2960 Google Scholar
J. A. Viator, Characterization of Photoacoustic Sources in Tissue Using Time Domain Measurements, Oregon Graduate Institute of Science & Technology, Portland, Oregon
(2000). Google Scholar
A. LeungP. M. ShankarR. Mutharasan,
“A review of fiber-optic biosensors,”
Sens. Actuators B. Chem., 125
(2), 688
–703
(2007). http://dx.doi.org/10.1016/j.snb.2007.03.010 0925-4005 Google Scholar
V. Saiet al.,
“Label-free fiber optic biosensor based on evanescent wave absorbance at 280 nm,”
Sens. Actuators B. Chem., 143
(2), 724
–730
(2010). http://dx.doi.org/10.1016/j.snb.2009.10.021 0925-4005 Google Scholar
M. DeGrandpreL. Burgess,
“Long path fiber-optic sensor for evanescent field absorbance measurements,”
Anal. Chem., 60
(23), 2582
–2586
(1988). http://dx.doi.org/10.1021/ac00174a011 ANCHAM 0003-2700 Google Scholar
V. RuddyB. D. MacCraithJ. A. Murphy,
“Evanescent wave absorption spectroscopy using multimode fibers,”
J. Appl. Phys., 67
(10), 6070
–6074
(1990). http://dx.doi.org/10.1063/1.346085 JAPIAU 0021-8979 Google Scholar
P. R. MuessigG. J. Diebold,
“Total internal reflectance optoacoustic spectroscopy,”
J. Appl. Phys., 54
(8), 4251
–4253
(1983). http://dx.doi.org/10.1063/1.332678 JAPIAU 0021-8979 Google Scholar
J. ViatorS. JacquesS. Prahl,
“Depth profiling of absorbing soft materials using photoacoustic methods,”
IEEE J. Sel. Top. Quant. Electron., 5
(4), 989
–996
(1999). Google Scholar
B. ChoiE. D. JansenA. J. Welch,
“Acoustic-based measurements of material absorption coefficients: relationship between laser pulse duration and stress confinement time,”
J. Appl. Phys., 94
(12), 7826
–7831
(2003). http://dx.doi.org/10.1063/1.1627464 JAPIAU 0021-8979 Google Scholar
A. Rosencwaig,
“Photoacoustic spectroscopy,”
Ann. Rev. Biophys. Bioeng., 9 31
–54
(1980). http://dx.doi.org/10.1146/annurev.bb.09.060180.000335 ABPBBK 0084-6589 Google Scholar
|