
|
|
1.IntroductionThe blood-brain barrier (BBB) is a selectively permeable interface that constrains the transmission of substance from cerebral blood vessels to brain tissues. It is mainly composed of tightly attached endothelial cells, a layer of basement membrane, and the end-feet of astrocyte cells [as illustrated in Fig. 1(a)]. When protecting the central nervous system (CNS) from external attacks, the BBB also massively limits the penetration of drugs for cerebral diseases. A recent study even indicates that only 5% of over 7,000 drugs for primarily treating depression, schizophrenia, and insomnia can affect the CNS.1 To overcome this difficulty, nanoparticles—a novel drug delivery system—have long been noticed for penetrating the BBB.2 In this regard, nanotechnology hides the original characteristics of drugs and reduces their leaching in brain tissues3 to achieve a more efficient and safer drug delivery. Fig. 1(a) Experimental procedure of FUS-induced BBB opening and the proposed contrast-enhanced PAM monitoring in a rat model. The injected AuNRs would leak and accumulate at the BBB opening foci after the FUS sonication. (b) TEM image of AuNRs. (c) Absorption spectra of diluted AuNR solution and Evans blue with three different concentrations. 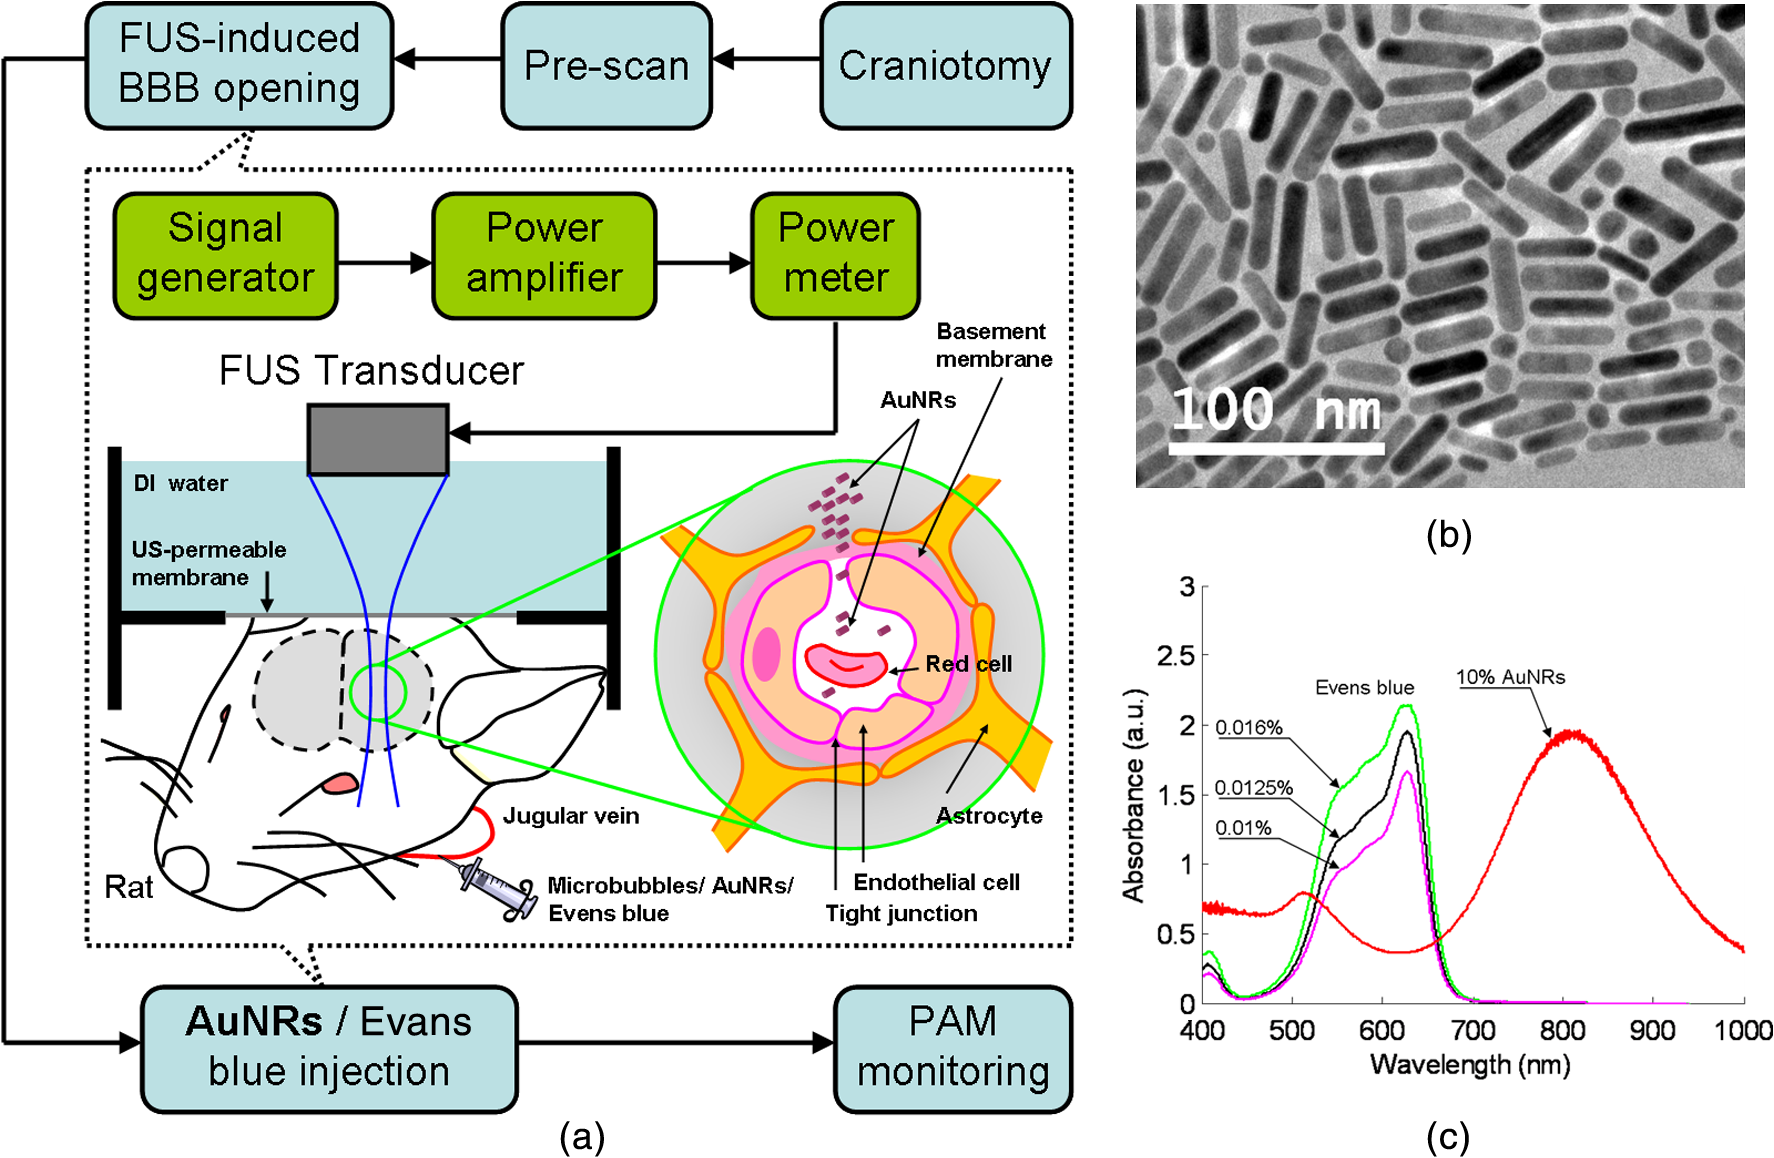 With the involution of focused ultrasound (FUS), which has recently been demonstrated to be able to disrupt BBB locally, temporarily, and invasively.4–8 Nanoparticles offer the feasibility of image-guided local drug delivery for the treatment of CNS diseases such as Alzheimer’s disease,9 brain tumor,10 epilepsy, and Parkinson’s disease.11 In addition, the acoustic intensity needed to disrupt BBB can be reduced by the incorporation of microbubbles.4 The administration of microbubbles ensures minimally thermal damage of brain tissue caused by FUS and consistently focal BBB opening. The current major imaging modality to identify BBB disruption is contrast-enhanced magnetic resonance imaging (MRI); however, its temporal and spatial resolution may still not be good enough to monitor some temporal and localized responses of BBB during the disruption such as transient ischemic attack6 and brain hemorrhage.12 Since there is a trade-off between the spatial resolution and scanning time of MRI, it will be a challenge for MRI to real-time monitor the BBB opening with the target well resolved in space. So imaging modalities offering different contrast with more accurate positioning and shorter scanning time in the monitoring of BBB opening are now desired to provide complementary information to the MRI results. Photoacoustic imaging (PAI)13–15 is a novel imaging modality, which combines excellent optical absorption and good ultrasound spatial resolution for biomedical imaging and also potentially owns real-time imaging capability. Thermal expansion of optical absorbers heated by laser with particular wavelength will lead to an acoustic radiation called photoacoustic wave, then the variation of pressure will be detected by an ultrasonic transducer to form a photoacoustic image. With various kinds of gold nanoparticles16 as contrast agents such as nanoshells,17 nanocages,18 and nanorods,19 PAI provides a unique opportunity to detect blood-vessel leakage. As a member of PAI, photoacoustic microscopy (PAM)14,20,21 has been proven a promising tool for micro-vascular imaging in small animal models.22–24 Gold-nanorods (AuNRs) are rod-shaped gold nanoparticles with excellent biological compatibility due to their gold surface. They have been applied to photothermal therapy of squamous cell carcinoma in mice25 and have also been used as a nano-carrier for remote control of localized gene expression.26 The optical absorption spectrum of AuNRs is dominated by the longitudinal mode of two different surface plasma resonances (SPR), while the transverse component is extremely weak. The strong absorption spectral band caused by longitudinal SPR can be tuned from visible to near-infrared (NIR) range by changing the aspect ratio of AuNRs. When shifting the absorption peak of AuNRs to ca. 800 nm,16 which avoids the strong absorption of blood, one may then obtain a good contrast agent for PAI. In this study, we verify the feasibility of AuNR contrast-enhanced PAM technique for monitoring FUS-induced BBB opening in a rat model in vivo. AuNRs were chosen as a contrast agent because of its extravasation tendency at the FUS-induced BBB opening foci resulting from the nano-scale size. The PAM was employed to monitor on the distribution of administered AuNRs during and after FUS-induced BBB opening. After the BBB was disrupted by FUS, injected AuNRs would passively accumulate in the targeted brain and selectively be excited by a tunable laser source. Then the proposed contrast-enhanced PAM was used to monitor the contrast enhancement caused by AuNRs in brains responding to the changes of BBB permeability. 2.Materials and Methods2.1.Experimental SetupFigure 1(a) shows the whole procedure of FUS-induced BBB opening and the PAM monitoring. First, a high-intensity FUS transducer (diameter: 60 mm, radius of curvature: 80 mm, frequency: 1.5 MHz, electric-to-acoustic efficiency: 70%, Imasonics) driven by the signal generated from an arbitrary function generator (33220A, Agilent) was used to induce the BBB opening in a rat model after the pre-scan of the brain. The FUS excitation signal was amplified by a radiofrequency power amplifier (150A100B, Amplifier Research) and monitored by a power meter (Model 4421, Bird) before feeding into the FUS transducer. During the sonication, the rats were immobilized under a water tank with their head tightly attached to the thin-film window. The ultrasound contrast agents (SonoVue, Bracco) were intravenously injected into the rats to facilitate acoustic cavitation. Since a wide sonication area is also helpful to increase the probability of BBB opening, ultrasound energy was then sequentially delivered into the rat brains at three spots separated within the distance of 2 mm along the longitudinal direction of brains, and the focus was placed at 3 mm under the surface of brains. For each spot, burst-mode ultrasound was used with a burst length of 10 ms, a PRF of 1 Hz, duration of 30 sec, and input electric power of 1 W corresponding to acoustic pressure of 0.48 MPa for safe BBB opening12 avoiding hemorrhage. Second, the injection of AuNRs (9.4 nM and 0.5 ml) followed the FUS sonication. The AuNRs used for this study in Fig. 1(b) were fabricated by the electrochemical method.27 By tuning the averaged dimensions of AuNRs to 40 nm by 10 nm, their absorption peak was shifted to 800-nm wavelength. In addition, polyethylene glycol (PEG) was coated to the surface of AuNRs to increase their biocompatibility, stealth effect to the immune system, and consequently the circulation time in blood stream. After a tenfold dilution, the peak absorbance of AuNR suspension was measured as 2 [Fig. 1(c)] by a spectrophotometer (USB4000-VIS-NIR, Ocean Optics), and that represented a maximum absorbance of 20 for the undiluted one. In the last step, dark-field confocal PAM cooperating with AuNRs was employed for monitoring BBB opening, as shown in Fig. 2. A tunable laser system provided laser pulses with 10-Hz pulse-repetition frequency (PRF), 6.5-ns pulse width, and 800-nm wavelength. In addition to avoiding the strong interference from blood, 800-nm wavelength is also an isosbestic point in absorption spectrum of hemoglobin that we can ignore the effects of blood oxygenation on PAM measurements. The laser light was aligned to be confocal with a 25-MHz focused ultrasonic transducer ( fractional bandwidth: 55%, focal length: 13 mm, v324, Olympus) at 3 mm under the surface of rat brains. The photoacoustic signals received by the transducer were preamplified by a low-noise amplifier (AU-3A-0110, Miteq) and an ultrasonic pulser/receiver (5073PR, Olympus), lowpass filtered (, Mini-Circuits), digitized by a 14-bit A/D card (CompuScope 14200, GaGe), and then stored in the PC. A two-dimensional (2-D) raster scanning covering was performed by a set of piezoelectric motors (HR8 Ultrasonic Motor, Nanomotion) with a step of 120 μm in each direction. The 25-MHz ultrasonic transducer offered resolutions of 68 μm and 171 μm in axial and lateral directions,23,24 respectively. The resolutions are defined by the width of the lateral and axial profiles of an imaged 6-μm carbon fiber. The 2-D PAM raster scanning took about 20 min when a four-time signal averaging was applied on each single scan line to increase the signal-to-noise ratio. Note that for all the following photoacoustic images and quantitative analysis, envelope detection was performed by using Hilbert transform.28 2.2.Animals HandlingAdult male rats () of Sprague Dawley strain with body weight of about 300 g were used for in vivo animal experiments. All experiments were performed in accordance with the regulations of the Laboratory Animal Center of National Tsing Hua University, Taiwan. The rats were initially anesthetized using chlorohydrate () through intraperitoneal (IP) injection before PAM monitoring. A craniotomy was performed on the rats to reduce distortion of the FUS focal beam; moreover it increased the energy delivery of ultrasound and laser. A cranial window () was fashioned with a high-speed drill, and a PE-50 catheter was placed in the jugular vein. The skull defects were covered with saline-soaked gauze to prevent dehydration until the pre-scan was applied. In order to avert photoacoustic interference from extravasated blood on the brain surface, we endeavored to avoid hemorrhage during the craniotomy. The rats were subsequently anesthetized by isoflurane gas anesthesia with a dose of 1% of pure oxygen at flow rate after the administration of AuNRs. The AuNR dosage of used in this study is much lower than the low-toxicity dosage of reported in the literature.29 During the scanning, the rats were immobilized by a custom animal holder with its head attached to the thin film, and warmed by a lamp and constant water temperature to keep their vitality. The incident laser energy density at 800 nm is , which is much smaller than the ANSI safety limit30,31 of , and a layer of acoustic gel was smeared between the thin film and the brain to ensure good coupling of the generated PA waves. The rats were sacrificed after the PAM monitoring for further histological confirmation. 3.Results and DiscussionsTo demonstrate the feasibility of AuNR contrast-enhanced PAM for confirming the region of BBB opening spatially, PEGylated AuNRs (9.4 nM and 0.5 ml) was injected into the rat via the catheter after the sonication applied on the center of the brain. Since physiological section is one of the most accurate methods to confirm the distribution of BBB opening, Evans blue (0.3% and 0.1 ml) was also injected to stain the brain tissues around the BBB opening foci. Because the main absorption region of Evans blue is below 700 nm [Fig. 1(c)], Evans blue can hardly enhance contrast at 800 nm making it distinguishable from AuNRs in PAM. Figure 3(a) and 3(b) show the photoacoustic image of the rat brain outside and inside the FUS sonication area. The brightness of the photoacoustic images represents the intensity of detected photoacoustic envelopes in linear scale. Figure 3(b) shows that there is a local contrast enhancement at the center of the brain caused by the high local concentration of AuNRs, while there is no particular change in Fig. 3(a). The distribution of contrast enhancement in photoacoustic images conforms to the frozen sections of the rat brain stained by Evans blue in Fig. 3(c) and 3(d). The experimental result indicates that AuNR-enhanced PAM can successfully visualize the BBB opening region. Fig. 3Photoacoustic envelope images of the rat brain (a) outside and (b) inside the FUS sonication area. (c) and (d): Evans-blue stained frozen sections corresponding to (a) and (b), respectively. 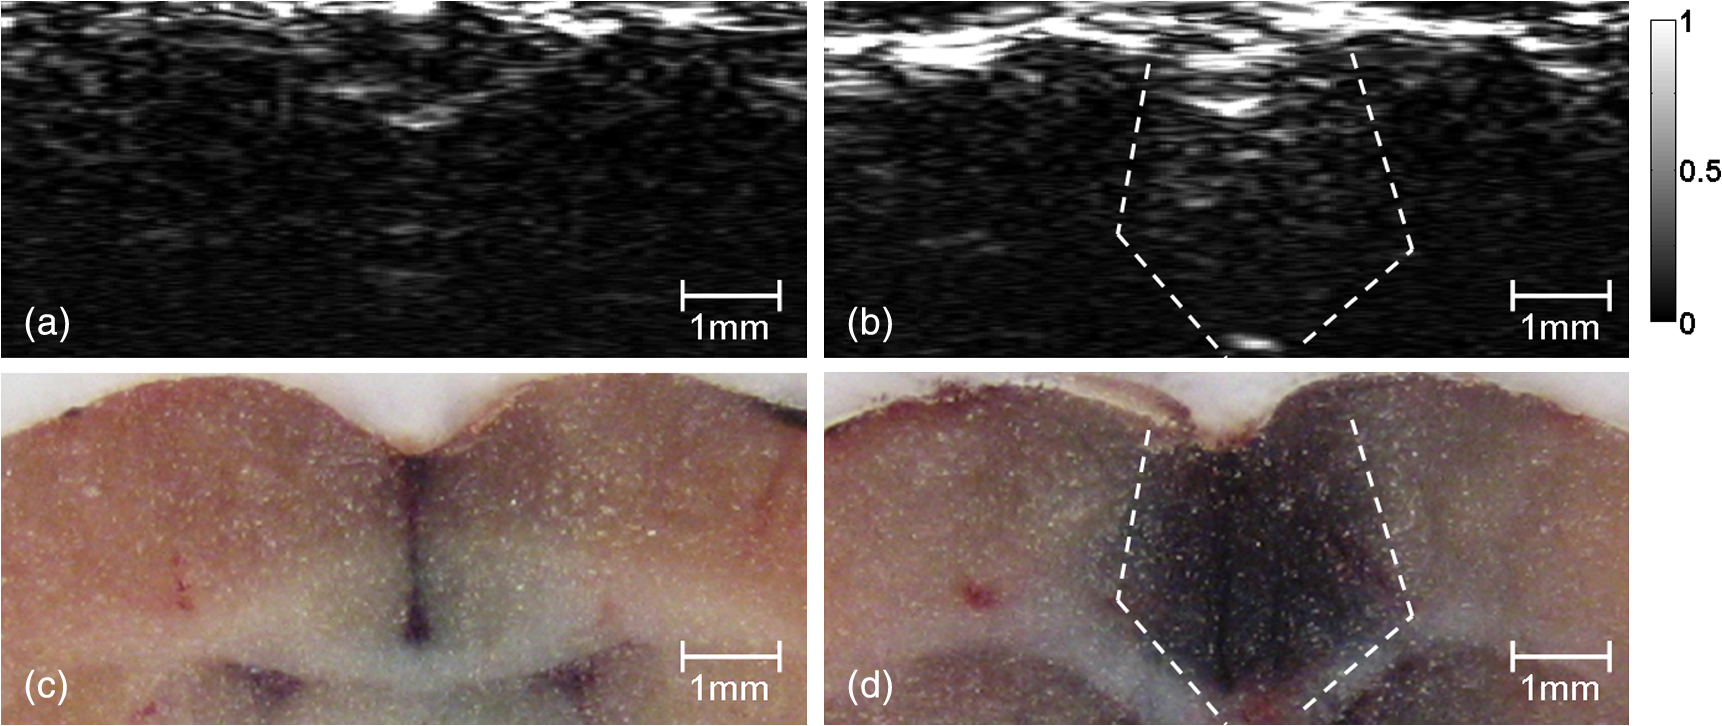 Then, to monitor the temporal response of BBB opening, FUS was performed on the left side of the rat brain. AuNR suspension (9.4 nM and 0.5 ml) was alone injected (i.e., without Evans blue) in this case. Figure 4 shows the sequential photoacoustic envelope images of the brain along the dotted line within the cranial window in Fig. 4(a) in linear scale. Figure 4(a) is the photograph of the brain surface captured after the PA monitoring, and it shows that the sonicated brain tissues cannot be distinguished from normal ones by naked eyes. Figure 4(b) shows the pre-scan image used as a controlled group. Figure 4(c)–4(f) show the photoacoustic images acquired at 28, 51, 80, and 109 min after the FUS sonication respectively. Figure 4(b) and 4(c) identify that an obvious contrast enhancement was profiled in the designed focal path of the FUS after the injection of AuNRs, while there were no observable contrast enhancement in the right-brain as we expected. The enhanced photoacoustic signals in the left brain remained until the end of the two-hour monitoring. Fig. 4(a) Photograph of the sonicated rat brain after two-hour PAM monitoring. (b), (c), (d), (e), and (f): Photoacoustic envelope images of the rat brain acquired at pre-scan, 28, 51, 80, 109 min after the FUS sonication.  To more quantitatively analyze the time-dependent changes in AuNRs leakage into the brain tissue, we sum the values of photoacoustic envelopes within the regions of interest in the brain at each acquiring time. Figure 5 shows the time-intensity curves (TICs) and indicates that there is a rapid increase of 6 dB within 30 min after the FUS sonication. TIC of the right-brain reveals that there is no contrast enhancement in the normal cerebral vessels because the AuNR suspension is diluted by the blood to approximately 1.6% of the original. The effective absorbance of AuNRs decreases to 0.32 in the blood stream of the rats. According to the study of Nanopartz,32 about 90% extinction for AuNRs is caused by the absorption coefficient . Thus AuNRs contributes a negligible of in the blood stream when being compared with the of blood, which is at 800 nm.33 Therefore, the overall optical absorption within the unsonicated area can be regarded as the contribution from the blood. Despite the low concentration of AuNRs in the blood stream, the leakage and accumulation of AuNRs at the BBB opening foci increase the local concentration of AuNRs, which means more optical absorbers in the photoacoustic sample volume. When considering the ideal situation that the intensity of photoacoustic signal is proportional to , the of locally accumulated AuNRs can be approximated to by comparing the signal intensity of accumulated AuNRs to that of blood. Because is proportional to the concentration of the optical absorber, the increase of AuNRs from in the blood stream to at the BBB opening foci also indicates a -fold local increase in the concentration of AuNRs at BBB opening foci, which leads to the contrast enhancement of the left brain in Fig. 4. Although the contrast enhancement in the TIC of left-brain decreases slowly until the end of the monitoring, it does not draw back to the baseline indicated by TIC of the right brain. The result suggests that AuNRs may stick in the brain longer than two hours. It verifies the feasibility of AuNRs for cerebral drug delivery and also provides a unique opportunity to guide the treatment of brain tumor by incorporating AuNR contrast-enhanced PAM into photothermal therapy. 4.ConclusionsIn this study, we verify the feasibility of AuNR contrast-enhanced PAM for monitoring the BBB opening in a rat model in vivo. The contrast enhancement is caused by the high local concentration of AuNRs at BBB opening foci due to the leakage and accumulation of AuNRs after the FUS sonication. Experimental results show that AuNR contrast-enhanced PAM successfully reveals the spatial distribution and temporal responses of BBB disruption area in the rat brains. The quantitative measurement of contrast enhancement has potential to estimate the local concentration of AuNRs and even the dosage of therapeutic molecules when AuNRs are further used as nano-carriers for drug delivery or photothermal therapy.34,35 The photoacoustic results also provide complementary information to MRI, which is helpful to discover more details about BBB opening in small animal models. AcknowledgmentsWe are grateful to Yuan-Jen Tsai from National Chung Cheng University, Taiwan, for preparing the gold nanorods. This project is supported partially by National Science Council, Taiwan (NSC 97-2221-E-007-084-MY3, NSC 98-2218-E-182-008-, NSC 99-2218-E-182-002-, NSC 100-2218-E-182-001-) and National Tsing Hua University, Taiwan (Boost Program 98N2531E1 and NTHU-CGMH program 99N2428E1). ReferencesA. K. GhoseV. N. ViswanadhanJ. J. Wendoloski,
“A knowledge-based approach in designing combinatorial or medicinal chemistry libraries for drug discovery. 1. A qualitative and quantitative characterization of known drug databases,”
J. Comb. Chem., 1
(1), 55
–68
(1999). http://dx.doi.org/10.1021/cc9800071 1520-4766 Google Scholar
S. Bhaskaret al.,
“Multifunctional nanocarriers for diagnostics, drug delivery and targeted treatment across blood-brain barrier: perspectives on tracking and neuroimaging,,”
Particle and Fibre Toxicology, 7
(3), 1
–25
(2010). 1743-8977 Google Scholar
P. R. Lockmanet al.,
“Nanoparticle technology for drug delivery across the blood brain barrier,”
Drug. Dev. Ind. Pharm., 28
(1), 1
–13
(2002). http://dx.doi.org/10.1081/DDC-120001481 DDIPD8 0363-9045 Google Scholar
K. Hynynenet al.,
“Noninvasive MR imaging-guided focal opening of the blood–brain barrier in rabbits,”
Radiology, 220
(3), 640
–646
(2001). http://dx.doi.org/10.1148/radiol.2202001804 RADLAX 0033-8419 Google Scholar
K. Hynynenet al.,
“Noninvasive opening of BBB by focused ultrasound,”
Acta. Neurochir. Suppl., 86 555
–558
(2003). http://dx.doi.org/10.1007/978-3-7091-0651-8 ANCSBM 0065-1419 Google Scholar
K. Hynynenet al.,
“Local and reversible blood-brain barrier disruption by noninvasive focused ultrasound at frequencies suitable for trans-skull sonications,”
NeuroImage, 24
(1), 12
–20
(2005). http://dx.doi.org/10.1016/j.neuroimage.2004.06.046 NEIMEF 1053-8119 Google Scholar
N. McDannoldet al.,
“MRI-guided targeted blood-brain barrier disruption with focused ultrasound: histological findings in rabbits,”
Ultrasound Med. Biol., 31
(11), 1527
–1537
(2005). http://dx.doi.org/10.1016/j.ultrasmedbio.2005.07.010 USMBA3 0301-5629 Google Scholar
A. H. Mesiwalaet al.,
“High-intensity focused ultrasound selectively disrupts the blood-brain barrier in vivo,”
Ultrasound Med. Biol., 28
(3), 389
–400
(2002). http://dx.doi.org/10.1016/S0301-5629(01)00521-X USMBA3 0301-5629 Google Scholar
S. B. Raymondet al.,
“Ultrasound enhanced delivery of molecular imaging and therapeutic agents in Alzheimer’s disease mouse models,”
PLoS ONE, 3
(5), 1
–7
(2008). http://dx.doi.org/10.1371/journal.pone.0002175 1932-6203 Google Scholar
L. H. Treatet al.,
“Targeted delivery of doxorubicin to the rat brain at therapeutic levels using MRI-guided focused ultrasound,”
Int. J. Cancer, 121
(4), 901
–907
(2007). http://dx.doi.org/10.1002/(ISSN)1097-0215 IJCNAW 1097-0215 Google Scholar
F. A. JoleszN. McDannold,
“Current status and future potential of MRI-guided focused ultrasound surgery,”
J. Magn. Reson. Im., 27
(2), 391
–399
(2008). http://dx.doi.org/10.1002/(ISSN)1522-2586 1053-1807 Google Scholar
H.-L. Liuet al.,
“Magnetic resonance imaging enhanced by superparamagnetic iron oxide particles: usefulness for distinguishing between focused ultrasound-induced blood-brain barrier disruption and brain hemorrhage,”
J. Magn. Reson. Im., 29
(1), 31
–38
(2009). http://dx.doi.org/10.1002/jmri.v29:1 1053-1807 Google Scholar
H. F. Zhanget al.,
“Functional photoacoustic microscopy for high-resolution and noninvasive in vivo imaging,”
Nat. Biotechnol., 24
(7), 848
–851
(2006). http://dx.doi.org/10.1038/nbt1220 NABIF9 1087-0156 Google Scholar
L. V. Wang,
“Tutorial on photoacoustic microscopy and computed tomography,”
IEEE J. Sel. Top. Quant., 14
(1), 171
–179
(2008). http://dx.doi.org/10.1109/JSTQE.2007.913398 IJSQEN 1077-260X Google Scholar
M.-L. Liet al.,
“Simultaneous molecular and hypoxia imaging of brain tumors in vivo using spectroscopic photoacoustic tomography,”
P. IEEE, 96
(3), 481
–489
(2008). http://dx.doi.org/10.1109/JPROC.2007.913515 IEEPAD 0018-9219 Google Scholar
X. Yanget al.,
“Nanoparticles for photoacoustic imaging,”
WIREs Nanomed. Nanobiotechnol., 1
(4), 360
–368
(2009). http://dx.doi.org/10.1002/wnan.42 1939-5116 Google Scholar
M.-L. Liet al.,
“In vivo photoacoustic microscopy of nanoshell extravasation from solid tumor vasculature,”
J. Biomed. Opt., 14
(1), 010507-1
–010507-3
(2009). http://dx.doi.org/10.1117/1.3081556 JBOPFO 1083-3668 Google Scholar
W. Liet al.,
“Gold nanocages as contrast agents for photoacoustic imaging,”
Contrast Media Mol. Imaging, 6
(5), 370
–377
(2011). http://dx.doi.org/10.1002/cmmi.439 1555-4309 Google Scholar
Y.-S. Chenet al.,
“Silica-coated gold nanorods as photoacoustic signal nanoamplifiers,”
Nano Lett., 11
(2), 348
–354
(2011). http://dx.doi.org/10.1021/nl1042006 NALEFD 1530-6984 Google Scholar
K. MaslovG. StoicaL. V. Wang,
“In vivo dark-field reflection-mode photoacoustic microscopy,”
Opt. Lett., 30
(6), 625
–627
(2005). http://dx.doi.org/10.1364/OL.30.000625 OPLEDP 0146-9592 Google Scholar
M.-L. Liet al.,
“Improved in vivo photoacoustic microscopy based on a virtual-detector concept,”
Opt. Lett., 31
(4), 474
–476
(2006). http://dx.doi.org/10.1364/OL.31.000474 OPLEDP 0146-9592 Google Scholar
H. F. Zhanget al.,
“Imaging of hemoglobin oxygen saturation variations in single vessels in vivo using photoacoustic microscopy,”
Appl. Phys. Lett., 90
(5), 053901-1
–053901-3
(2007). http://dx.doi.org/10.1063/1.2435697 APPLAB 0003-6951 Google Scholar
L.-D. Liaoet al.,
“Imaging brain hemodynamic changes during rat forepaw electrical stimulation using functional photoacoustic microscopy,”
NeuroImage, 52
(2), 562
–570
(2010). http://dx.doi.org/10.1016/j.neuroimage.2010.03.065 NEIMEF 1053-8119 Google Scholar
P.-H. Wanget al.,
“In vivo photoacoustic micro-imaging of microvascular changes for Achilles tendon injury on a mouse model,”
Biomed. Opt. Express, 2
(6), 1462
–1469
(2011). http://dx.doi.org/10.1364/BOE.2.001462 BOEICL 2156-7085 Google Scholar
E. B. Dickersonet al.,
“Gold nanorod assisted near-infrared plasmonic photothermal therapy (PPTT) of squamous cell carcinoma in mice,”
Cancer Lett., 269
(1), 57
–66
(2008). http://dx.doi.org/10.1016/j.canlet.2008.04.026 CALEDQ 0304-3835 Google Scholar
C.-C. Chenet al.,
“DNA-gold nanorod conjugates for remote control of localized gene expression by near infrared irradiation,”
J. Am. Chem. Soc., 128
(11), 3709
–3715
(2006). http://dx.doi.org/10.1021/ja0570180 JACSAT 0002-7863 Google Scholar
Y.-Y. Yuet al.,
“Gold nanorods-electrochemical synthesis and optical properties,”
J. Phys. Chem., 101
(34), 6661
–6664
(1997). http://dx.doi.org/10.1021/jp971656q JPCHAX 0022-3654 Google Scholar
T. L. Szabo, Diagnostic Ultrasound Imaging: Inside Out, Elsevier Academic Press, Burlington, MA
(2004). Google Scholar
A. Kopwitthayaet al.,
“Biocompatible PEGylated gold nanorods as colored contrast agents for targeted in vivo cancer applications,”
Nanotechnology, 21
(31), 315101-1
–315101-10
(2010). http://dx.doi.org/10.1088/0957-4484/21/31/315101 NNOTER 0957-4484 Google Scholar
D. A. Nedosekinet al.,
“In vivo ultra-fast photoacoustic flow cytometry of circulating human melanoma cells using near-infrared high-pulse rate lasers,”
Cytometry Part A, 79A
(10), 825
–833
(2011). http://dx.doi.org/10.1002/cyto.a.v79a.10 1552-4922 Google Scholar
American National Standard for the Safe Use of Lasers. ANSIZ136.1-2007, American National Standards Institute, Washington, DC
(2007). Google Scholar
Nanopartz Inc.,
“Technical Note 802: photothermal characteristics of gold nanorods,”
1
–7
(2008). Google Scholar
D. J. Faberet al.,
“Oxygen saturation-dependent absorption and scattering of blood,”
Phys. Rev. Lett., 93
(2), 028102-1
–028102-4
(2004). http://dx.doi.org/10.1103/PhysRevLett.93.028102 PRLTAO 0031-9007 Google Scholar
H. Hirschberget al.,
“Photothermal ablation of malignant brain tumors by nanoparticle loaded macrophages,”
Proc. SPIE, 7883 78833U
(2011). http://dx.doi.org/10.1117/12.876224 PSISDG 0277-786X Google Scholar
J. A. Schwartzet al.,
“Nanoparticle-assisted photothermal ablation of brain tumor in an orthotopic canine model,”
Proc. SPIE, 7161 716130
(2009). http://dx.doi.org/10.1117/12.808334 PSISDG 0277-786X Google Scholar
|


