
|
|
1.IntroductionRetinal laser coagulation is the gold standard for treatment of peripheral ischemic retinal diseases such as diabetic retinopathy, ischemia due to vein occlusion and other conditions.1–4 It is for treating macular edema as well.5 The selection of the exposure time and spot diameter laser parameters is based on the treatment indication, and the power is determined by the ophthalmoscopic evaluation of the appearance of the lesions in size and strength after treatment. Due to local pigmentation variations up to a factor of two in the retinal pigment epithelium (RPE) and of three in the choroid6,7 and strong age-related variations of the light transmittance through the ocular media,8 the same laser parameters lead to different temperature developments, which can result in unnecessarily strong lesions. Sometimes, even complications like tissue rupture and bleeding occur. Furthermore, retinal photocoagulation is painful for the patient. Reducing the risk of overtreatments and reducing pain are major goals in improving the reliability of photocoagulation therapy. The need for an objective measurement of the denaturation effect and real-time laser exposure control was already recognized decades ago.9 However, a real-time temperature dosage of retinal laser treatment could not yet be established in clinical applications. Invasive measurements of the retinal temperature with thermocouples were performed on anesthetized rabbits10 but are not applicable in human patients. Other methods like magnetic resonance imaging (MRI) are still too slow, and co-application with photocoagulation is not feasible on patients.11 One non-invasive approach is to measure the onset of denaturation by reflectometry.12,13 The coagulation leads to an increased back-scattering of the treatment light from the retinal layers, which could be used as a criterion for controlling the treatment. However, the movements of the patient’s eye and of the hand-held contact lens disturb the measurement of the small amount of back-scattered light. Hence, the application of this method in vivo turned out to be too motion sensitive. Optoacoustics afford non-invasive and real-time detection of tissue coagulation14 and real-time monitoring of tissue temperature.15 The feasibility of the temperature rise measurement was demonstrated on fundus explants16 and for transpupillar thermotherapy,17 but it is also applicable for retinal laser coagulation. Extensive temperature measurements on porcine eyes ex vivo and rabbit eyes in vivo were performed,18 and recently the first data on patients were acquired.19 The aim of this work is the development of an automatic photocoagulation control in order to achieve lesions of uniform size, reduce treatment time and minimize the risk of overtreatment by analyzing the retinal temperature development in real-time. 2.Methods2.1.Optoacoustic Temperature MeasurementsFor optoacoustic pressure generation, probe laser pulses are applied additionally to the treatment irradiation onto the treated ocular fundus area. Due to the temperature dependence of the material specific Grüneisen parameter , the temperature of the absorber, which in this case is the RPE, can be determined indirectly by measuring the amplitude increase of the excited pressure waves detected at the corneal surface. The Grüneisen parameter depends on the speed of sound , the heat capacity and the thermal expansion coefficient , which is dependent on the density ,20 and is given in Eq. (1). According to Ref. 17, the optoacoustically measured temperature of a uniformly heated absorber can be expressed as Eq. (2), where is the amplitude of the pressure wave, is the energy of the probe laser pulse, and and are tissue-specific parameters. The proportionality constant is individual for each coagulation site and collects tissue-specific variables such as light transmittance through the ocular media, fundus pigmentation grade, attenuation of the pressure waves within the eye and receiving characteristics of the transducer.The tissue-specific parameters and were determined experimentally. The temperature development was measured with thermocouples and by optoacoustics simultaneously, while the fundus tissue was heated by infrared irradiation.19 For porcine eyes the following values were obtained: and . Similar values were found in calibration measurements on rabbit fundus explants that were heated in a water-filled cuvette:17 and . The differences of the values of both calibration measurements are most likely due to the different heating methods and the limited accuracy, because these parameters cannot be measured directly. The value of was evaluated for each coagulation site by applying probe laser pulses just before starting the heating process with the treatment laser. When probing the tissue prior to local heating, is the temperature of the fundus tissue, which is body temperature in vivo. Thus Eq. (2) can then be solved for . If is measured, is unequivocally determined. Consequently, all parameters are known for the individual site. When heating starts, can be determined according to Eq. (2). 2.2.Spatial and Temporal Temperature DistributionThe laser-induced temperature increase in the fundus tissue during photocoagulation is not homogeneous in space and time. This is due to the exponential attenuation due to absorption of the laser energy within different fundus layers according to the Lambert–Beer Law and thermal diffusion. The temperature distribution during laser irradiation can be calculated by solving the heat diffusion equation with an appropriate fundus model. The changes in temperature elevation and time depend on the heat supply by absorbed laser radiation and can be described as Eq. (3), where is the fundus depth in , is the lateral distance in m, is the absorption coefficient in , is the density in , is the thermal diffusivity in , is the heat capacity in , and is the irradiance in .Within this work, Eq. (3) was solved for photocoagulation induced by a top hat beam profile onto a homogeneous and infinite tissue in lateral direction with isotropic heat conduction. Table 1 shows the rabbit fundus layer thicknesses (taken from Ref. 21) and the absorption coefficients (taken from Ref. 22), which were used for the eye model. Light scattering was neglected. The heat diffusion equation can be solved in Cartesian coordinates by the error function. The solution is described in detail by Birngruber.21,23 The overall temperature distribution is calculated by adding of individual distributions of the absorbing layers which are the RPE and the pigmented choroid. The probe laser pulses are absorbed in a cylindrical volume with the same radius as the treatment laser beam and have a non-isotropically tempered volume with transiently changing temperature distribution. Thus, optoacoustics probes a mean depth weighted temperature profile. It is laterally averaged over the beam profile and axially weighted with the exponentially decreasing energy dissipation of the probe laser light in the tissue. However, to analyze the onset of tissue denaturation, the maximum temperature in the center of the spot and on top of the RPE is of most importance. A heat diffusion model was used to evaluate the ratio between the weighted mean volume temperature , which correlates with the optoacoustically measured temperature, and maximum temperature . A distinct correlation curve between the peak temperature and the mean volume temperature can be derived, which is given in Eq. (4) and described in detail in Ref. 19. The function depends on the spot size, the heating time, and the ratio of pigmentation in the different fundus layers, but not of the overall absorption.19 The conversion function that is used in this work for the rabbit fundus model and a spot diameter of 130 µm is shown in Fig. 1.Fig. 1The calculated conversion function between the measured mean temperature increase and the maximum temperature increase at the center of the spot on the surface of the RPE for a rabbit fundus and a spot diameter of 130 µm. 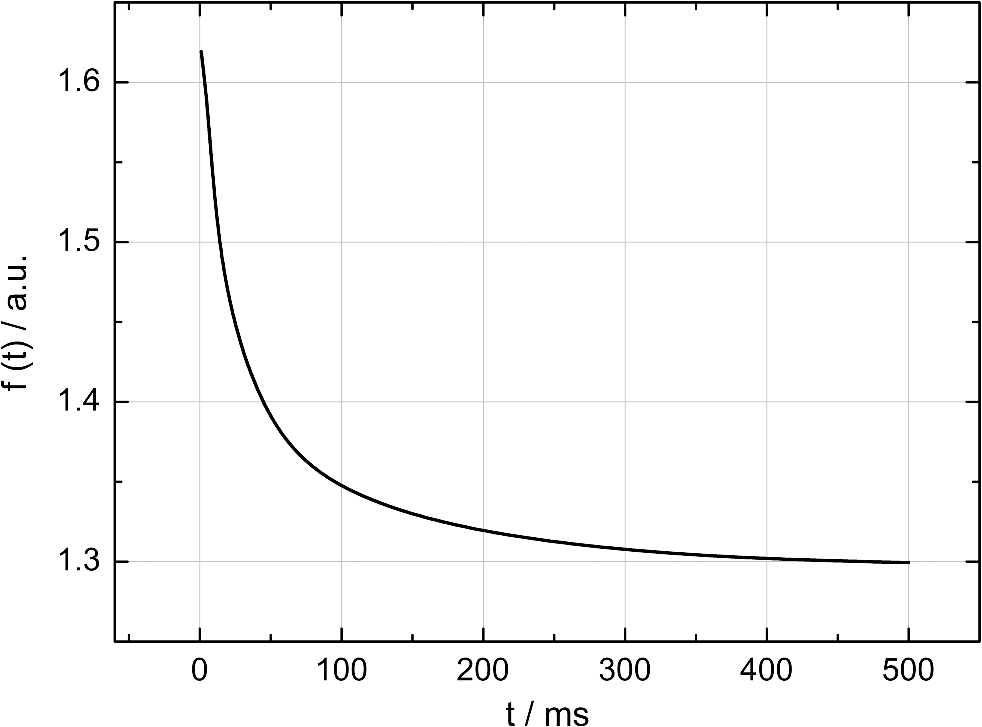 Table 1
The correlation between the measured mean temperature increase and the maximum temperature can be approximated by an exponential decay fit in dependence of the irradiation time , which is given in Eq. (5). The fit parameters for the conversion function shown in Fig. 1 are , , , and .2.3.Threshold DeterminationThe onset of tissue denaturation can be described as a function of temperature and heating time using the thermal damage model from Arrhenius.21,24 The damage integral can be taken as a measure for the thermal damage and is defined in Eq. (6), where is a dimensionless damage index, is the frequency factor in , is the activation energy in , is the temperature in K, is the heating time in s, is the universal gas constant in .In tissues, the damage definition depends on an observed criterion. In this work is defined for the temperature that produces an ophthalmoscopically visible coagulation about one hour after laser treatment with a probability of 50% (ED50). Therefore, the frequency factor and the activation energy cannot be determined independently. They reflect the correlated time and temperature dependence required for the onset of tissue denaturation. The time-dependent temperature threshold for the onset of retinal coagulation can be determined by applying different laser powers around the lesion visibility threshold at different constant irradiation times. The ED50 threshold of lesion formation for a certain combination of temperature and irradiation time can then be evaluated by probit analysis.25 2.4.Feedback Laser ControlThe algorithm implemented in LabVIEW monitors the temperature increase at 1 kHz during laser heating and stops the treatment laser within one millisecond, if the measured temperature exceeds a previously determined threshold. 2.5.SetupThe experimental setup is shown in Fig. 2. The light pulses of a frequency-doubled Q-switched Nd:YLF laser (QC-523-1000, 523 nm, 75 ns, 1 kHz, CrystaLaser) are used for acoustic pressure wave generation. A frequency-doubled continuous wave Nd:YAG laser (VISULAS® 532s, 532 nm, Carl Zeiss Meditec AG) is used for photocoagulation. Both laser beams were superimposed and coupled into a fiber with a core diameter of 50 µm and numerical aperture (NA) of 0.11. The fiber was connected to a laser slit lamp (LSL 532s, Carl Zeiss Meditec AG). The irradiation was applied onto the fundus through a laser contact lens (Mainster Focal Grid, Oculus Instruments) with an embedded annular piezoceramic ultra-sonic transducer (PZT) with high sensitivity in the MHz frequency range (Medical Laser Center Lübeck, Germany). The optoacoustic signals from the transducer were recorded by a computer oscilloscope card (CompuScope 8347, Gage Applied Technologies). Further data processing and control of the irradiation time was performed by a self-programmed LabVIEW routine. A small amount of the probe laser pulse energy is reflected onto a photo diode (FND 100) and used as measurement trigger. When the treatment starts, 20 to 100 probe pulses are applied onto the fundus area prior to the continuous wave (CW) laser heating process in order to evaluate the proportionality constant described in Sec. 2.1. The treatment laser starts after this calibration. In case of automatic dosage control, the treatment laser will be stopped if the LabVIEW routine detects a temperature equal or higher than the defined threshold temperature for coagulation. 2.6.Animal Experiments on Rabbits In VivoThe experiments on rabbits in vivo were carried out according to the German law for protection of animals, approved by the Ministry of Agriculture, the Environment and Rural Areas of Schleswig-Holstein, Kiel, Germany. The rabbits were anesthetized before the measurement using ketamine (10%, 0.5 to ) and xylazine (2%, 0.2 to ) applied intramuscularly. They were fixed in a special holding device and positioned in front of the slit lamp. Phenylephrin (5%) eye drops were used to dilate the pupils and oxybuprocaine (0.4%) eye drops for local anesthesia of the cornea. The modified contact lens was fixed onto the rabbit’s cornea using a custom holder. Hypromellose gel (2%) was used as a contact agent for optical and acoustical adaption of contact lens and cornea. The body temperature was measured rectally. Retinal temperature measurements were performed on 8 rabbits, with 100 to 200 applications per eye. Images of the laser lesions were taken one hour after treatment by a fundus camera (VISUCAM®, Carl Zeiss Meditec AG). A scaling factor of 0.66 was used to calculate the retinal laser spot size, because the laser beam diameter is demagnified in the rabbit eye.26 Lesion diameters were evaluated by digitally cutting out the whitened area from the fundus images. The pixels of these whitened areas were semi-automatically counted by ImageJ software. The scaling factor between fundus image pixels and distance on rabbit’s retina was obtained by applying marker lesions with a defined center-to-center distance of 650 µm. Due to the optical inhomogeneities of the rabbit fundus, the inaccuracy of lesion diameter evaluation was assumed to be approximately . 3.Results3.1.Determination of the TemperaturesThe optoacoustic pressure amplitudes during laser heating were converted into temperatures according to Eq. (2). The maximum temperature at the center of the spot on the surface of the RPE was then calculated according to Eqs. (4) and (5). An exponential approach was used for fitting the experimental data to avoid inaccuracies due to noise. For this purpose the heat diffusion equation according to Sec. 2.2 for a rabbit fundus and a spot diameter of 130 µm was solved for the location of the peak temperature (center beam at the RPE). The resulting temperatures scale linearly with the laser power, thus temperature curves differ only by a proportionality factor. The experimental data were fitted with the theoretical temperature curve, using the proportionality factor as the free fit parameter. The maximum temperature at the end of the irradiation time was evaluated as the maximum value of the fit curve. Temperature curves and the corresponding fits are exemplarily shown in Fig. 3. The measured temperatures do not scale with the adjusted laser power because of variations in pigmentation. 3.2.Time-Temperature-Correlation for the Threshold of Ophthalmoscopical VisibilityThe time-dependent temperature threshold for the onset of a visible coagulation was determined by applying different laser powers below and above the ophthalmoscopical threshold at chosen irradiation times. Figure 4 shows a plot of the visibility (, ) over the temperatures at the end of irradiation, . The probit function was applied to these data. The resulting curve allows prediction of the necessary maximum temperature required for a given irradiation time to produce a mild lesion at a probability of 50% (ED50) or 95% (ED95), respectively. About 200 applications were performed for each irradiation time to collect enough data for statistical threshold determinations. As an example, a probit analysis for the 200 ms irradiation time and a laser spot diameter of 130 µm for rabbit eyes is shown in Fig. 4. The resulting time-dependent ED50 and ED95 temperature threshold pattern is shown in Fig. 5. In principle, they resemble the characteristics of the Arrhenius curve with higher end temperatures towards shorter irradiation times. Fig. 4Probit analysis for about 200 irradiations with different laser powers at a constant irradiation time of 200 ms in rabbit eyes in vivo (laser spot diameter 130 µm, ). Visibility was evaluated one hour post treatment.  Fig. 5Evaluated ED50 and ED95 temperature threshold values for the formation of ophthalmoscopically visible lesions (laser spot diameter 130 µm, ).  In order to extract the Arrhenius parameter from the experimental data, the time independent activation energy was obtained from these data by using the heat diffusion model. The power at the retina is unknown in the experiment due to the unknown transmittance of the individual eye. Thus, the power was varied in the model until the end temperature of calculated temperature rise matched the experimentally obtained end temperature. Using these temperature curves, Eq. (6) was solved for to find for each irradiation time. Since ought to be time independent, the mean value of the at the different irradiation times was calculated. Because the frequency factor cannot be determined independently, the frequency factor was taken from Ref. 21 and held constant. The activation energy is the parameter of more impact on the Arrhenius curve; a change of one magnitude in the frequency factor leads to a change of the activation energy of only about 2%. The activation energy was then determined to . The Arrhenius fit can be seen in Fig. 6. The thresholds determined with the Arrhenius parameters proposed by Birngruber et al. are plotted for comparison.21 Fig. 6Empirical maximum temperatures at the end of irradiation for several irradiation time steps, which had a 50% chance to produce an ophthalmoscopically visible lesion (ED50), based on about 200 applications each (laser spot diameter 130 µm, ). The Arrhenius fit (dashed line) was obtained from these data. The solid line is the Arrhenius fit as published by Birngruber et al.21  3.3.Automatic Laser Dosage ControlIt is the goal of the automatic laser dosage control to achieve uniform lesion extensions that are widely independent of the laser power, transmission and local pigmentation. The first approach was to stop the treatment laser after a certain temperature had been achieved. We developed empirically two algorithms in order to produce lesions with homogeneous diameters close to the adjusted laser spot diameter. The first algorithm produces mild lesions that appear one hour post treatment, and the second one produces stronger lesions that are visible immediately. The characteristic curves for the automatic control and the subsequent measured end temperatures can be seen in Fig. 7. Fig. 7Optoacoustically measured end temperatures (dots) during automatic irradiation time control and temperature thresholds (lines) for mild (black/solid) and strong (grey/dashed) lesions.  Lesions that were produced using the automatic switch-off algorithm for mild lesions are shown in the fundus image on the left side in Fig. 8 inside the solid frames. Although the laser power was varied, the lesions generated by the automatically controlled treatment time appear uniform in size and strength. As expected, the irradiation times generally decreased if the laser power was increased. However, an oppositional effect occurred in many spots where powers were close together. This can be seen in the irradiation times in column VI of Fig. 8. The irradiation times in this column are mostly about half of the irradiation times of the other columns. In contrast, laser power was constant in every row, and the ophthalmoscopical occurrence of all lesions inside the solid frames is the same. This shows that the switch-off algorithm takes the local variations in pigmentation grade into account. Fig. 8Lesions produced with constant irradiation time and lesions produced with the automatic irradiation time control on rabbit eyes in vivo. The laser power is constant in every row. The lesions marked by an are marker lesions, which allow mapping of the spots after treatment. The lesions in the columns within the solid frames are produced by the automatic treatment control for mild lesions. The columns within the dotted frames are applied with a constant irradiation time of 100 ms. 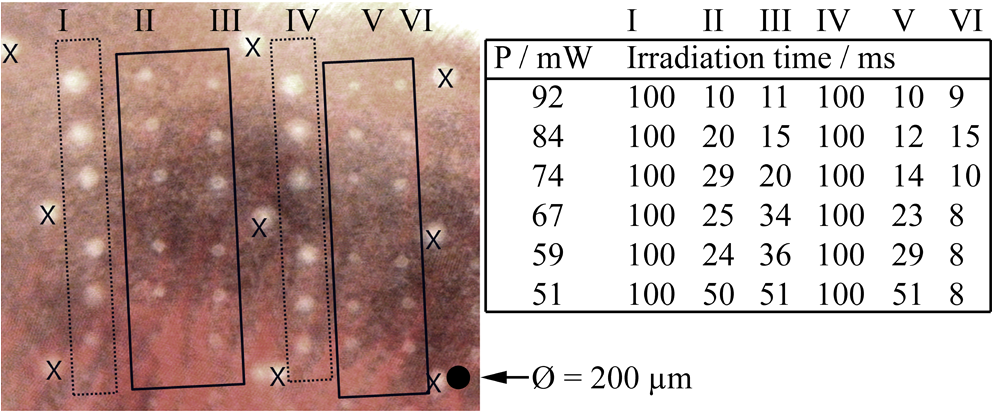 The evaluation of the lesion diameters is shown in Fig. 9. The lesion sizes increased linearly with increasing laser power, if the treatment time was constant. In contrast, the lesions produced with automatically controlled irradiation times are almost constant in size, although the laser power varied from 14 mW to 316 mW. Fig. 9Evaluation of the lesion sizes with and without automatic treatment control on rabbit eyes in vivo. The ED50 power threshold for visible lesion formation during 200 ms irradiation time is .  Irradiations with the 200 ms irradiation time were only applied with laser powers below 200 mW, because higher powers would lead to rupture and bleeding. These unwanted effects could be avoided completely by automatic control even for laser powers higher than 200 mW. The lesions produced with the automatic control for mild lesions have a mean diameter of 162.1 µm with a standard deviation of 34.2 µm. The automatically controlled strong lesions have a mean diameter 188.9 µm with a standard deviation of 34.4 µm. Although there is a very slight increase of the lesion sizes with power, they are much more stable than the lesions produced with a constant irradiation time, which have a slope of (). 4.Discussion4.1.Temperatures at Coagulation ThresholdFor the first time, optoacoustics enabled us to measure temperatures non-invasively during retinal photocoagulation and without alteration of the established clinical treatment procedure. It was discovered during heating of the eye globe with infrared laser irradiation and temperature measurement by thermocouples that a visible denaturation of the retina did not occur at temperatures below 53°C. However, during photocoagulation the ED50 lesion formation threshold temperatures were partly below 53°C for irradiation times longer than 200 ms, as can be seen in Fig. 6. This might be due to an error in the conversion function, which is caused by an inaccurate assumption of the absorption ratios of RPE and choroid in the thermal model. Furthermore, the lesions close to the threshold have a milder appearance for longer irradiation times, so they have most likely a different degree or type of tissue damage. Compared to measurements of the retinal temperatures during photocoagulation with thermocouples on rabbits in vivo,10 the optoacoustically measured temperatures are significantly lower. This is also reflected in the Arrhenius parameters. The comparison can be seen in Fig. 6. The reason for these disagreements might be the subjective judgment of the observed threshold criterion. Furthermore, ophtalmoscopical whitening is caused by different tissue effects that cannot be unequivocally differentiated from the fundus image. A core zone appears immediately after irradiation and represents thermal necrosis. It is surrounded by a zone of denaturation, which takes up to 24 h to fully evolve. Finally, lesions may be accompanied by an often asymmetric zone of edema which usually develops within 10 min after application.27 The evaluation and differentiation of each of these components of whitening is not standardized, leaving a significant oberserver-dependence to the judgement of a fundus lesion. It has been shown that histological lesion diameters are smaller than diameters of ophthalmoscopical whitening, which is another clue to the difficulty of valid lesion assessment by the fundus image.28 The resulting subjectively varying threshold criteria may account for different Arrhenius parameters and threshold temperatures found by different researchers. In a study by Denton et al., similarly low temperatures were found by measuring the threshold temperature of thermal cell damage on fundus explants with a thermal camera. They found a constant end temperature of for irradiation times between 1 ms and 1 s.29 This fits quite well to the range of our data, although we found a time dependence of the threshold temperatures in our experiments. This dependence and the absolute temperatures are confirmed by Sramek et al.,30 who used re-evaluated Arrhenius parameters in their calculations (). They computed an RPE damage threshold of 53°C at 200 ms irradiation time and above 70°C at 1 ms. 4.2.Automatic Dosage ControlFigure 9 shows that for a constant irradiation time, the lesions grew almost linearly with the treatment laser power. This simple correlation was also shown in other works.28 If the irradiation time was controlled automatically by the switch-off algorithm, the lesions had a homogeneous diameter that was nearly independent of the treatment laser power and similar to the adjusted laser spot diameter of 130 µm. The optoacoustic retinal temperature calculation is limited by physical tissue alterations during photocoagulation. The optical parameters of the fundus tissue layers change after the onset of coagulation,31 leading to a different absorption profile of treatment and probe laser irradiation and therefore to a different temperature distribution. In this case, the previously obtained calibration of pressure amplitude and temperature is not valid any longer. In spite of this limitation, the accuracy of the optoacoustic method is sufficient for temperature measurements on mild lesions, where physical tissue properties remain unchanged, and for temperature feedback treatment control that relies on optoacoustic data obtained early during irradiation, before tissue alterations have set in. This change of the tissue parameters has been used by Larin et al. to detect the onset of coagulation optoacoustically.14 Theoretically, this approach could also be used as a feedback control for the treatment laser. However, in the study of Larin et al. the probe laser had a wavelength of 1064 nm. With our probe wavelength of 523 nm, a prominent rise in the optoacoustic amplitude after coagulation could not be observed. Instead, a plateau or decrease of the pressure amplitude was observed for lesions with very strong whitening, but not for the kind of lesions that were applied in this study. We assume that the spectral absorption and scattering coefficient changes due to coagulation are different for these wavelengths. Furthermore, a probe wavelength of 1064 nm has some disadvantages in the eye. The signal-to-noise ratio is lower due to the smaller absorption in the RPE. Moreover, it would be necessary to build a highly achromatic contact lens, otherwise the probe laser spot would shift away from the treated area during panretinal treatment. It was shown that automatic irradiation time control can be used to generate different lesion strengths with the same laser power. The irradiation times were longer when the desired lesion type was stronger. The observed variations in the irradiation time from this general trend were most likely due to variations in fundus pigmentation distribution. Experiments on porcine eyes ex vivo have confirmed the assumption, that different lesion sizes can be produced by our method as well.32 Laser treatment control by an automatic irradiation time control is only possible within a certain time window. In principle, the Arrhenius theory describes a certain probability of denaturation at a given temperature for any given time. But the time of irradiation has practical and technical limits. Switch-off times shorter than 5 ms were not possible due to the data processing delay and to the limited sampling rate. In the time range of few ms, the repetition rate of the probe laser pulses (1 kHz) limits the available data to only a few measurements. Subsequently, the influence of errors due to noise becomes very high, and automatic laser control becomes inaccurate. On the other hand, irradiation times longer than 500 ms are not reliably applicable due to patient’s eye movement and elongation of the treatment time per session. Furthermore, some temperature increases are so low due to the chosen laser power or low pigmentation grade that they cannot lead to tissue coagulation. 4.3.OutlookThe treatment method of retinal laser photocoagulation has not changed much in the past 30 years. Recently, shorter irradiation times of about 20 ms have been increasingly discussed, particularly for automated pattern photocoagulation.33 This has the advantage of an overall faster treatment. Furthermore, short irradiation times lead to less tissue damage in axial direction34 and less pain for the patients.35 However, for shorter irradiation times, higher laser powers are necessary. High laser powers lead to a shrinking of the therapeutic window, which is defined as the range of laser powers that lead to a visible lesion rather than to a rupture.30 Recently it was shown that the therapeutic window could be increased for short irradiation times by modifying the spatial and/or temporal shape of the treatment laser beam.36 Optoacoustic treatment control could be used to increase the safety of photocoagulation with short irradiation times to overcome the risks of the decreased therapeutic window. Optoacoustic temperature measurement and laser dosage control could be especially useful in the case of sub-threshold irradiations. Some studies indicate that sub-threshold treatment of retinal diseases might be as effective as standard photocoagulation, for example in the case of proliferative diabetic retinopathy37 or diabetic macular edema.38 Presently, there is no other technique for controlling the laser dosage if no whitening occurs. Because optoacoustic feedback control is the first method that grants an objective control of the tissue effect by every single laser shot, it has the potential to facilitate medical studies on photocoagulation with a previously unknown accuracy. One solution to keep irradiation times in the desired time frame of 5 to 300 ms, is an automatic adjustment of the laser power from one spot application to the next. With this method the irradiation time remains most likely in the window between 5 and 300 ms. Instead of controlling laser energy deposition by time adjustment, it could also be controlled by adjusting laser power or tissue temperature, respectively. According to the Arrhenius theory, the temperature has a stronger influence on the denaturation effect than the irradiation time. Temperature control could be achieved by optoacoustic feedback for automatic adjustment of laser power during treatment. This could be more effective than exposure time control. The first experiments towards optoacoustic feedback power control have been initiated. 5.ConclusionRetinal temperatures can be measured noninvasively during laser coagulation by optoacoustics. The temperature-time-dependence of the damage threshold for ophthalmoscopic visibility one hour after treatment was determined for rabbit eyes in vivo by statistical analysis. Arrhenius parameters were extracted from the ED50 temperature thresholds for visible lesion formation. We implemented an automatic feedback system that ceases treatment laser emission after a desired temperature has been achieved. Lesions that were produced by this automatic irradiation time control were mild, of uniform size and nearly independent of the initial treatment laser power. Furthermore, it was shown that different grades of lesion strength can be produced by different feedback algorithms. AcknowledgmentsThis collaborative project is supported by the German Ministry of Research andTechnology (BMBF) under the Innovation Price for Advancing Medical Technology 2006, Grant No. 01EZ0732 (Medical Laser Center Lübeck), No. 01EZ0733 (Institute of Biomedical Optics), No. 01EZ0734 (Department of Ophthalmology, University Hospital of Schleswig-Holstein, Campus Kiel), and No. 01EZ0735 (Carl ZeissMeditec AG). References
“Early photocoagulation for diabetic retinopathy. ETDRS report No. 9,”
Ophthalmology, 98
(5 Suppl), 766
–785
(1991). OPHTAD 0030-3755 Google Scholar
“Argon laser scatter photocoagulation for prevention of neovascularization and vitreous hemorrhage in branch vein occlusion. A randomized clinical trial,”
Arch. Ophthalmol., 104
(1), 34
–41
(1986). http://dx.doi.org/10.1001/archopht.1986.01050130044017 AROPAW 0003-9950 Google Scholar
“Natural history and clinical management of central retinal vein occlusion,”
Arch. Ophthalmol., 115
(4), 486
–491
(1997). http://dx.doi.org/10.1001/archopht.1997.01100150488006 AROPAW 0003-9950 Google Scholar
A. M. Shah, M. N. Bressler and L. M. Jampol,
“Does laser still have a role in the management of retinal vascular and neovascular diseases?,”
Am. J. Ophthalmol., 152
(3), 332
–339.e1
(2011). http://dx.doi.org/10.1016/j.ajo.2011.04.015 AJOPAA 0002-9394 Google Scholar
“Photocoagulation for diabetic macular edema. ETDRS Report No. 1,”
Arch. Ophthalmol., 103
(12), 1796
–1806
(1985). http://dx.doi.org/10.1001/archopht.1985.01050120030015 AROPAW 0003-9950 Google Scholar
S. Schmidt and R. Peisch,
“Melanin concentration in normal human retinal pigment epithelium. Regional variation and age-related reduction,”
Invest. Ophthalmol. Vis. Sci., 27
(7), 1063
–1067
(1986). IOVSDA 0146-0404 Google Scholar
W. J. Geeraets,
“The relative absorption of thermal energy in retina and choroid,”
Invest. Ophthalmol. Vis. Sci., 1
(3), 340
–347
(1962). IOVSDA 0146-0404 Google Scholar
E. A. Boettner and J. R. Wolter,
“Transmission of the ocular media,”
Invest. Ophthalmol. Vis. Sci., 1
(6), 776
–783
(1962). IOVSDA 0146-0404 Google Scholar
V.-P. Gabel, R. Birngruber and B. Lorenz,
“Clinical relevance of a dosage device for laser photocoagulation,”
Klin. Monbl. Augenheilkd., 188
(4), 263
–265
(1986). Google Scholar
R. Birngruber, F. Hillenkamp and V.-P. Gabel,
“Experimental studies of laser thermal retinal injury,”
Health Phys., 44
(5), 519
–531
(1983). http://dx.doi.org/10.1097/00004032-198305000-00006 HLTPAO 0017-9078 Google Scholar
S. M. Maswadi,
“Temperature mapping of laser-induced hyperthermia in an ocular phantom using magnetic resonance thermography,”
J. Biomed. Opt., 9
(4), 711
–718
(2004). http://dx.doi.org/10.1117/1.1751399 JBOPFO 1083-3668 Google Scholar
W. Weinberg, R. Birngruber and B. Lorenz,
“The change in light reflection of the retina during therapeutic laser-photocoagulation,”
J. Quantum Electron., 20
(12), 1481
–1489
(1984). http://dx.doi.org/10.1109/JQE.1984.1072353 IEJQA7 0018-9197 Google Scholar
V.-P. Gabel,
“Comparison of temperature measurements and fundus reflectometry in laser coagulation,”
Mod. Probl. Ophthalmol., 20 169
–173
(1979). MPOTBR 0077-0078 Google Scholar
K. V. Larin, I. V. Larina and R. O Esenaliev,
“Monitoring of tissue coagulation during thermotherapy using optoacoustic technique,”
J. Phys. D: Appl. Phys., 38
(15), 2645
–2653
(2005). http://dx.doi.org/10.1088/0022-3727/38/15/017 JPAPBE 0022-3727 Google Scholar
I. V. Larina, K. Larin and R. O Esenaliev,
“Real-time optoacoustic monitoring of temperature in tissues,”
J. Phys. D: Appl. Phys., 38 2633
–2639
(2005). http://dx.doi.org/10.1088/0022-3727/38/15/015 JPAPBE 0022-3727 Google Scholar
G. Schüle,
“Noninvasive optoacoustic temperature determination at the fundus of the eye during laser irradiation,”
J. Biomed. Opt., 9
(1), 173
–179
(2004). http://dx.doi.org/10.1117/1.1627338 JBOPFO 1083-3668 Google Scholar
J. Kandulla,
“Noninvasive optoacoustic online retinal temperature determination during continuous-wave laser irradiation,”
J. Biomed. Opt., 11
(4), 041111
(2006). http://dx.doi.org/10.1117/1.2236301 JBOPFO 1083-3668 Google Scholar
K. Schlott,
“Time resolved detection of tissue denaturation during retinal photocoagulation,”
Proc. SPIE, 7373
(2009). http://dx.doi.org/10.1117/12.831877 PSISDG 0277-786X Google Scholar
R. Brinkmann,
“Real-time temperature determination during photocoagulation on patients,”
J. Biomed. Opt., 17
(6), 061219
(2012). JBOPFO 1083-3668 Google Scholar
M. W. Sigrist,
“Laser generation of acoustic waves in liquid and gases,”
J. Appl. Phys., 60
(7), 85
–121
(1986). http://dx.doi.org/10.1063/1.337089 JAPIAU 0021-8979 Google Scholar
R. Birngruber, F. Hillenkamp and V.-P. Gabel,
“Theoretical investigations of laser thermal retinal injury,”
Health Phys., 48
(6), 781
–796
(1985). http://dx.doi.org/10.1097/00004032-198506000-00006 HLTPAO 0017-9078 Google Scholar
M. Hammer,
“Optical properties of ocular fundus tissues—an in vitro study using the double-integrating-sphere technique and inverse Monte Carlo simulation,”
Phys. Med. Biol., 40
(6),
(1995). http://dx.doi.org/10.1088/0031-9155/40/6/001 PHMBA7 0031-9155 Google Scholar
R. Birngruber, Laser Applications in Medicine and Biology, 5 277
–361 Plenum Press, New York
(1991). Google Scholar
A. Vassiliadis, Laser Applications in Medicine and Biology, 1 125
–162 Plenum Press, New York
(1971). Google Scholar
C. I. Bliss,
“The method of probits,”
Science, 79
(2037), 38
–39
(1934). http://dx.doi.org/10.1126/science.79.2037.38 SCIEAS 0036-8075 Google Scholar
R. Birngruber,
“Minimal spot size on the retina formed by the optical system of the eye,”
Int. Ophthalmol., 1
(3), 175
–178
(1979). http://dx.doi.org/10.1007/BF00137496 INOPDR 0165-5701 Google Scholar
W. Weinberg,
“Die zeitliche Entwicklung der Weißfärbung in Korrelation zur Schadensausdehnung bei der Photokoagulation der Netzhaut,”
Ber. Dtsch. Ophthalmol. Ges., 78 603
–606
(1981). Google Scholar
A. Jain,
“Effect of pulse duration on size and character of the lesion in retinal photocoagulation,”
Arch. Ophthalmol., 126
(1), 78
–85
(2008). http://dx.doi.org/10.1001/archophthalmol.2007.29 AROPAW 0003-9950 Google Scholar
M. L. Denton,
“Spatially correlated microthermography maps threshold temperature in laser-induced damage,”
J. Biomed. Opt., 16
(3), 036003
(2011). http://dx.doi.org/10.1117/1.3548881 JBOPFO 1083-3668 Google Scholar
C. Sramek,
“Dynamics of retinal photocoagulation and rupture,”
J. Biomed. Opt., 14
(3), 034007
(2009). http://dx.doi.org/10.1117/1.3130282 JBOPFO 1083-3668 Google Scholar
M. N. Iizuka,
“The effects of dynamic optical properties during interstitial laser photocoagulation,”
Phys. Med. Biol., 45
(5), 1335
–1357
(2000). http://dx.doi.org/10.1088/0031-9155/45/5/317 PHMBA7 0031-9155 Google Scholar
K. Schlott,
“Optoacoustic temperature determination and automatic coagulation control in rabbits,”
SPIE, 7885 78850T
(2011). http://dx.doi.org/10.1117/12.875104 PSISDG 0277-786X Google Scholar
M. S. Blumenkranz,
“Semiautomated patterned scanning laser for retinal photocoagulation,”
Retina, 26
(3), 370
–376
(2006). http://dx.doi.org/10.1097/00006982-200603000-00024 RETIDX 0275-004X Google Scholar
M. A. Mainster,
“Decreasing retinal photocoagulation damage: principles and techniques,”
Semin. Ophthalmol., 14
(4), 200
–209
(1999). SEOPE7 Google Scholar
S. Al-Hussainy, P. M. Dodson and J. M. Gibson,
“Pain response and follow up of patients undergoing panretinal laser photocoagulation with reduced irradiation times,”
Eye, 22
(1), 96
–99
(2008). http://dx.doi.org/10.1038/sj.eye.6703026 12ZYAS 0950-222X Google Scholar
C. Sramek,
“Improving the therapeutic window of retinal photocoagulation by spatial and temporal modulation of the laser beam,”
J. Biomed. Opt., 16
(2), 028004
(2011). http://dx.doi.org/10.1117/1.3542045 JBOPFO 1083-3668 Google Scholar
J. K. Luttrull, D. C. Musch and C. A. Spink,
“Subthreshold diode micropulse panretinal photocoagulation for proliferative diabetic retinopathy,”
Eye, 22
(5), 607
–612
(2008). http://dx.doi.org/10.1038/sj.eye.6702725 12ZYAS 0950-222X Google Scholar
D. Lavinsky,
“Randomized clinical trial evaluating mETDRS versus normal or high-density micropulse photocoagulation for diabetic macular edema,”
Invest. Ophthalmol. Vis. Sci., 52
(7), 4314
–4323
(2011). http://dx.doi.org/10.1167/iovs.10-6828 IOVSDA 0146-0404 Google Scholar
|


