|
|
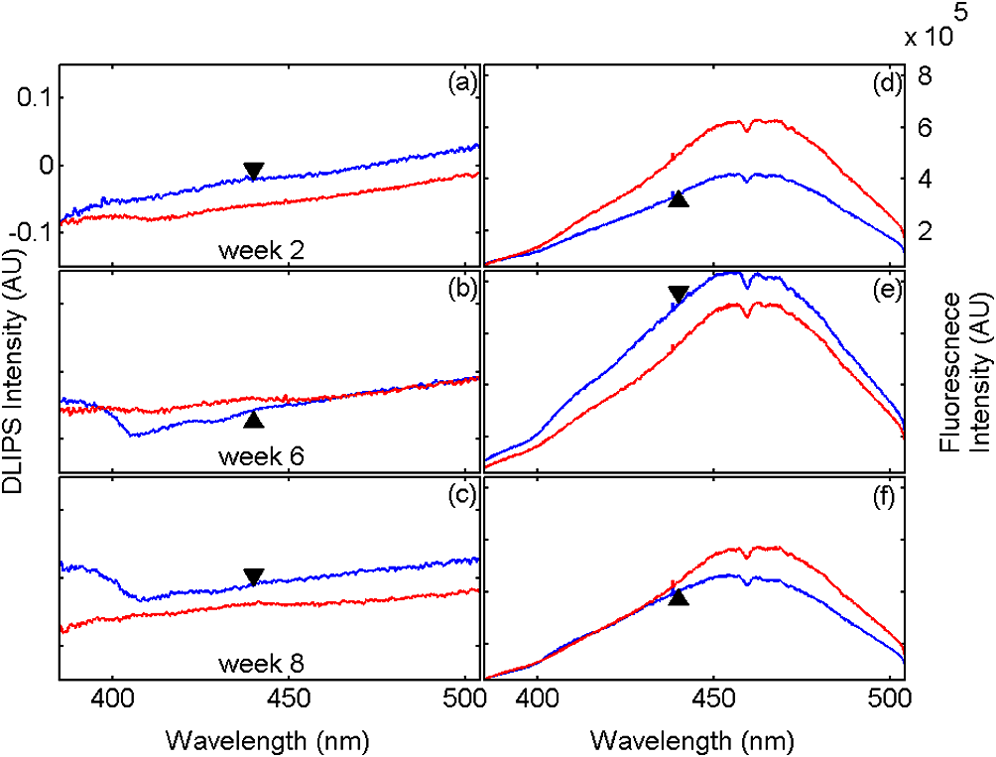
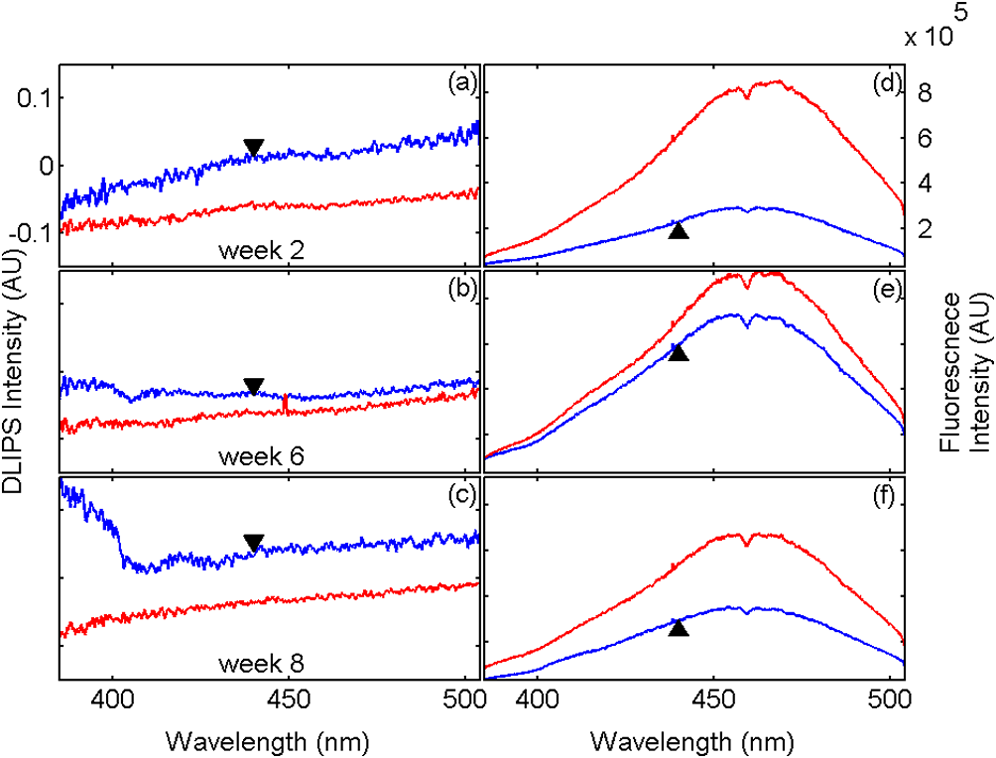
1.IntroductionBiophotonics, the study of interactions between light and biological samples had its earliest applications in diagnostic medicine with the use of optical microscopy to study tissue samples and histological specimens.1 Since that time, advances in optical technologies have spurred the creation of increasingly sophisticated instruments to study tissue for research and in the laboratory, with a particular focus on the early detection of cancer. Fluorescence-based techniques have been developed to probe the endogenous fluorophores of tissue including collagen, nicotinamide adenine dinucleotide (NADH), flavins, and porphyrins.2 Through the study of these endogenous markers, it has been shown that these molecules are correlated with certain pathological conditions and have unique distributions in tumors, and that these fluorescent molecules can be used to distinguish benign from malignant tumors.3,4 Generally, fluorescence spectroscopy is a nondestructive and sensitive technique that allows in vivo detection of organic and biological materials under different environmental conditions in very short times. Because the excitation/emission wavelength pair is a combination of the molecular structure and the overall molecular environment (e.g. biological matrix), fluorescence emission may provide discrimination among emitting materials. Despite the long-standing utility of biophotonics-based strategies in the laboratory, these advanced technologies are only beginning to be applied in the clinic. Epithelial tissues, often easily accessible or with minimal invasiveness via endoscopy, have been targets for the majority of clinical techniques employing tissue autofluorescence imaging or spectroscopy. This includes the detection of gastrointestinal cancers and diseases, colorectal cancer screening, and oral oncology.5–7 Additionally, there are ongoing clinical trials evaluating novel fluorescence techniques such as fluorescence lifetime imaging, multiphoton imaging, hyperspectral imaging, enzyme activity imaging, and single molecule detection for in vivo diagnostic applications.1,8 Each of these strategies leverages measurement of intrinsic optical properties from superficial tissue layers to assay the presence of disease or the potential for disease development. The promise of these optical diagnostic strategies, however, has been marred by high false positive rates when applied to in vivo clinical screening and diagnosis.9 Consequently, following screening, biopsy of suspect lesions followed by histopathological analysis under visible light microscopy remains the gold standard for disease state confirmation in a large proportion of cancers.10–12 This has resulted in a slow maturation process for point-of-care biophotonics and can be attributed to several limiting factors inherent to the complexities of the clinical setting. Common to spectra taken from complex samples, high intensity, broadband fluorescence responses from tissue often obscure the rich biomolecular information found in lower-intensity fluorescence emission bands. As this broadband response could potentially be from a tissue fluorophore unrelated to disease, targeting specific biomarkers of disease has been challenging using these techniques. However, the largest hurdle to surmount in translating these spectral strategies to the clinic has been the significant patient-to-patient variation in fluorescent properties.13,14 This has been shown to be associated with race, age, sex, air temperature, and even deformation of the tissue when applying the probe.13,15–21 The results of this patient and sampling variability include fluctuations in absolute emission intensity, emission peak shifts, and changes in the scattering and absorption properties of the tissue, among other effects.13,21 Brookner,13 for example, reported variations in peak fluorescence intensities varying by more than a factor of five between patients while the intra-patient coefficient of variation was less than 25%. While fluorescence signals are directly linked to the local molecular structure of the targeted system, there clearly remains a need for further improvement in optical-based sensing schemes to specifically address the variations realized with absolute fluorescence intensity. In this paper we present the first application of a new spectral technique, differential laser-induced perturbation spectroscopy (DLIPS), to the in vivo detection of epithelial pathology in an animal model.22,23 The DLIPS sensing scheme incorporates three complementary techniques to improve upon previous fluorescence-based biosensing strategies: laser-induced fluorescence emission, ultraviolet (UV) laser perturbation of tissue, and difference spectroscopy.23 In this instance, fluorescence is used to measure the response of tissue fluorophores before and after the tissue is laser-perturbed. The perturbation pulses from the deep-UV excimer laser (193 nm, 6.4 eV) are strongly absorbed by biological tissue and used to cleave molecular bonds within the extracellular matrix (ECM) as shown schematically in Fig. 1. Irradiation of biological matrices at 193 nm can cause photoionization, including strand breakage, locally denatured sites, interstrand cross-linking, reactions via photo-hydrates, -dimers, and other products.24 In the current work, despite being well below the intensity threshold for tissue ablation, permanent alteration of the underlying tissue structure is induced, with resulting changes realized within the fluorescence spectrum, specifically with respect to photoreactive biomolecules, as made apparent with the DLIPS scheme. We note here that while no direct ablation is realized, a single photon of 193 nm radiation exceeds nearly all bond energies in the biological matrix; hence permanent photochemistry is induced despite being below the critical photon flux to affect material removal. Additionally, because the pre- and post-perturbation spectra are combined [see Eq. (1)] into a difference spectrum, the DLIPS technique mitigates unwanted contributions from unperturbed tissue fluorophores, broadband fluorescence, and importantly, variations in fluorescence emission bands, which are unique to the patient, but not necessarily to the targeted pathology. Equation (1) shows the DLIPS spectral response, namely: where and represent the fluorescence emission intensity recorded at each wavelength before (pre) and following (post) perturbation by the UV excimer laser, respectively. As defined, a negative DLIPS signal corresponds with a reduction in fluorescence intensity following the photo-perturbation step, which is generally attributed to the destruction of a corresponding fluorophore. In contrast, a positive DLIPS signal corresponds to an increase in fluorescence intensity following perturbation, which may indicate destruction of a fluorescence-quenching species and/or the destruction of a concomitant absorbing compound, thereby allowing more light to reach the actual fluorophore. Overall, the complexity of the local fluorescence environment provides the opportunity for the perturbing UV radiation to affect a unique change to the resulting fluorescence response. Therefore, this combination of fluorescence, photochemical perturbation, and differential spectroscopy creates a completely unique spectral signature from targeted tissue. The result is a technique that specifically couples to important photosensitive tissue biomarkers of early pathological changes and that has promise to mitigate the apparent noise sources due to inter-patient variations.The primary goal of this study is to characterize and evaluate the DLIPS biosensing technique using an animal model of epithelial pathology. Using principal component analysis and a simple Hotelling’s -test, we demonstrate that this technique can detect changes in epithelial tissue in vivo. Further, we show via component loading analysis that this technique couples specifically to morphological changes in the ECM, which is unique compared with laser-induced fluorescence. We also demonstrate that this technique is primarily sensitive to changes induced by the pathology model, as opposed to laser-induced fluorescence, which showed sensitivity to other population variables under analysis of variance (ANOVA). Using detection theory analysis of unprocessed principal component data we show that DLIPS is an inherently more robust technique for assaying the presence of pathology in this animal model compared with conventional laser-induced fluorescence alone. Finally, to demonstrate the utility of the DLIPS technique in complementing existing diagnostic techniques, we employ decision fusion with laser-induced fluorescence to further boost performance when detecting the pathological state. 2.Materials and Methods2.1.DLIPS SystemThe DLIPS system is shown schematically in Fig. 2. For all measurements, fluorescence excitation was accomplished using a Q-switched, frequency-tripled Nd: YAG laser, while the UV perturbation was accomplished using a 193 nm ArF excimer laser. The 355 nm fluorescence excitation beam was aligned coaxially with the 193 nm perturbation laser using a dichroic mirror (193 nm) as a beam combiner. Prior to the beam combiner, a variable attenuator was used to reduce the excimer laser to the desired perturbation intensity. The 355 nm beam diameter was about 30% less in diameter than the 193 nm beam (top-hat beam profile) at the target plane, to ensure complete perturbation of the entire fluorescence probe volume. The co-linear laser beams were passed through a pierced mirror positioned at 45 deg to the target plane. With the 355 nm beam incident on the target, fluorescence emission was redirected by the pierced mirror and then focused onto a fiber optic bundle using a combination of two 50-mm-diameter UV-grade lenses, where it was passed to a 0.3 m Czerny-Turner spectrometer and recorded with an intensified CCD (ICCD) array detector. Prior to entering the fiber optic, two sharp-edge filters were used in series: a high-pass filter designed to block the residual 355 nm light, and a low-pass filter designed to block any residual 532 nm light remaining from the frequency-tripling process. With this system, fluorescence emission was successfully collected in the spectral window between about 390 to 500 nm. A digital delay generator was also used to synchronize and control both the ICCD and the 355 nm laser, and a 3 μs detector gate was used to collect the fluorescence, set to the correspond to the leading edge of the 355 nm laser pulse (20 ns full width); hence all prompt and delayed fluorescence was recorded. Additional experimentation revealed that the majority of fluorescence emission corresponded to the first 100 ns of the detector gate. 2.2.Chemical Initiation and Promotion of Mouse Skin TumorsProtocols were approved by the University of Florida Institutional Animal Care and Use Committee. Tumor formation on female athymic nude mice (Hsd: Athymic Nude-, Harlan Laboratories, Indianapolis IN), six to eight weeks old, was induced and promoted by 7,12-dimethylbenz(a)anthracene (DMBA) (Sigma-Aldrich, St. Louis, MO) in mineral oil (Fisher Scientific, Pittsburgh, PA) at a concentration of applied topically to the dorsal skin according to previously described methods.25–31 Application was repeated two to three times per week throughout the 11 week course of the experiment. DMBA application was discontinued if mice began exhibiting signs of systemic toxicity, particularly weight loss. In all cases, cessation of topical application resulted in alleviation of toxicity symptoms. Further, all of these mice showed visible lesions during week eight, consistent with those mice that continued receiving topical DMBA. Topical application of mineral oil alone was used on the control mice. The protocol was terminated at 11 weeks, prior to the emergence of squamous cell carcinomas (SCCs) as the goal of the study was not to investigate the biological difference between cancerous and normal tissue but rather to investigate DLIPS potential as a precancerous diagnostic technique. Thus tissue comparisons were made between healthy tissue and tissue during the course of SCC formation due to DMBA initiation and promotion.26,27 2.3.HistopathologyAt weeks four and eight, one mouse was selected from the control group as well as the DMBA-treated group and euthanized using an intraperatoneal injection of Euthasol (Virbac AH, Ft. Worth TX). Likewise, the remaining mice were euthanized at the end of the study. Immediately following euthanasia, the dorsal skin was excised all the way down to the anteroposterior axis and fixed in formalin (Sigma-Aldrich, St. Louis, MO). Fixed samples were paraffin-embedded, sectioned at 5 μm, and stained with hematoxylin and eosin (H&E). Tissue preparation was performed at the Cell and Tissue Analysis Core, McKnight Brain Institute, University of Florida (Gainesville, FL). The sections were analyzed by a board-certified veterinary pathologist. 2.4.Collection of DLIPS and Fluorescence SpectraStarting in week two of the study, two control mice and two DMBA mice were selected at the beginning of each week for DLIPS and laser-induced fluorescence spectral analysis of the skin. Prior to all DLIPS spectral measurements, each mouse was wiped clean with an alcohol wipe and anesthetized using a ketamine/xylazine solution (Phoenix Pharmaceutical, St. Joseph, MO; Lloyd Laboratories, Shenandoah, IA) at of body weight. Each mouse was then positioned in an alignment holder and spectra were collected from the back of each mouse, two spots from each side of the mouse. For each spot, a fluorescence spectrum was recorded using a 200 shot ensemble average recorded at 5 Hz laser repetition rate, referred to as the pre-perturbation spectrum. Immediately following the pre-perturbation fluorescence measurement, the 193 nm excimer laser was used to deliver a total of 2500 perturbation pulses to the target spot with laser energy of () and a laser repetition rate of 50 Hz. Following perturbation, a delay of 30 seconds was introduced, after which a second fluorescence spectrum was recorded using an identical 200 shot ensemble average, referred to as the post-perturbation spectrum. These two spectra were then subtracted to generate the difference spectrum at each location, per Eq. (1), with the difference divided by the pre-perturbation spectrum to generate the DLIPS response for the given surface site. In this manner, a total of eight DLIPS spectra () were recorded each week from each group (control and DMBA). Despite the emergence of some lesions on the treated mice by week eight, all spectra were collected from skin regions that appeared to be pathology-free under visual inspection (i.e. visible lesions were avoided). Finally, the pre-perturbation spectra alone were retained and averaged separately for each group (control and DMBA) and week, providing traditional fluorescence spectral data to be analyzed independently of the DLIPS approach. 2.5.Multivariate Statistical AnalysisAt the conclusion of the study, all spectra were visually inspected, and 22 individual spectra ( of the total collected) were rejected due to (1) excessive spectral noise and/or no observable difference in the pre- and post-perturbation spectra; indicative of low Nd:YAG laser and/or low perturbation laser intensity during the collection process, or (2) due to atypical spectral appearance (e.g. unusually large negative or positive perturbation), which is indicative of mouse movement (e.g. twitching) between the pre- and post-perturbation measurements. Following this process, the remaining spectra (pre-perturbation fluorescence and DLIPS) for both the control and DMBA groups were imported into MATLAB (The Mathworks, Natick, MA) for processing. Difference spectra and fluorescence spectra were preprocessed using a five-point moving average filter to remove acquisition noise. Fluorescence and DLIPS spectra were then analyzed separately, but using parallel methods, to facilitate side-by-side comparison at each analytical level. Spectra from the treated and control groups were grouped together in several different ways and analyzed using principal component analysis (PCA). Clustering within the data sets was visualized using score plots and the validity of using only the first two principal components for analysis was verified using a scree plot of the principal components (cumulative variance explained greater than 95%). Subgroups from the entire data set were selected for individual PCA to highlight the emergence of differences between the DMBA-treated skin and the untreated skin. For each PCA analysis, Hotelling’s test was used to verify that the clusters from the treated and control samples were statistically different.32 The component loadings from the first principal component were used to assess which spectral regions best explain variations within and between data sets.33 Component loadings were squared to facilitate direct comparison of loading across wavelength regions between sub-populations of the data set (this casts each wavelength’s loading value in terms of percent variance explained in the particular component). The regions of the spectrum at higher component loading levels were considered to have the highest impact on the observed differences between DMBA treated and control mice. Analysis of variance (ANOVA) was used to relate variations observed in principal component space to changes in the discrete study parameters. The goal of this analysis was to determine which factors (age of target pathology, papilloma formation, etc.) significantly had an impact on either the DLIPS spectra or the laser-induced fluorescence spectra. 2.6.Detection Theory Analysis of Classification PerformanceTo investigate the ability of the DLIPS technique to discriminate between healthy and pathological tissue, a likelihood ratio classifier was implemented, as this has been shown to be the optimal detector to discover a signal in noise, irrespective of the type of data passed into it.34,35 Further, this classifier implementation facilitates direct performance comparison between laser-induced fluorescence and DLIPS without the need for the subjective evaluation of classifier appropriateness for one spectral technique versus another. The spectral data set was first processed using PCA to reduce the dimensionality of the data and consolidate the majority of the variation in the first few resolved components. PCA was used because this change of basis maximizes the variance across all of the data and does not require a priori knowledge of class associations. Due to the large percentage of variance explained by the first principal component for both the DLIPS and fluorescence spectra, as well as the limited size of the data set, detection theory modeling was restricted to decisions made using this first component. In this study, the null hypothesis () was considered to be the absence of DMBA-induced pathology plus some noise (e.g. biological background, shot noise in the ICCD), while the alternate hypothesis () was that a signal due to pathology is present in a noisy background, as shown in Eq. (2).34 However, the overall inter-sample variance is assumed to be dominated by the presence or absence of the pathological state, not the noise. No prior knowledge of the data distribution under or was assumed, and the distributions were approximated using kernel density estimation (bandwidth set using a Gaussian approximation) as and respectively.36 The probability density functions were combined into a likelihood ratio and compared against a range of operating points () to compute the receiver operating character (ROC) curves, as shown in Eq. (3). For each operating point, the null hypothesis was rejected if the likelihood ratio was less than or equal to . The classification rule was applied across the entire data subset under consideration to compute the false positive rate (FPR) and true positive rate (TPR) for the corresponding operating point, given by: To compare the inherent performance of the two spectral techniques, the area under the ROC curve (AUC) was used.37 The maximum Matthews correlation coefficient (MCC) was evaluated as a basis for comparing “optimal” operating points between the two techniques as it provided equal weight to minimizing both false positive and false negative results. Finally, a multi-modal pathology detector was designed using decision fusion in order to show the ability of DLIPS to complement traditional spectral techniques and boost the overall detection performance. Liao38 and Jesneck34 provide excellent reviews of the details for applying this technique to fuse multiple detectors as well as the benefits and limitations. The implementation employed here follows directly from Liao38 without significant modification. Operating points for the local detectors were optimized by choosing the threshold that maximized the MCC. In this case, only the decisions from the DLIPS detector and the laser-induced fluorescence detector were used to create a fused detector. Performance was evaluated by calculating the AUC of the ROC for the fusion processor and comparing that with the performance of a single detector. 3.Results3.1.HistopathologyFigure 3(a) through 3(d) are representative photomicrographs of the H&E sections of the skin at four, eight, and eleven weeks of the study. The top left panel [Fig. 3(a)] is from a control mouse after week four of the study. There is normal epidermal thickness with several layers in the stratum corneum. Hair follicles and sebaceous glands are in normal density within dermal collagen and subcutis. Skin samples from control mice in subsequent weeks were comparable with the sample at week four. Figure 3(b) shows the skin after four weeks of DMBA treatment, which displayed moderate epidermal changes including acanthosis and orthokeratotic hyperkeratosis, characterized by thickening of the stratum spinosum, stratum granulosum, and stratum corneum. Hair follicles were reduced in density, and the dermis in treated areas was almost devoid of sebaceous glands compared to skin from control mice. At the same time dermal collagen density was increased. After eight weeks of topical DMBA application, skin was characterized by more severe acanthosis, orthokeratotic hyperkeratosis, and dermal fibrosis than in skin after four weeks, as shown in Fig. 3(c). Hair follicles were infrequently found in treated areas, and sebaceous glands were almost completely absent. Squamous cell papillomas were occasionally present in the epidermis (although not shown in this section). At the conclusion of the study, week 11, the DMBA treated skin [Fig. 3(d)] showed more severe epidermal acanthosis and hyperkeratosis. There was also an increased, but still low density, scattering of squamous cell papillomas throughout the epidermis. Dermal fibrosis was slightly more severe than in samples from mice at eight weeks of DMBA treatment. Fig. 3H&E stained histology sections of skin from: (a) control mouse, week four; (b) DMBA mouse, week four; (c) DMBA mouse, week eight; and (d) DMBA mouse, week 11; (▴) denotes thickened regions of the stratum corneum, symptomatic of orthokeratotic hyperkeratosis; (⊗) highlights the thickening of the stratum spinosum, characteristic of acanthosis; () denotes areas of increased dermal collagen density; (d) is a section through a developed papilloma.  3.2.DLIPS and Laser-Induced Fluorescence SpectraFigure 4(a) through 4(c) show the average DLIPS spectra of the DMBA treated skin as compared with the control samples at weeks 2, 6, and 8. Figure 4(d) through 4(f) show the average of the laser-induced fluorescence spectra at the same time points, again comparing DMBA and control groups. Over the weeks of DMBA application, noticeable changes in shape of DLIPS spectra emerge (DMBA versus control), while these changes are not directly observable in the fluorescence spectra alone. Figure 5 shows individual (i.e. single mouse) spectral samples at the same time points of the study, illustrating the ability of the DLIPS technique to exploit internal normalization of the spectra relative to the tissue, and thus revealing information about the underlying pathology. Both figures show the emergence of a noticeable band in the lower wavelengths of the DLIPS spectra throughout the pathological progression of the DMBA model. This information is either obscured or not detected using fluorescence alone, as the spectra from the skin (both control and DMBA-treated) are dominated by the broad, correlated fluorescence peak centered on 460 nm. 3.3.Multivariate Statistical AnalysisFigure 6(a) and 6(b) show the score plots from the entire data set for the DLIPS data as well as the laser-induced fluorescence spectra. In both cases, 68 individual spectra were used from the DMBA-treated mice and 80 from the control mice throughout the eleven weeks of the study. For the entire DLIPS spectral data set, the cumulative variance explained by PC1 and PC2 was 95% while these components explained 99% of the variance for the fluorescence spectra. For both data sets Hotelling’s test returned a -value less than 0.001, confirming that the spectra collected from untreated mice are statistically unique from those collected from the DMBA-treated mice. Fig. 6Score plots for the principal component analysis of the (a) DLIPS and (b) laser-induced fluorescence spectra from week 2 to 11 of the study. Control (•); DMBA-treated weeks 2 and 3 (▪); weeks 4 and 5 (♦); weeks 6 and 7 (◂); weeks 8 and 9 (▸); weeks 10 and 11 ().  As an extension of this dimension reduction and remapping of the spectral data set into principal component space, the component loadings were used to identify the important spectral regions in explaining the variance across the entire data set as well as several subpopulations of the data set. Figure 7 shows the proportion of variance in a given data set as a function of wavelength. PC1 was the only component considered since greater than 90% of the total variance in principal component space was accounted for in this component for all cases. Figure 7(a) through 7(c) show the proportion of variance using the DLIPS technique for the entire data set, the DMBA data subset, and the control data subset, respectively. Across all acquired spectra, the most important regions in explaining the differences are below 400 nm, a peak at 420 nm, and a region of increasing importance at wavelengths above 460 nm. Additionally, when the control spectra and DMBA-treatment spectra are analyzed separately, unique band regions emerge to potentially explain the observed pathological progression to lesion formation in the DMBA model as opposed to the skin from the control mice. Primarily, the DMBA-treated skin has an important band between 400 and 420 nm, while the control skin’s band is below 400 nm. Although neither of these sub-populations shows much loading above 460 nm, the entire data set shows significant variability above this wavelength. This implies that this region may specifically account for variability between control and DMBA-treated skin using the DLIPS technique. Fig. 7Proportion of variance in principal component 1 accounted for by each wavelength from (a) through (c) DLIPS spectra; (d) through (f) laser-induced fluorescence spectra; and (g) through (i) post-perturbation spectra. In each row, the leftmost plot considers the variation across the entire data set; the middle plot represents the variation from only from DMBA-treated mice; and the right plot represents variation within the control data.  Remarkably, the region around the peak fluorescence emission is of minimal importance using the DLIPS technique, a dramatic contrast with the component loadings for the traditional laser-induced fluorescence spectra across the same data sets [Fig. 7(d) through 7(f)]. The fact that the shape of the component-loading map closely resembles that of the fluorescence spectra is indicative of a strong dependence on intensity fluctuations at the peak emission wavelength in describing variations across the data set. Further, there are no unique spectral regions within either the DMBA-treated or control groups when compared with the loadings from the entire data set. This sensitivity to signal intensity highlights an important limitation of traditional in vivo fluorescence techniques; namely, that subject-to-subject variability can often obscure the relatively much smaller variability due to changes in tissue autofluorescence.13 Finally, Fig. 7(g) through 7(i) shows the same technique applied to the spectra collected after the perturbation laser pulse. This analysis was applied to this data to assess whether any new information gained from applying the differential technique is unique to DLIPS, or merely inherent to the post-perturbation fluorescence spectra. Not unlike the component loadings for laser-induced spectra, these resemble the shape of the acquired fluorescence spectra, indicating that the most significant feature is the variability of the intensity of the broad fluorescence peak fluorescence centered at 460 nm. Again, the component loadings are the same across all three figures, indicating limited coupling of these spectra to underlying tissue biomolecular structure. One-way analysis of variance (ANOVA) was used to determine which experimental factors were significant in explaining the observed differences in the spectral data set. The analysis was restricted to a one-way test because none of the two-way or three-way combinations of factors were significant, and there were missing factor combinations in the data set. The experimental factors that were controlled and accounted for in this study were treatment group, study week, spot number, acquisition order, and mouse number. There were only two treatment groups, either DMBA-treated or control. Spot number refers to which of the up to four measurements taken on a mouse on a particular day is being referenced. Acquisition order refers to whether the spectra were taken from the first or second mouse measured within a treatment group on a particular day. Finally, mouse within treatment group is a unique identifier for each of the five mice in each treatment group. Table 1 shows the -values returned for each of the independent variables against PC1 and PC2 using DLIPS and laser-induced fluorescence. A value of 0.05 or less was considered a significant result and thus an underlying factor in explaining the variation of the data set. Under that threshold, the only experimental factors significantly reflected in the DLIPS spectra are study week (i.e. progression of DMBA-induced pathology or aging) and treatment group. While the raw fluorescence spectra show those factors to be significant, there are also significant contributions from acquisition order and mouse number, which are attributed primarily to random fluctuations in the absolute fluorescence signals. Table 1P-values from an ANOVA-based significance test of the controlled variables in the spectral dataset acquired from the mice. Significance with respect to each of the first two principal components using a particular spectral technique was assessed using one-way ANOVA (constrained sum of squares). Bold p-values are considered significant under a p<0.05 criteria.
Table 2Detection performance metrics using DLIPS, laser-induced fluorescence, or a decision fusion approach.
3.4.Pathology Detection PerformanceUsing the same compressive transformation as above, sub-populations of the data set were compared to describe the ability of each technique to discriminate the pathological (or pre-pathological) state from normal skin. In this case, only the first principal component was considered due to the small size of the sub-populations used in classifier construction. Specifically, the spectral data was partitioned into “early” (weeks 2 to 4), “middle” (week 5 through 8), and “late” (week 9 through 11) segments, based upon the visual observation of similar pathological states within those time periods for the DMBA-treated mice. The “early” DMBA-treatment group was considered pre-pathological as both observational and histological evidence showed only the earliest stages (inflammation and hyperplasia) of development. The “middle” and “late” periods were considered definite-pathological because dysplastic lesions and papillomas were visible during those periods of the study. PCA was performed independently on all of the data (DMBA treated and control) for the given time periods. Figure 8 shows the ROC curves derived from the likelihood ratios computed using the DLIPS technique, and Fig. 9 shows the curves for laser-induced fluorescence. With the exception the “early” time period, detection performance using the DLIPS technique was considerably better than using laser-induced fluorescence, as measured by calculating the AUC for each ROC curve. Even during the “early” stage of pathology development, which we note is considered pre-pathological, the DLIPS technique only lagged fluorescence by 2.5%. However, during the “middle” and “late” stages, DLIPS showed a 29.79 and 5.01% improvement in detection performance, respectively. In addition, Table 2 shows the sensitivity and specificity at the “optimal” operating points for these pathology detectors, assuming an equal weighting for false negatives and false positives. This table shows that for DLIPS, as the pathology matures, the specificity of detection stays at a high level while the sensitivity improves. On the other hand, when laser-induced fluorescence is used the sensitivity still improves, but at the expense of specificity. Thus, even when the detection performance of these techniques is optimized using an off-the-shelf classification scheme (i.e.: artificial neural network, linear discriminant analysis, etc.), the information encoded using DLIPS is more robust than traditional fluorescence spectroscopy and offers improved discrimination when detecting pathology. Fig. 8ROC curves for the detection of DMBA-induced skin pathology using the DLIPS technique. The data set was partitioned into early (weeks 2 to 4); middle (weeks 5 through 8); and late (weeks 9 through 11) time periods of papilloma development resulting from topical DMBA application.  Fig. 9ROC curves for the detection of DMBA-induced skin pathology using laser-induced fluorescence. The data set was partitioned into early (weeks 2 to 4); middle (weeks 5 through 8); and late (weeks 9 through 11) time periods of papilloma development resulting from topical DMBA application.  As evidenced above using component loadings, the DLIPS spectra and fluorescence spectra emphasize unique spectral regions and features. Assuming this means that these spectra reflect different underlying biological changes, or at the very least some amount of statistical independence between the two techniques, the DLIPS technique was combined with laser-induced fluorescence to improve the overall detection performance.34,38 Figure 10 shows the ROC curve for this fused classifier as well as the ROC curves for the local detectors with the operating points used to create the fused classifier labeled. When used to evaluate the “late” data set, the AUC is improved by 11.70% over detection using laser-induced fluorescence alone. Based upon these results, DLIPS may serve as a new dimension in the composite evaluation of pathology for in vivo detection and diagnosis applications. Fig. 10ROC curves for the fused decision incorporating both fluorescence and DLIPS spectra to boost the optimal performance in detecting DMBA-induced skin pathology in the “late” timeframe, weeks 9 to 11. The other ROC curves are from the DLIPS and fluorescence based techniques alone, with the selected operating points noted (). 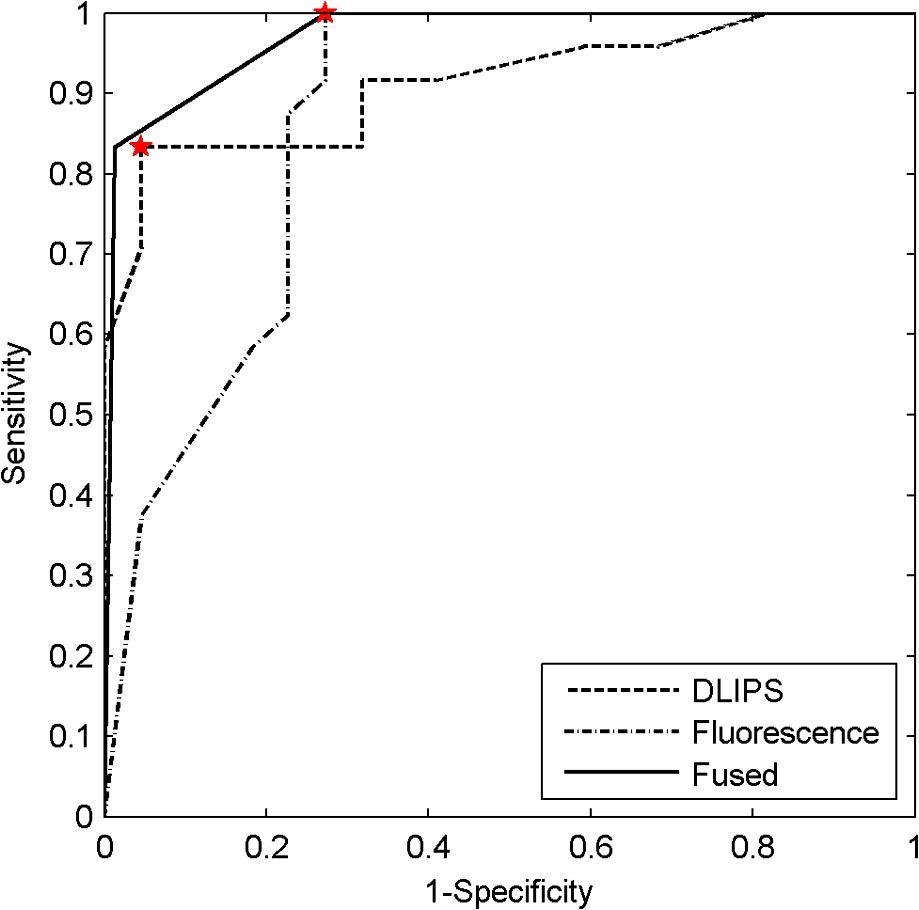 4.DiscussionIn this study, we investigated a new spectral technique, DLIPS, and evaluated its applicability to detecting pathological changes in a murine model. Our findings show preliminary support for applying this technique as a stand-alone medical diagnostic tool or as a complementary technique to traditional fluorescence spectroscopy for the detection of pathology in vivo. Of particular note were the findings that the DLIPS spectra emphasize different spectral regions from the laser-induced fluorescence spectra, and that the endogenous pathology detection potential for DLIPS shows superior performance when compared with laser-induced fluorescence alone in this study. As has been shown before, the strong fluorescence peak centered on 460 nm for the fluorescence spectra (Figs. 4 and 5) can most reasonably be assigned to the tissue fluorophore NADH.3,39–41 While this is an important tissue fluorophore, and is a primary target of fluorescence tissue assessment, it serves as a marker of increased cellular metabolism, which is a hallmark of dysplasia, but not necessarily unique to it. In conjunction with increased cellular metabolism, one of the earliest markers of pre-cancerous progression is cellular infiltration and the release of growth factors and cytokines. This unchecked cellular signaling results in the proliferation of fibroblasts, increased collagen synthesis, and suppression of collagenase production, with the overall effect of restructuring the local ECM.42 These effects suggest that techniques that target collagen remapping might provide direct diagnostic coupling of the spectra to the pathology. Figure 7(a) shows that this spectral region, up to 420 nm, was the most prominent region in explaining the variance when using DLIPS and is in the range for emission due to collagen.3,39–41 This agrees with previous work showing that excimer laser pulses can break collagen amide bonds, resulting in a pronounced difference spectrum band.22,23 Further, when PCA was performed independently on the control spectra and the DMBA treated spectra [Fig. 7(b) and 7(c)], a unique collagen region emerges in each case, at lower wavelengths for control skin and at higher wavelengths for DMBA-treated skin. This region of higher variability is likely due to the progression of ECM remodeling associated with pre-cancerous lesion formation throughout the 11 weeks of the study for the DMBA-treated skin. As for the control skin, this region of higher variability could be due to the aging-related remodeling of skin or the natural turnover of skin ECM proteins.13,17 In this regard, DLIPS serves as a convenient probe for ECM structure that was previously inaccessible when exciting natural fluorescence at 355 nm, as it has been noted that at this excitation wavelength it is not possible to resolve collagen fluorescence from that of NADH.43 Our component-loading plots for the laser-induced fluorescence spectra and the post-perturbation spectra [Fig. 7(d) through 7(i)] illustrate this effect as the variation is most strongly tied to the intensity of the broad NADH peak at 460 nm. The other important spectral region in distinguishing DLIPS spectra is above 460 nm. This band of increasing importance up to 500 nm is not clearly assignable to metabolic or structural fluorophores, but is definitely a point of contrast between DMBA-treated and control skin as it only shows up in the combined spectral pool [Fig. 7(a)]. The proximity to the 460 nm NADH peak could indicate it is simply a residual region from that emission but further work will be required to isolate the molecular source of this DLIPS region and assess its diagnostic strength. The DMBA model of pathogenesis has been well characterized, particularly with regard to in vivo models for the evaluation of fluorescence-based techniques to detect and diagnosis cancerous and pre-cancerous lesion formation.26,27,41 While our study found improved performance using the DLIPS technique, other studies have reported accuracy rates up to 90% for detecting precancerous morphological changes and sensitivities and specificities ranges of 76 to 95% and 83 to 95%, respectively, when using fluorescence spectroscopy.26,41,44,45 However, a major difference of these studies was the focus on an algorithmic approach to boosting detection performance using techniques like partial least squares discriminant analysis or a support vector machine to develop a maximized basis on which to separate the data and subsequently only resolve a single detection operating point.27,41,46 In diagnostic medicine, there is often a much greater cost associated with a false negative result as opposed to a false positive, as evidenced by the high sensitivities and low specificities reported for physician-driven diagnostic techniques.11 Thus, an understanding of the entire performance curve is critical, as different applications may require operating far from the optimal decision threshold in order to boost either sensitivity or specificity. In our work, a technique-driven investigational study, PCA was employed allowing the inherent variance of the data to be the factor across which the dimensionality was reduced and the data were separated. This permitted a probing of the primary source of variation: the emerging pathology or noise. Since the tissue under investigation in this study was not actual spontaneous human lesions (in vivo or otherwise), development of a discriminant model to improve detection was not considered, as it must be derived from the intended target, but will be implemented when appropriate in future work. Despite this significant difference in change of basis methodology, the performance metrics reported in Table 2 indicate that this technique has at least comparable detection performance to previously reported fluorescence studies in DMBA-induced model pathology. However, when translating results to actual clinical use, performance of fluorescence spectroscopy is reported to drop to 70 to 82% sensitivity and 68 to 92%, specificity.46,47 This is most often attributed to patient-to-patient variability and is a known confounding factor for clinical in vivo fluorescence measurements. Although multiple standardization and normalization techniques have been proposed to combat this issue, it necessarily comes at the cost of lost information from the collected spectra.27 Our results in Fig. 9 support this notion that, without a normalization strategy, emission spectra can vary widely due to factors other than changes in the underlying pathological condition. The severe drop in performance for identifying pathology during weeks five through eight is likely due to emission fluctuations associated with the data collection process or the particular spots being interrogated on the back of particular mice. In the case of DLIPS, the spectrum represents a differential response measurement from the same location and is in that sense self-referencing in order to specifically remove variation associated with inter-sample differences. Figure 8 supports this stabilization of measurement as it shows the detection performance improving uniformly with the maturation of the DMBA-induced pathology. Irrespective of the diagnostic performance of this technique using a model of pathology, or how that compares with other techniques, DLIPS still provides a new spectral dimension with which to investigate epidermal pathology. As more diagnostic tests and techniques become available, there is an increasing trend in medicine toward boosting the performance of pathology detection by combining disparate data sets from multiple unique sources. Although this can be a challenging problem, techniques from the bioinformatics and machine learning communities can be applied to optimally fuse this information.34,48–50 In the case of DLIPS, its largest impact may be in offering a new source of unique information about the ECM to be processed along with multiple other markers of disease. Our preliminary findings (Fig. 10) fusing this technique with fluorescence spectroscopy shows that improvements in diagnosis can be realized by combining this technique with other independent biomarkers for the target pathology. We note an additional point in regard to the DLIPS technique in the context of orthogonal sensing; namely, that the scheme is readily implemented with Raman spectroscopy as the primary optical scheme.23 In other words, Raman spectra are recorded pre- and post-perturbation, and the difference Raman DLIPS spectrum is then calculated in the same manner as done with a fluorescence probe. In summary, our work here presents a promising preliminary evaluation of DLIPS for the in vivo detection of disease. We succeeded in revealing the underlying sources of physiological contrast to which DLIPS is sensitive and also established the baseline performance of DLIPS in detecting pathological changes. Applying identical data collection and evaluation techniques, DLIPS showed superior detection performance when compared with laser-induced fluorescence spectroscopy. Future work will include the refinement of this technique in subsequent animal studies, application of the DLIPS technique to other spectral domains, and further investigation of the endogenous chromophores responsible for the spectral changes under DLIPS detection, with the long-term goal of translating this technique to the clinic. AcknowledgmentsFunding for the research was provided in part by the University of Florida Office of Research through the Opportunity Fund Program (#80869/80870). ReferencesM. Brownstein et al.,
“Biophotonic tools in cell and tissue diagnostics,”
J. Re. Nat. Inst. Stand. Techn., 112
(3), 139
–152
(2007). http://dx.doi.org/10.6028/jres JRITEF 1044-677X Google Scholar
J. R. Lakowicz, Principles of Fluorescence Spectroscopy, Springer, New York
(2006). Google Scholar
R. R. Alfano et al.,
“Laser induced fluorescence spectroscopy from native cancerous and normal tissue,”
IEEE J. Quan. Elect., 20
(12), 1507
–1511
(1984). http://dx.doi.org/10.1109/JQE.1984.1072322 IEJQA7 0018-9197 Google Scholar
A. Policard,
“A study on the available aspects of experimental tumours examined by Wood's light,”
Comptes Rendus Des Seances De La Societe De Biologie Et De Ses Filiales, 91
(Pt. 2), 1423
–1424
(1924). Google Scholar
B. W. Chwirot et al.,
“Spectrally resolved fluorescence imaging of human colonic adenomas,”
J. Photochem. Photobio. B: Biology, 50
(2–3), 174
–183
(1999). http://dx.doi.org/10.1016/S1011-1344(99)00089-5 JPPBEG 1011-1344 Google Scholar
D. C. G. De Veld et al.,
“The status of in vivo autofluorescence spectroscopy and imaging for oral oncology,”
Oral Oncol., 41
(2), 117
–131
(2005). http://dx.doi.org/10.1016/j.oraloncology.2004.07.007 EJCCER 1368-8375 Google Scholar
J. Haringsma and G. N. J. Tytgat,
“Fluorescence and autofluorescence,”
Bailliere’s Clin. Gastro., 13
(1), 1
–10
(1999). http://dx.doi.org/10.1053/bega.1999.0003 0950-3528 Google Scholar
M. A. Funovics, R. Weissleder and U. Mahmood,
“Catheter-based in vivo imaging of enzyme activity and gene expression: feasibility study in mice,”
Radiology, 231
(3), 659
–666
(2004). http://dx.doi.org/10.1148/radiol.2313030831 RADLAX 0033-8419 Google Scholar
N. Ramanujam,
“Fluorescence spectroscopy of neoplastic and non-neoplastic tissues,”
Neoplasia, 2
(1–2), 89
–117
(2000). http://dx.doi.org/10.1038/sj.neo.7900077 1522-8002 Google Scholar
L. Gortzak-Uzan et al.,
“Sentinel lymph node biopsy vs. pelvic lymphadenectomy in early stage cervical cancer: Is it time to change the gold standard?,”
Gynecol. Oncol., 116
(1), 28
–32
(2010). GYNOA3 Google Scholar
M. F. Mitchell et al.,
“Fluorescence spectroscopy for diagnosis of squamous intraepithelial lesions of the cervix,”
Obstet. Gynecol., 93
(3), 462
–470
(1999). http://dx.doi.org/10.1016/S0029-7844(98)00385-8 0029-7844 Google Scholar
V. Ravery et al.,
“The 20-core prostate biopsy protocol—a new gold standard?,”
J. Urol., 179
(2), 504
–507
(2008). http://dx.doi.org/10.1016/j.juro.2007.09.033 JOURAA 0022-5347 Google Scholar
C. Brookner et al.,
“Effects of biographical variables on cervical fluorescence emission spectra,”
J. Biomed. Optic., 8
(3), 479
–483
(2003). http://dx.doi.org/10.1117/1.1578642 JBOPFO 1083-3668 Google Scholar
S. F. Martin et al.,
“Fluorescence spectroscopy of an in vitro model of human cervical precancer indentifies neoplastic phenotype,”
Inter. J. Cancer, 120
(9), 1964
–1970
(2007). http://dx.doi.org/10.1002/(ISSN)1097-0215 IJCNAW 0020-7136 Google Scholar
A. J. Bailey, R. G. Paul and L. Knott,
“Mechanisms of maturation and ageing of collagen,”
Mech. Ageing Dev., 106
(1–2), 1
–56
(1998). http://dx.doi.org/10.1016/S0047-6374(98)00119-5 MAGDA3 0047-6374 Google Scholar
K. Calabro et al.,
“Gender variations in the optical properties of skin in murine animal models,”
J. Biomed. Optic., 16
(1), 011008
(2011). http://dx.doi.org/10.1117/1.3525565 JBOPFO 1083-3668 Google Scholar
N. Kollias et al.,
“Endogenous skin fluorescence includes bands that may serve as quantitative markers of aging and photoaging,”
J. Investig Dermatol, 111
(5), 776
–780
(1998). Google Scholar
A. C. Meyer et al.,
“Calcium, collagen, elastin and hexosamine levels in the arteries of whites and bantu,”
S. A. Med. J., 39
(40), 1017
–1020
(1965). SAMJAF 0038-2469 Google Scholar
A. Moragas et al.,
“Image analysis of dermal collagen changes during skin aging,”
Anal. Quant. Cytol. Histol., 20
(6), 493
–499
(1998). AQCHED 0884-6812 Google Scholar
T. Rechberger et al.,
“Role of fascial collagen in stress urinary incontinence,”
Am. J. Obst. Gynecol., 179
(6), 1511
–1514
(1998). http://dx.doi.org/10.1016/S0002-9378(98)70017-1 AJOGAH 0002-9378 Google Scholar
S.-H. Tseng et al.,
“Chromophore concentrations, absorption and scattering properties of human skin in vivo,”
Opt. Express, 17
(17), 14599
–14617
(2009). http://dx.doi.org/10.1364/OE.17.014599 OPEXFF 1094-4087 Google Scholar
S. E. Smith, K. D. Buchanan and D. W. Hahn,
“Excimer laser-induced perturbation spectroscopy: an approach to biosensing,”
Proc. SPIE, 7674 767409
(2010). http://dx.doi.org/10.1117/12.849483 PSISDG 0277-786X Google Scholar
S. E. Smith et al.,
“Differential laser-induced perturbation spectroscopy using a deep-ultraviolet excimer laser,”
Opt. Lett., 36
(11), 2116
–2118
(2011). http://dx.doi.org/10.1364/OL.36.002116 OPLEDP 0146-9592 Google Scholar
H. Gorner,
“Photochemistry of DNA and related biomolecules: quantum yields and consequences of photoionization,”
J. Photochem. Photobio., 26
(2), 117
–139
(1994). http://dx.doi.org/10.1016/1011-1344(94)07068-7 1010-6030 Google Scholar
D. Chakravarti et al.,
“Relating aromatic hydrocarbon-induced DNA adducts and c-H-ras mutations in mouse skin papillomas: the role of apurinic sites,”
Proc. Natl. Acad. Sci., 92
(22), 10422
–10426
(1995). http://dx.doi.org/10.1073/pnas.92.22.10422 0369-3236 Google Scholar
L. Coghlan et al.,
“Optimal fluorescence excitation wavelengths for detection of squamous intra-epithelial neoplasia: results from an animal model,”
Opt. Express, 7
(12), 436
–446
(2000). http://dx.doi.org/10.1364/OE.7.000436 OPEXFF 1094-4087 Google Scholar
L. Coghlan et al.,
“Fluorescence spectroscopy of epithelial tissue throughout the dysplasia-carcinoma sequence in an animal model: spectroscopic changes precede morphologic changes,”
Lasers Surg. Med., 29
(1), 1
–10
(2001). http://dx.doi.org/10.1002/(ISSN)1096-9101 LSMEDI 0196-8092 Google Scholar
O. H. Iversen,
“A course of very small doses of DMBA, each of them alleged with no promoting potency, acts with clear synergistic effect as a strong promoter of DMBA-initiated mouse skin carcinogenesis. A comparison of the tumorigenic and carcinogenic effects of DMBA (7,12-dimethylbenz-alpha-anthracene) and TPA (12-O-tetradecanoyl-phorbol-13-acetate) used as initiators and promoters in classical two-stage experimental protocols,”
APMIS Suppl., 102
(Suppl. 41), 1
–38
(1994). AISSE2 0903-465X Google Scholar
X. L. Li et al.,
“Interleukin-alpha up-regulation in vivo by a potent carcinogen 7,12-dimethylbenz(a)anthracene (DMBA) and control of dmba-induced inflammatory responses,”
Cancer Res., 62
(2), 417
–423
(2002). CNREA8 0008-5472 Google Scholar
M. A. Nelson et al.,
“Detection of mutant Ha-ras genes in chemically initiated mouse skin epidermis before the development of benign tumors,”
Proc. Natl. Acad. Sci., 89
(14), 6398
–6402
(1992). http://dx.doi.org/10.1073/pnas.89.14.6398 0369-3236 Google Scholar
M. Quintanilla et al.,
“Carcinogen-specific mutation and amplification of Ha-ras during mouse skin carcinogenesis,”
Nature, 322
(6074), 78
–80
(1986). http://dx.doi.org/10.1038/322078a0 NATUAS 0028-0836 Google Scholar
A. C. Rencher, Methods of Multivariate Analysis, Wiley, New York
(1995). Google Scholar
K. Thumanu et al.,
“Spectroscopic signature of mouse embryonic stem cell-derived hepatocytes using synchrotorn Fourier transform infrared microspectroscopy,”
J. Biomed. Optic., 16
(5), 057005
(2011). http://dx.doi.org/10.1117/1.3580253 JBOPFO 1083-3668 Google Scholar
J. L. Jesneck et al.,
“Optimized approach to decision fusion of heterogeneous data for breast cancer diagnosis,”
Med. Phys., 33
(33), 2945
–2954
(2006). http://dx.doi.org/10.1118/1.2208934 MPHYA6 0094-2405 Google Scholar
H. L. VanTrees, Detection, Estimation, and Modulation Theory (Part I), Wiley, New York
(1968). Google Scholar
Z. I. Botev, J. F. Grotowski and D. P. Kroese,
“Kernel density estimation via diffusion,”
Ann. Stat., 38
(5), 2916
–2957
(2010). http://dx.doi.org/10.1214/10-AOS799 ASTSC7 0090-5364 Google Scholar
C. Zhu et al.,
“Fluorescence spectroscopy: an adjunct diagnostic tool to image-guided core needle biopsy of the breast,”
IEEE Trans. Biomed. Engin., 56
(10), 2518
–2528
(2009). http://dx.doi.org/10.1109/TBME.2009.2015936 IEBEAX 0018-9294 Google Scholar
Y. Liao, L. W. Nolte and L. M. Collins,
“Decision fusion of ground-penetrating radar and metal detector algorithms—a robust approach,”
IEEE Trans. Geoscience Remote Sensing, 45
(2), 398
–409
(2007). http://dx.doi.org/10.1109/TGRS.2006.888096 IEGEAO 0018-9413 Google Scholar
G. Bottiroli et al.,
“Natural fluorescence of normal and neoplastic human colon: a comprehensive ex vivo study,”
Lasers Surg. Med., 16
(1), 48
–60
(1995). http://dx.doi.org/10.1002/(ISSN)1096-9101 LSMEDI 0196-8092 Google Scholar
C. Eker et al.,
“Multivariate analysis of laryngeal fluorescence spectra recorded in vivo,”
Lasers Surg. Med., 28
(3), 259
–266
(2001). http://dx.doi.org/10.1002/(ISSN)1096-9101 LSMEDI 0196-8092 Google Scholar
C.-Y. Wang et al.,
“Autofluorescence spectroscopy for in vivo diagnosis of DMBA-induced hamster buccal pouch pre-cancers and cancers,”
J. Oral. Path. Med., 32
(1), 18
–24
(2003). http://dx.doi.org/10.1034/j.1600-0714.2003.00049.x JPMEEA 0904-2512 Google Scholar
M. F. Haque et al.,
“Immunolocalization of cytokines and growth factors in oral submucous fibrosis,”
Cytokine, 10
(9), 713
–719
(1998). http://dx.doi.org/10.1006/cyto.1997.0342 CYTIE9 1043-4666 Google Scholar
P. Diagaradjane et al.,
“Autofluorescence characterization for the early diagnosis of neoplastic changes in DMBA/TPA-induced mouse skin carcinogenesis,”
Lasers Surg. Med., 37
(5), 382
–395
(2005). http://dx.doi.org/10.1002/(ISSN)1096-9101 LSMEDI 0196-8092 Google Scholar
I. Pathak et al.,
“Detection of squamous neoplasia by fluorescence imaging comparing porfimer sodium fluorescence to tissue autofluorescence in the hamster cheek-pouch model,”
Am. J. Surg., 170
(5), 423
–426
(1995). http://dx.doi.org/10.1016/S0002-9610(99)80321-3 AJOOA7 0096-6347 Google Scholar
C.-Y. Wang et al.,
“A probability-based multivariate statistical algorithm for autofluorescence spectroscopic identification of oral carcinogenesis,”
Photochem. Photobiol., 69
(4), 471
–477
(1999). http://dx.doi.org/10.1111/php.1999.69.issue-4 PHCBAP 0031-8655 Google Scholar
G. M. Palmer et al.,
“Comparison of multiexcitation fluorescence and diffuse reflectance spectroscopy for the diagnosis of breast cancer,”
IEEE Trans. Biomed. Eng., 50
(11), 1233
–1242
(2003). http://dx.doi.org/10.1109/TBME.2003.818488 IEBEAX 0018-9294 Google Scholar
N. Ramanujam et al.,
“Cervical precancer detection using multivariate statistical algorithm based on laser-induced fluorescence spectra at multiple excitation wavelengths,”
Photochem. Photobiol., 64
(4), 720
–735
(1996). http://dx.doi.org/10.1111/php.1996.64.issue-4 PHCBAP 0031-8655 Google Scholar
G. R. Lanckreit et al.,
“A statistical framework for genomic data fusion,”
Bioinformatics, 20
(16), 2626
–2635
(2004). BOINFP 1367-4803 Google Scholar
G. R. Lanckreit et al.,
“Kernel-based data fusion and its application to protein function prediction in yeast,”
Proc. of the Pacific Symposium on Biocomputing, 300
–311 World Scientific Press, Kohala Coast, Hawaii
(2004). Google Scholar
P. Pavlidis et al.,
“Learning gene functional classifications from multiple data types,”
J. Comput. Biol., 9
(2), 401
–411
(2002). http://dx.doi.org/10.1089/10665270252935539 JCOBEM 1066-5277 Google Scholar
|
||||||||||||||||||||||||||||||||||||||||||||||||||||||||||||||||||||||