
|
|
1.IntroductionSpectroscopy methods are increasingly being used as a tool for characterization of aqueous and biological samples.1,2 Bacterial detection,3 optical properties of biological tissues,4 and cell morphology of cultured monolayers1 have been reported to date. All living cells contain deoxyribonucleic acid (DNA), glucose, sucrose, lipids, fat, and water. To determine the cell morphology and physical condition, it is important to know the behavior of the individual contents and their interaction with water. Veiseh et al.3 demonstrated cell spectroscopy in the infrared region, by differentiating the absorbance peak for various concentrations of lipopolysaccharide (LPS). However, the system produced measurement anomalies, in which the peak shifted with varying concentration. Nagai et al.5 demonstrated terahertz (THz) time-domain attenuated total reflection spectroscopy of sucrose solution in water. However, the variation of dielectric function was not consistent over the entire range of sucrose solution concentrations investigated. Presently, there is a great deal of interest in developing spectroscopy systems in the THz regime for polar liquids including biological samples in an aqueous medium.1,6–8. Biological and aqueous samples produce specific features in the THz band.2,9–11 However, THz spectroscopy suffers from high absorption in biological samples due to water content.1 Transmission and reflection mode THz spectroscopy have been reported to date.12,13 However, the bandwidth is limited to 3 THz, due to the limited signal strength at higher frequency. Here, a device for performing vector transmission spectroscopy on biological specimens is demonstrated. Data from aqueous solutions of sucrose, salmon and herring DNA, and Bovine serum albumin (BSA) at THz frequencies is presented. The device consists of a silicon grating structure, where the aqueous solutions fill the space between the tines of the grating. The grating grooves also act as microfluidic channels. The grating behaves as a uniform dielectric when the period is sufficiently small compared to the operating wavelength. The device enables the direct measurement of the complex dielectric function across the THz band by measuring two scalar transmission spectra, using perpendicular linear polarized radiation in a Fourier transform infrared spectrometer (FTIR). Because, the loss in silicon is smaller, the overall transmission will be higher, even for very lossy solutions. The resulting increase in signal strength improves the measurement accuracy and the bandwidth significantly. By modifying the grating period and depth, the operating band of the device can be adapted significantly. 2.Experimental Methods and Setup2.1.Artificial Dielectric and Transmission Equation Through Multilayer DeviceA non-dispersive artificial dielectric can be made using a grooved grating with a grating-vector k and period , where is the measurement wavelength, as shown in Fig. 1. The effective permittivity in the grating plane is determined by the material from which the grating is made, the external material that fills the grating grooves and the grating fill-factor, , where is the solid portion of the grating. Using zero-order effective medium theory the effective permittivity for the transverse electric (TE) mode, where E⊥k, and transverse magnetic (TM) mode, where E‖k, can be estimated.14 For a grating where the substrate has relative permittivity , and the external medium has a relative permittivity , the effective permittivities for the TE and TM modes are and respectively.Fig. 12-D cross section of the spectroscopic device. (a) Perpendicular to grating and (b) parallel to grating.  We have developed the transmission equation of an electromagnetic wave through a multilayer dielectric.15–17 For completeness, some of the key equations are presented below. Using admittance , propagation constant , and grating depth , a transmission matrix can be developed for the grating layer in TE/TM mode that is given by A total matrix can be produced by multiplying the individual layer matrix (silicon on both sides of grating). If the device has air either side of it (the input and output medium), the transmission coefficient, , for the mode is given by: the magnitude of which in the TE and TM modes is given by, where is the admittance of air and is the complex conjugate of .2.2.Fabrication of the Silicon Grating and CapA 450-μm thick silicon wafer, polished on both sides, with a resistivity of 3 to was used for the fabrication of the grating. The wafer was spin-coated with positive tone photo resist and exposed using a chrome mask plate in a Suss Microtech MA6. The pattern was developed and hard baked at 120°C for 30 min in an oven. A short plasma ash was used to remove any thin layer of resist in the opening. The device was etched by deep reactive ion etching for 9 min at a rate of . Reservoirs as shown in Fig. 2(b) were also etched at the same time to equal depth. The details of the fabrication have already been described.18 A scanning electron micrograph and a photographic image are shown in Fig. 2. The grating area was , and the depth was 35 μm. and were 20 μm and 0.48, respectively as shown in Fig. 2(a). A 450-μm thick silicon cap was made with two holes at two ends, as shown Fig. 2(c). 2.3.Sample Preparation and Measurement SetupWe studied solutions of sucrose in water at concentration of 12.5% to 50% by weight. The sucrose was bought from Sigma-Aldrich.19 In order to ensure complete solution of the sucrose, the mixtures were heated up to a temperature of 70°C and magnetically stirred during heating then cooled. Salmon and herring double stranded (ds) DNA and BSA protein solution in water were also made. No heat was used to make these solutions. The concentration of DNA was in the range 0.1% to 0.5% by weight, while for BSA, it was 0.05% to 0.1%. A Bruker series FTIR system was used for the experiment. An optical image of the sample holder, including linear polarizer, sample and mirror orientation is shown in Fig. 3. A description of the measurement setup is presented in an earlier piece of work.17 All measurements were carried out at 23°C. The operating frequency of the measurement setup is 2.0 to 5.5 THz. The lower and upper frequency is defined by the FTIR source and grating period, respectively. The uniformity of the electromagnetic field through the grating is verified by simulation.17 Fig. 3The measurement setup in the FTIR chamber. The sample under test is the device shown in Fig. 2(c).  3.Results and DiscussionsWe measured the scalar quantities TTE and TTM for a grating with depth filled with the sample liquid. Since we know the dielectric constant of the silicon and other grating parameters, we may therefore use Eq. (5) to calculate . The unknown parameters were calculated using the equation solver tool in Matlab.20 The grating structure may have some influence on the measured spectrum; therefore an empty cell filled with air was measured first. All subsequent measurements were corrected against air by subtraction. However, there are some ripples in the spectra which may arise from the Fabry–Perot resonance and Matlab solver. Prior to commencing experiments on different specimens, we tested a device by making several measurements between reloads with a deionized (DI) water sample. The results are accurate within an error band of from the average value. In addition to the deviation mentioned above, there can be some variations from device to device. However, each data, set presented in this article, was taken from a single device. Using the device, several concentrations of sucrose in DI water have been studied. The measured absolute values of the real and imaginary parts of the dielectric function in the range of 2 to 5.5 THz are shown in Fig. 4(a) and 4(b). It can be seen that both the real and imaginary part of dielectric function decrease with increasing concentration of sucrose. However, the imaginary part shows consistent and relatively high variation with increasing concentration. Sucrose is a nonpolar material, which reduces the polarization of the aqueous solution.21 Therefore, the transmission loss, i.e., the imaginary part of dielectric function is reduced with increasing concentration of sucrose in water. The trend is consistent with results presented below 1 THz, for similar materials, such as sugar.12 Fig. 4The variation of dielectric function with varying concentration of sucrose. (a) The real part and (b) imaginary part. 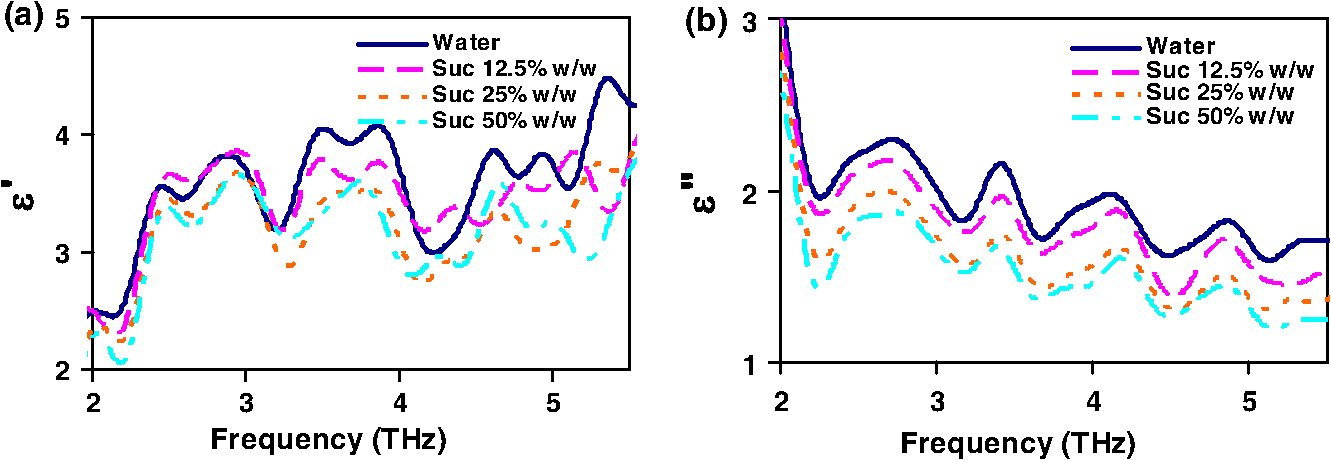 Due to the importance of disease diagnosis, drug discovery, and genetic invention, the characterization of DNA interaction with water has received a great deal of attention. In addition to the differentiation of various DNA, quantifying the DNA concentration in water is also very important. The real and imaginary parts of the dielectric functions from our measurements are shown in Fig. 5. It can be seen that both the real and imaginary part of the dielectric function are increased with increasing concentration of DNA in water. The DNA strands are made from alternating phosphates and sugar residues. The asymmetric end of the DNA strands are 5’ and 3’, where terminal phosphate and hydroxyl group are attached, respectively. Due to the presence of this hydroxyl group, the DNA molecule is chemically polarized, and increase the loss in THz spectra. Therefore, the dielectric loss increased with increasing concentration of DNA in water. By comparing the dielectric function at a specific frequency or a bandwidth, the concentration of the DNA can be found from a solution. The increase in loss with DNA is supported by Bhattacharya et al. in infrared region,22 and Swicord et al. in microwave region.23 In addition, Swicord et al.,23 reported that an increase in absorption may occur due to shorter chain length of DNA. Shorter DNA strands will, for the same weight, be more numerous in number, and this may account for the increased loss. The average chain length of salmon DNA is ,24 and herring DNA is .25 These data support our measured results. Fig. 5The variation of dielectric function with varying concentration of salmon DNA. (a) The real part, (b) imaginary part and herring DNA (c) real part, and (d) imaginary part.  BSA has various biochemical applications, such as immunohistochemistry, cell culture, and determining the quantity of other proteins. It is believed that the 3-D structure of BSA is similar to the crystal structure of human serum albumin26; therefore the characterization of BSA in water is valuable. We have measured dielectric spectra of the BSA protein dissolved in DI water. The real and imaginary parts of the dielectric function are shown in Fig. 6. It can be seen that although the variation of the real part is not significant, the imaginary part of the dielectric function consistently increases with increasing concentration of BSA. The BSA protein contains amino acid residue. Depending on the side chains, the amino acid can be polar or non-polar. The amino acid is hydrophilic when the side chain is polarized. Since BSA is soluble in water, it is chemically polarized. Due to the polarization, the dielectric loss will increase with increased concentration of BSA protein in water. The increase in the loss that we observe, is similar to the results published at lower frequencies (20 to 160 MHz) measured by ultrasonic spectroscopy,27 and in the ultra violet-visible frequency spectrum measured by fluorescence spectroscopy.28 Fig. 6The variation of dielectric function with varying concentration of BSA. (a) The real part and (b) imaginary part.  In addition to the dielectric function at a specific frequency, we can also use the average dielectric function over a frequency band to estimate the concentration of any specific material in a solution.12 The error in the data will be substantially reduced from the 3% error as a consequence of arithmetic averaging. We have averaged the dielectric function in the range 3.0 to 4.0 THz and 4.5 to 5.5 THz for various concentrations of sucrose and salmon DNA, respectively. The resulting data shows clear trends in the value of and as a function of the concentration. The data, together with a linear fit, is shown in Fig. 7. Fig. 7The average dielectric for various concentration of (a) sucrose-water, 3.0 to 4.0 THz and (b) salmon DNA-water, 4.5 to 5.5 THz, with best-fit curve.  The average data with the fitted curve are shown in Fig. 7. The linear functions for the real and imaginary part, respectively, that fit the curves for sucrose are, and where , , , and and is the percentage of sucrose in the water–sucrose mixtures by weight. The respective fit functions for salmon DNA are, and where , , , and and is the percentage of salmon DNA in the water-DNA mixtures by weight. From the above equations and the fitted constants, we can estimate the dielectric function for a known concentration of sucrose or DNA. Conversely, from a known dielectric function we can in principle estimate the amount of sucrose or DNA in a mixture of the specific material in water.4.ConclusionsWe have presented a spectroscopic method using an artificial dielectric, consisting of a grating structure in silicon. The device can measure the complex dielectric function of a liquid specimen using a commercial FTIR. The transmitted signal through the grating structure, when filled with a polar liquid, such as water is improved significantly due to structure of the device. The higher signal level improves the measurement bandwidth and accuracy. The measured frequency range is 2 to 5.5 THz, and can in principle be adapted for lower or higher frequency by manipulating the grating depth and period. We have used this device to analyze complex liquids such as sucrose solution in water and the device can be used to quantify the concentration. We have further demonstrated the capability of the device for other biological solutions that are of great interest, and performed spectroscopy of salmon DNA and herring DNA, and BSA protein. These solutions are all strongly absorbing in the THz band. The device can satisfactorily differentiate various concentrations of specific material in water when averaging is performed over selected frequency bands. The device will enable further spectroscopic studies of lossy biological specimens using widely available FTIR equipment. ReferencesH.-B. Liu et al.,
“Sensing minute changes in biological cell monolayers with THz differential time-domain spectroscopy,”
Biosens. Bioelectron., 22
(6), 1075
–1080
(2007). http://dx.doi.org/10.1016/j.bios.2006.02.021 BBIOE4 0956-5663 Google Scholar
J.-H. Son,
“Terahertz electromagnetic interactions with biological matter and their applications,”
J. Appl. Phys., 105
(10), 102033
(2009). http://dx.doi.org/10.1063/1.3116140 JAPIAU 0021-8979 Google Scholar
M. Veiseh et al.,
“Single-cell-based sensors and synchrotron FTIR spectroscopy: a hybrid system towards bacterial detection,”
Biosens. Bioelectron., 23
(2), 253
–260
(2007). http://dx.doi.org/10.1016/j.bios.2007.04.010 BBIOE4 0956-5663 Google Scholar
G. J. Wilmink et al.,
“Development of a compact terahertz time-domain spectrometer for the measurement of the optical properties of biological tissues,”
J. Biomed. Opt., 16
(4), 047006
(2011). http://dx.doi.org/10.1117/1.3570648 BOEICL 2156-7085 Google Scholar
M. Nagai et al.,
“Terahertz time-domain attenuated total reflection spectroscopy in water and biological solution,”
J. Infrared Millim. Wave., 27
(4), 505
–515
(2006). 1001-9014 Google Scholar
B. Born and M. Havenith,
“Terahertz dance of proteins and sugars with water,”
J. Infrared Millim. THz waves , 30
(12), 1245
–1254
(2009). Google Scholar
S. Y. Huang et al.,
“Tissue characterization using terahertz pulsed imaging in reflection geometry,”
J. Phys. Med. Biol., 54
(1), 149
–160
(2009). http://dx.doi.org/10.1088/0031-9155/54/1/010 PHMBA7 0031-9155 Google Scholar
C. Kistner et al.,
“Hydration dynamics of oriented DNA films investigated by time-domain terahertz spectroscopy,”
Appl. Phys. Lett., 90
(23), 233902
(2007). http://dx.doi.org/10.1063/1.2743401 APPLAB 0003-6951 Google Scholar
A. Abbas et al.,
“Cold plasma functionalized TeraHertz BioMEMS for enzyme reaction analysis,”
Biosens. Bioelectron., 25
(1), 154
–160
(2009). http://dx.doi.org/10.1016/j.bios.2009.06.029 BBIOE4 0956-5663 Google Scholar
J.-I. Nishizawa, T. Sasaki and T. Tanno,
“Coherent terahertz-wave generation from semiconductors and its applications in biological sciences,”
J. Phys. Chem. Solids, 69
(2–3), 693
–701
(2008). http://dx.doi.org/10.1016/j.jpcs.2007.07.109 JPCSAW 0022-3697 Google Scholar
P. H. Siegel,
“Terahertz technology in biology and medicine,”
IEEE Trans. MTT, 52
(10), 2438
–2447
(2004). http://dx.doi.org/10.1109/TMTT.2004.835916 0018-9480 Google Scholar
P. Jespen, U. Moller and H. Merbold,
“Investigation of aqueous alcohol and sugar solutions with reflection terahertz time-domain spectroscopy,”
Opt. Exp., 15
(22), 14717
–14737
(2007). http://dx.doi.org/10.1364/OE.15.014717 OPEXFF 1094-4087 Google Scholar
A. J. Baragwanath et al.,
“Silicon based microfluidic cell for terahertz frequencies,”
J. Appl. Phys., 108
(1), 013102
(2010). http://dx.doi.org/10.1063/1.3456175 JAPIAU 0021-8979 Google Scholar
S. M. Rytov,
“Electromagnetic properties of a finely stratified medium.,”
Sovt. Phys. JETP, 2 466
–475
(1956). Google Scholar
M. Born and E. Wolf, Principles of Optics, 7th ed.Cambridge University Press, Cambridge
(1999). Google Scholar
T. Globus, G. Ganguly and P. Cabarrocas,
“Optical characterization of hydrogenated silicon thin films using interference technique,”
J. Appl. Phys., 88
(4), 1907
–1915
(2000). http://dx.doi.org/10.1063/1.1305855 JAPIAU 0021-8979 Google Scholar
S. C. Saha et al.,
“Terahertz frequency-domain spectroscopy method for vector characterization of liquid using an artificial dielectric,”
IEEE Trans. Terahertz Sci. Technol., 2
(1), 113
–122
(2012). Google Scholar
S. C. Saha et al.,
“Low-loss terahertz artificial birefringent quarter wave plates,”
IEEE Photon. Technol. Lett., 22
(2), 79
–81
(2010). http://dx.doi.org/10.1109/LPT.2009.2036242 IPTLEL 1041-1135 Google Scholar
Sigma-Aldrich Company, Fancy Road, Dorset, BH12 4QH, UK. http://www.sigmaaldrich.com/united-kingdom.html Google Scholar
M. Asadi, Beet-Sugar Handbook, 53 Wiley-Interscience, Hoboken, New Jersey
(2007). Google Scholar
S. Bhattacharya, G. Mandal and T. Ganguly,
“Detailed spectroscopic investigations to reveal the nature of interaction of anionic porphyrin with calf thymus DNA,”
J. Photoch. Photobio. B, 101
(1), 89
–96
(2010). http://dx.doi.org/10.1016/j.jphotobiol.2010.06.016 JPPBEG 1011-1344 Google Scholar
M. L. Swicord et al.,
“Chain-length-dependent microwave absorption of DNA,”
Biopolymers, 22
(12), 2513
–2516
(1983). http://dx.doi.org/10.1002/(ISSN)1097-0282 BIPMAA 0006-3525 Google Scholar
X. Li, J. Zhang and H. Gu,
“Adsorption and desorption behaviors of DNA with magnetic mesoporous silica nanoparticles,”
Langmuir, 27
(10), 6099
–6106
(2011). http://dx.doi.org/10.1021/la104653s LANGD5 0743-7463 Google Scholar
A. J. Hodrien et al.,
“Adsorption of DNA onto positively charged amidine colloidal spheres and the resultant bridging interaction,”
Biol. Macromol., 41
(2), 146
–153
(2007). http://dx.doi.org/10.1016/j.ijbiomac.2007.01.009 BIMSBE 0067-8775 Google Scholar
M. Mernea et al.,
“Protein association investigated by THz spectroscopy and molecular modeling,”
Proc. SPIE, 7376 73760O
(2010). http://dx.doi.org/10.1117/12.871159 PSISDG 0277-786X Google Scholar
J. W. M. Povey et al.,
“Investigation of bovine serum albumin denaturation using ultrasonic spectroscopy,”
Food Hydrocolloids, 25
(5), 1233
–1241
(2011). http://dx.doi.org/10.1016/j.foodhyd.2010.11.011 FOHYES 0268-005X Google Scholar
B. Ojha and G. Das,
“Role of hydrophobic and polar interactions for BSA–amphiphile composites,”
Chem. Phys. Lipids, 164
(2), 144
–150
(2011). http://dx.doi.org/10.1016/j.chemphyslip.2010.12.004 CPLIA4 0009-3084 Google Scholar
|


