

|
|
1.IntroductionCerebral autoregulation refers to the regulatory properties of the brain’s vascular bed to maintain constant cerebral blood flow (CBF) despite changes in blood pressure, over a wide range of blood pressures.1 When changes in mean arterial pressure (MAP) result in concordant changes in CBF, the cerebral circulation is deemed “pressure passive” and cerebral autoregulation is considered to be no longer intact. Various approaches have been used to assess the status of cerebral autoregulation by considering the relationship between spontaneous fluctuations in MAP and CBF surrogates either in the time or frequency domain.2,3 Methods in the time domain include the calculation of linear Pearson’s correlation between consecutive samples of averaged MAP and CBF surrogates to determine a correlation index. For example, Czosnyka et al. used the moving correlation coefficient between the MAP and intracranial pressure (ICP) to obtain an index (pressure-reactivity index, PRx), which quantifies cerebrovascular reactivity with the strength of linear correlation between fluctuations in the two parameters.4 This index was reported to correlate with indices of autoregulation based on cerebral blood flow velocity (CBFV) measurements using transcranial Doppler ultrasonography.5,6 A positive correlation between MAP and CBFV indicates disrupted autoregulation, while a negative correlation implies that autoregulation is intact. Brady et al. used this method of moving linear correlation between MAP and tissue oxygen saturation (TOS) measured by near infrared spectroscopy (NIRS) to assess cerebral autoregulation in children supported on cardiopulmonary bypass (CPB) during surgery for correction of congenital heart defects.7 The purpose of the study was to use the method as a means of determining the lower limits of MAP below which paediatric patients on CPB might be at risk for brain injury. Typical frequency methods for investigating the regulation of cerebral haemodynamics include power spectral analysis under various physiological or pathological conditions.8,9 However, large inter-subject variability is often found in these absolute measurements of power spectra, which makes statistical differences hard to achieve. Transfer function and coherence analysis have been developed as methods to quantify the frequency dependent covariation of MAP and CBF. These methods rely on the presence of oscillations in MAP and CBF surrogates. The transfer function assumes that autoregulation mechanisms can be described by a linear dynamic system with arterial blood pressure as input and blood flow velocity as output. The transfer magnitude, or gain, quantifies the damping effect between the input and the output of the transfer function. A low gain indicates an efficient autoregulation, whereas an increase in gain represents a diminished efficiency of the dynamic process of cerebral autoregulation. The phase shift between the two signals is another parameter obtained from the transfer function analysis with a positive phase shift indicating an intact autoregulation. The coherence function describes the linearity of the relation between the input (MAP) and output (CBF) signals. High coherence values can be anticipated when autoregulation is impaired. Transfer function analysis was used to study the concordance between MAP and NIRS parameters in premature infants.10,11 Wong et al. used transfer function and coherence to quantify the relation between MAP and NIRS parameters in the slow oscillations region () in clinically sick preterm infants and concluded that high coherence is associated with mortality.12 The use of correlation, coherence and partial coherence between MAP and NIRS parameters as clinical outcome predictors in preterm infants was also investigated in Ref. 13. The measures based on Pearson’s correlation coefficient despite their appealing simplicity and proven clinical significance, are inherently incapable of taking into account non linear effects. In fact, studies emphasize that cerebral autoregulation is a stochastic, nonlinear dynamic process.14–18 The transfer function analysis suffers from the big drawback of averaging out all the potential useful time information, hence treating cerebral autoregulation as a stationary, linear process. To overcome this drawback, it is natural to consider time-frequency analysis which combines the advantages of both time and frequency domain analysis. Unlike the Fourier transform, the continuous wavelet transform (CWT) possesses the ability to construct a time-frequency representation of a signal that offers very good time and frequency localization. Latka et al. used the complex Mortlet wavelet with the CWT to compute the instantaneous phase of the CBFV and MAP signals and obtain a synchronization index between the two signals, defined as the standard deviation of the phase difference.19 Besides investigating the instantaneous phase difference, wavelet cross-correlation (WCC) was introduced as the cross-correlation between CWT coefficients of MAP and oxyhaemoglobin () as obtained by NIRS.20 Compared to ordinary cross-correlation, WCC is also a measure of similarity between two time series, but localized to different frequencies. This CWT-based technique was used to analyse the coupling between oscillations in MAP and in both autonomic failure patients and age matched controls.20 It has been demonstrated that the frequency (wavelet scale) at where high correlation between MAP and occurs is posture dependent in patients but not in controls. Spectral analysis using wavelets provides a mathematical framework for the analysis of nonstationary effects in cerebral haemodynamics, thus overcoming the restrictions intrinsic to earlier methods. Extracorporeal membrane oxygenation (ECMO) is a heart-lung machine similar to a CPB machine used as a life support system for infants and children with intractable cardio-respiratory failure. The severity of illness that precipitates the initiation of ECMO, as well as the risks associated with the procedure itself, have raised concerns about morbidity among the survivors. Intracerebral complications are the largest cause of morbidity and mortality in these patients, with the reported frequency of abnormal neuroimaging ranging from 28% to 52% depending on techniques and methods of classification.21 Initiation of ECMO involves cannulation of the major great vessels-right common carotid artery and internal jugular vein-which may cause lateralising cerebrovascular injury. Several studies noted an increase in injuries to the right hemisphere in infants who underwent ligation of the right carotid artery.22–24 Other studies, however, showed no selective or greater injury to the right hemisphere as compared with the left.25–27 Furthermore, most ECMO infants suffer from hypoxia, asphyxia, and hypercarbia, prior to the induction of ECMO. All these physiological changes can disrupt cerebral autoregulation leaving the cerebral microcirculation vulnerable to alterations in systemic blood pressure. To date, the focus of NIRS studies on ECMO patients have been concentrated on relative and absolute changes in the amplitudes of NIRS parameters during vessel ligation and alterations in the ECMO flows.28,29 Furthermore, single or dual channel systems have been used in these studies with optodes usually place on the forehead which monitor only a small area of the anterior frontal lobe. In a previous study, we have used a dual NIRS system and showed the presence of oscillations related to vasomotion, mechanical oscillations from the ECMO pump, respiration rate, and heart rate.9 Slow oscillations in the vasomotion range were observed in the peripheral circulation and not in the brain of a number of ECMO patients while in other cases the slow oscillations appeared in both peripheral and cerebral circulations. Preliminary results using a multichannel NIRS system indicate regional variation in cerebral oxygenation responses during ECMO flow changes.30 Here, we are investigating the use of WCC as a method to study the concordance between multisite cerebral oxyhaemoglobin concentration measures and MAP in order to assess regional variations in cerebral autoregulation in neonates supported on ECMO. The long term aim of our work is the continuous bedside, noninvasive, real time assessment of regional dynamic cerebral autoregulation that will potentially aid clinical management of infants and children supported on extracorporeal circulation. 2.Methods2.1.SubjectsThe study was approved by the UCL, Institute of Child Health and Great Ormond Street Hospital for Children NHS Trust Research Ethics Committee. Written informed parental consent was obtained from all participants prior to inclusion in the study. A total of 12 veno-arterial (VA) ECMO patients, age range 1 to 25 days, were monitored during cannulation, decannulation, weaning from ECMO and alterations in the ECMO flows. The results from six out of the twelve patients were used in the wavelet analysis described herein. Data from the rest of the patients were rejected due to poor signal-to-noise ratio or movement artefacts (see Sec. 2.3). The demographics of the six patients are shown in Table 1. All six patients presented here were monitored during alterations in the ECMO flows. Alterations in the ECMO flows refer to successive decrease in the ECMO flow by 10% from the initial flow, approximately every 10 minutes, down to 70% of the initial flow followed by successive increase back to baseline [Fig. 1(a)]. Fig. 1(a) Schematic representation of the ECMO flow protocol. (b) Hitachi ETG-100 source-detector array configuration. (c) A photograph of the custom-built neonatal cap on a veno arterial (VA) ECMO patient.  Table 1Demographics of the patients. All patients studied were supported on VA ECMO on a centrifugal pump.
Note: RCCA=right common carotid artery; IJV=internal jugular vein; RA=right atrium. 2.2.InstrumentationA multichannel continuous wave (CW) near infrared spectroscopy (NIRS) system (ETG-100, Hitachi Medical Ltd., Japan) was used to measure changes in oxyhaemoglobin (), deoxyhaemoglobin (HHb), and total haemoglobin (HbT) concentrations using the modified Beer-Lambert Law. A differential pathlength factor (DPF) of 4.99 was used for the conversion of optical data to haemoglobin concentrations.31 A novel neonatal cap was constructed to accommodate the light sources and detectors. This constitutes five sources, with each source consisting of two laser diodes emitting at two wavelengths in the near infrared region (780 nm and 830 nm), and four avalanche photodiodes as detectors. The sources and detectors are arranged in a with inter-optode distance of 3 cm, i.e., covering an area of . The source-detector configuration is shown in Fig. 1(b) where the spacing between each source-detector pair indicates a channel therefore allowing data to be collected from a total of 12 channels. The source-detector pairs are frequency multiplexed which allows all of the sources to be illuminated simultaneously. The custom-built neonatal cap, shown in use in Fig. 1(c), is made from silicone rubber (RTV T30). This design makes it light and flexible allowing it to be adjusted with ease and to fit a range of head shapes and sizes. Multimodal data were collected synchronously with the optical data that included systemic parameters (arterial blood pressure, heart rate [HR], and arterial oxygen saturation ) and ECMO circuit parameters (venous oxygen saturation , arterial saturation at the cannula , ECMO flows, and hematocrit). 2.3.Data AnalysisThe recorded attenuation measurements for each data set were initially inspected and channels that showed evidence of poor signal-to-noise ratio, mismatch in attenuation at the two wavelengths or saturation of the detector were rejected from further analysis. Further data were rejected after converting the attenuation data into haemoglobin concentrations. The time series were divided into sections representing each ECMO flow period. Each section of data was then high pass filtered using a fifth-order Butterworth filter with cut off frequency of 0.008 Hz to remove very slow variations and baseline shift, and subsequently low pass filtered using a fifth-order Butterworth filter with a cut-off frequency of 1 Hz to remove variability in the signal due to the cardiac cycle. In the presence of movement artefacts, indicated by abrupt spikes or discontinuities in the data, the whole section (i.e., flow period) was removed from the data set across all channels. MAP was obtained by trapezoid integration of the arterial blood pressure waveform every 0.2 s, equivalent to sampling frequency of 5 Hz. The time series of MAP was also divided into sections representing each flow period and the signal was filtered using the same cut-off frequencies as the signal. Spectral analysis using wavelets was performed on the multichannel data. The WCC was used as a method to investigate the relation between MAP and . The complex Morlet wavelet was used to calculate the CWT coefficients for each time series, MAP and , using the MatLab (Mathworks, Inc.) wavelet toolbox function .32 While there is a general relationship between the scale () in the wavelet domain and frequency in the Fourier transform, no precise relationship exists. The translation from scale to frequency depends upon the particular choice of wavelet. However, an approximate relationship between wavelet scale and translated frequency, pseudo-frequency, , was computed as: where is the center frequency and is the sampling period. This approximate relationship was previously used by Refs. 19 and 20 to study similar physiological oscillations as reported herein.A scale range with unit spacing from 5 to 100, representing frequencies 0.008 to 1 Hz was used to obtain two complex time series, and for each flow period A to G (see Fig. 1) and across each of the 12 channels. The WCC between MAP and in each channel and for each flow was obtained using the equation below:20 in which denotes the cross-correlation of the wavelet coefficients of the series and at a scale and for a relative time shift and denotes the autocorrelation of the time series for zero time shift. represents the cross-spectral power in the two time series (shifted relative to each other by ) as a fraction of the total power in the two time series. WCC ranges from 0 to 1. At a given wavelet scale, would indicate that the coefficients of the two wavelet transforms are related to each other by a simple scaling factor, suggesting strong synchronization at this frequency.The instantaneous phase difference was calculated using where denotes the complex conjugate. The mean phase difference between the two time series, MAP and was obtained using the circular mean, of the instantaneous phase difference over the duration of a test segment and was calculated using the following:33For each time series pair at each flow period and for each channel, the maximum value of was found within three scale bands: These bands were chosen to overlap with respiration rate (RR), ventilation rate (VR), and slow Mayer-waves (Mw), respectively. The phase circular mean, , at maximum WCC were also calculated within each scale band, for each flow period and each channel. For each scale band a two-way ANOVA followed by post-hoc Tukey and Bonferroni analysis were applied on the mean WCC of the group data in order to assess differences within each flow period and between channels (). In addition, one-way ANOVA followed by post-hoc Tukey and Bonferroni analysis was applied on the group mean scale across channels to assess changes in scale across flow periods (). SPSS (IBM corporation) was used to compute the statistical analysis.3.ResultsFigure 2 shows the raw and MAP data for one VA-ECMO patient from a single channel at baseline (period flow) and minimum ECMO flows (period flow). At minimum flow, the fluctuations in the MAP are synchronized with while this is not observed at baseline flow. Fig. 2Changes in and MAP during a time widow of seven minutes for patient 4 collected from channel 5 at (a) baseline flow (period A) and (b) minimum flow (period D).  In general, WCC between MAP and revealed three distinct peaks within three scale regions. The first peak typically occured at a scale of around 14 (0.36 Hz), the second at a scale around 30 (0.16 Hz), and the third at a scale around 50 (0.1 Hz). These peaks could correspond to the respiration rate (RR), ventlation rate (VR), and Mayer-waves (Mw), respectively. Figure 3 shows a set of typical WCC contours obtained from two patients at baseline flow and minimum flow. For patient 8, WCC shows no distinct peaks at baseline flows indicating no correlation between MAP and . At minimum flow, peaks in the WCC contours are shown at scales 15 (), 29 (), and a relatively weaker peak at scale 55 (). The WCC contour for patient 7 at baseline flow shows a relatively weak peak at a scale 34 (). As with patient 8, correlation between MAP and becomes stronger at minimum flow with the peak at scale 34 spreading to higher Mayer-waves related scales and another peak occuring at scale 10 (). These peaks appear shifted from zero time lag. Fig. 3Wavelet cross-correlation between MAP and for two patients. Low correlation as indicated by blue color is shown at baseline ECMO flows [(a) and (c)] and high correlation as indicated by red color is shown (b) around scales 16 and 30 for patient 8 at minimum flow and (d) around scales 16 and 40 to 80 for patient 7 at minimum flow.  Figure 4 shows the group data for the mean of the maximum WCC within RR band, , for each flow period and for all the 12 channels. By convention, a value of WCC below 0.5 indicates no correlation between MAP and .19,20,34 A sign is used to indicate that lags MAP, i.e., , only for WCC greater than 0.5, i.e., strong correlation between the two signals. A—sign is used to indicate that is leading MAP, i.e., , where . There is a significant difference between across flow periods and between channels, , . The following observations can be made:
Fig. 4Group wavelet cross-correlation between MAP and within scale band , representing respiration rate (RR): (a) at all flow periods across all channels; (b) mean across all flow periods of channels on the right side and symmetrical channels on the left side; and (c) mean of the scale at , , for each flow period across all channels. denotes lagging/leading MAP for ; Statistical significant difference between symmetrical channels on right and left hemispheres (). # Statistical significant differences between flow period E (.  Figure 5 shows the group data for the mean maximum WCC within VR band, , for each flow period and each channel. The results of the group analysis in the VR band are similar to those described above for RR band. There is a significant difference between across flow periods and between channels, , .
Fig. 5Group wavelet cross-correlation between MAP and within scale band , representing ventilation rate (VR): (a) at all flow periods across all channels; (b) mean across all flow periods of channels on the right side and symmetrical channels on the left side; and (c) mean of the scale at , , for each flow period across all channels. denotes lagging/leading MAP for ; Statistical significant difference between symmetrical channels on the right and the left hemispheres (). # Statistical significant differences between flow period D ().  The group data for maximum WCC within Mayer-waves band, , across flows periods and channels is shown in Fig. 6. Mean across flow periods is higher on the right hemisphere than on the left these differences were not found to be statistically significant [Fig. 6(b)]. There is a significant difference between across flow periods but not between channels, , . Analogous to the other two scale bands, the strongest correlation between MAP and is observed at flow period E across all the channels. The scale at which occurs, , is shifted to lower scales as ECMO flow changes from flow period A to F [Fig. 6(c)]. Fig. 6Group wavelet cross-correlation between MAP and within scale band , representing Mayer-waves (Mw): (a) WCCmaxMw at all flow periods across all channels; (b) mean across all flow periods of channels on the right side and symmetrical channels on the left side; and (c) mean of the scale at , , for each flow period across all channels. denotes lagging/leading MAP for ; Statistical significant difference between symmetrical channels on the right and on the left hemispheres (). # Statistical significant differences between flow period A (). 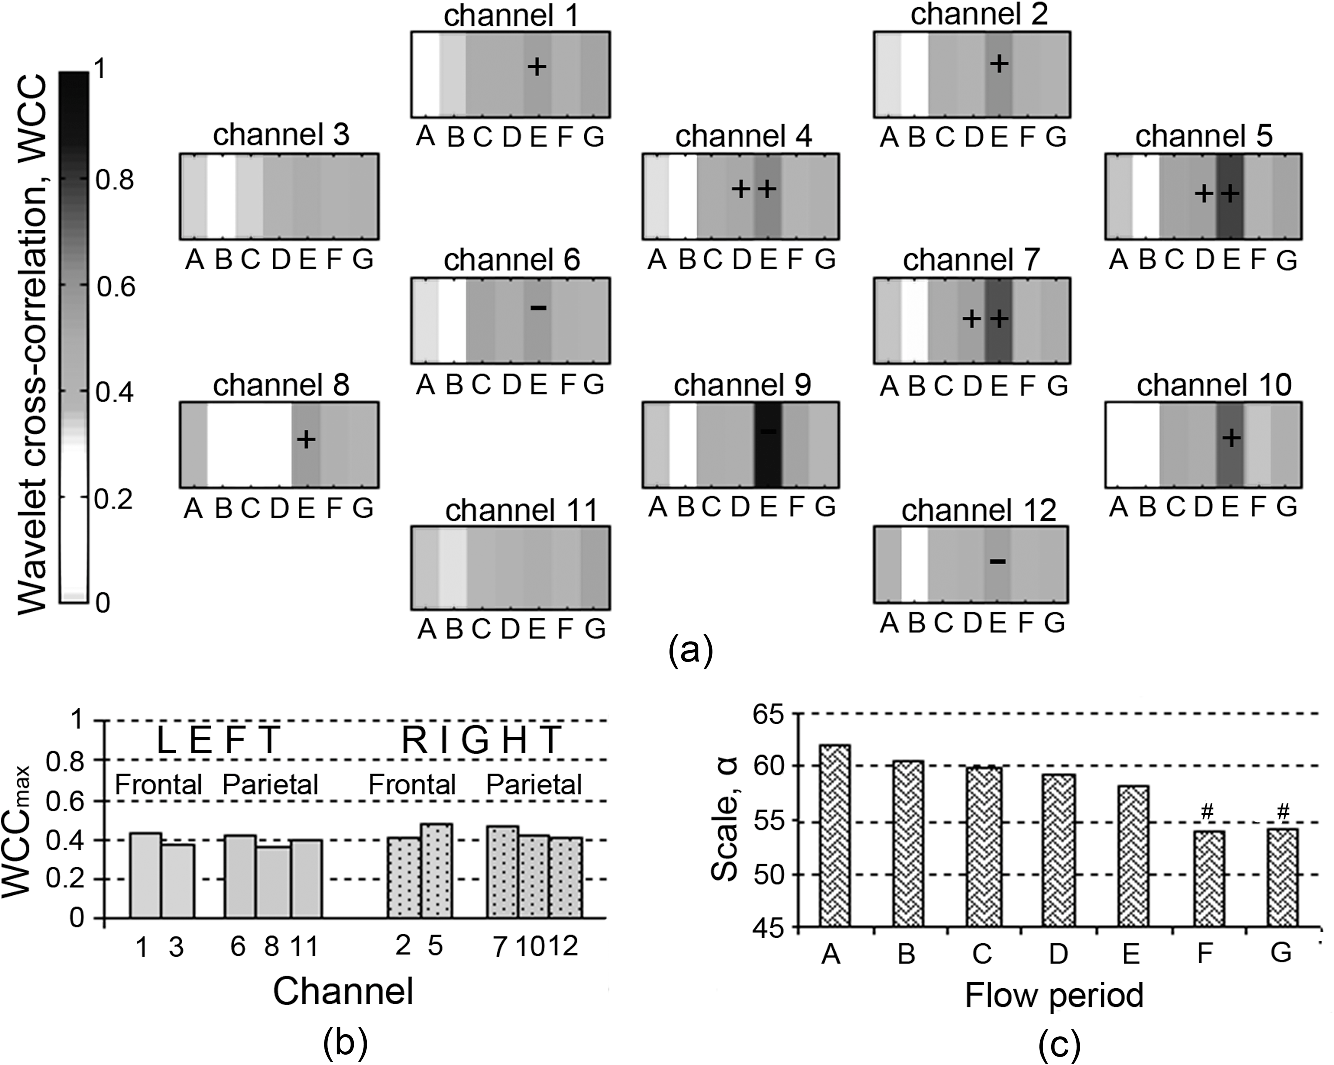 4.DiscussionWCC between MAP and multisite cerebral across 12 channels has been computed for six neonates supported on veno-arterial (VA) ECMO during sequential changes in the ECMO flow. The WCC applied herein typically exhibits three peaks, the first at a scale corresponding to a frequency around 0.33 Hz, the second at a frequency around 0.16 Hz, and the third at a frequency around 0.1 Hz and could correspond to respiration rate (RR), ventilation rate (VR), and Mayer-waves (Mw), respectively. The maximum WCC, within three scale bands around the three frequency peaks were obtained for each ECMO flow period and each channel. Group data showed that appears to be increasing with decreasing ECMO flow and peaks during flow period E, i.e., when the flow is brought back to 80% of the baseline from minimum flow. Even though a decrease in WCC is observed after flow period E, WCC is still typically higher than the baseline flows. Regional variations in WCC were observed between channels potentially placed in the right parietal lobe and left parietal lobes with channels on the right exhibiting significantly higher values of WCC. Our results suggest that the dependence of the fluctuations in MAP and time series is manifested differently in different scales. Generally, correlation was highest in the RR band and lowest in Mw band. The regulation of CBF is effective in the low-frequency range of MAP fluctuations, i.e., respiratory waves (from 0.1 Hz to 0.4 Hz) and slow Mayer-waves (), but not in the high frequency range, i.e., heart rate, because cerebral autoregulation acts primarily via active alteration of the diameter of cerebral arterioles in time scales of a few seconds in healthy individuals.3 Therefore, cerebral autoregulation functions like a high pass filter, allowing rapid MAP changes to be transmitted to CBF, whereas slow MAP changes are filtered.2 Rowley et al.20 also applied WCC between MAP and in adult patients suffering from autonomic failure and age-matched controls and report peaks in WCC around 0.33 Hz and 0.1 Hz which they relate to respiration and Mayer-waves, respectively. These peaks in WCC appeared shifted from zero time lag in autonomic failure patients but not in control subjects. These findings are also in agreement with Latka et al.19 where wavelet analysis was used to obtain a synchronization index in healthy adult volunteers. Even though, these studies do not report a frequency around 0.16 Hz, in another study Latka et al.34 used synchronization index on adult patients with brain injuries and reported high variability of arterial blood pressure around 0.2 Hz as a direct consequence of mechanical ventilation. High WCC ( by convention) indicates that any changes in MAP are mirrored in blood flow, i.e., cerebral blood flow is pressure passive, suggesting that cerebral autoregulation may be impaired. In two out of the six patients monitored during alteration in the ECMO flows, a drop in in the order of 20% was observed at minimum flows. Interestingly, these two patients showed the highest values in WCC compared to the rest of the patients. Outcome and follow up of neonates treated with ECMO have shown that a proportion of ECMO survivors are likely to have medical and developmental issues after discharge and tend to be at high risk for learning and/or behavioral problems in childhood.35 Approximately 15% of ECMO children at age 5 have neurosensory disabilities following neonatal ECMO. Attention, memory, and learning are described as “higher executive brain functions” and are localized in specialized regions of the brain known as the “association cortex” where much more complex information processing is conducted. The association cortex is part of the parietal lobes. 36 Further work could elucidate whether there is a robust link between the regions of the brain where altered WCC were observed and those regions associated with long term neurodevelopmental deficit. A shift in the scale of maximum correlation across flow periods was also observed indicating that cerebral circulation is indeed challenged by changes in ECMO flows. WCC allows us to determine the dependency of the time series, in this case MAP and , on multiple time scales and consequently determine the multiscale nature of the underlying dynamics. It is apparent that the interplay of the fluctuations of MAP and for high frequencies is different from that in the low frequency part of the spectrum. The strong reactivity of cerebral vessels to carbon dioxide arterial content might underlie the respiratory origin of the peak in RR band. The origin of the low frequency, non respiratory oscillation in blood pressure still remains controversial. Current evidence suggests that the baroreflex mechanisms substantially contribute to oscillations in this frequency range.37 Other studies use coherence and transfer function between MAP and HbD (where ) as a NIRS parameter to assess cerebral autoregulation.10,12 However, was previously used by Rowley et al.20 when applying WCC in patients suffering from autonomic failure and age matched controls. In addition, previous work on spectral analysis using Fourier transforms on patients supported on ECMO showed that oscillations in are stronger than in other NIRS parameters.9 The presence of slow spontaneous oscillations may be more significant in the oxyhaemoglobin signal measured by NIRS than in the deoxyhaemoglobin or total haemoglobin signal.38,39 However, Payne and colleagues used both and HbD when calculating the synchronization index, an alternative method based on CWT, and have shown differences between the results of the two parameters.40 It will be interesting however, to apply the method to other NIRS parameters and compare the results between them. WCC decomposes the MAP and signals into wavelet modes which are highly localized in frequency and allows investigation of which modes are most likely linearly related.20 Unlike other methods based on Fourier transforms, i.e., transfer function and coherence, WCC makes no assumption about the stationarity of the relationship between time series, and if other modes of oscillation in cerebral haemodynamics exists which are not driven by systemic variables these will show a low value of wavelet cross correlation. The Fourier transform of the signal yields a function that depends only on frequency, whereas the wavelet transform of that signal depends on both frequency and time. This distinction becomes important since the relation between MAP and signals is a nonstationary stochastic process, in which case the frequency spectrum of the signals changes over time. This time change is ill defined for a Fourier spectrum, but is well defined for a wavelet spectrum. Another important difference between the wavelet transforms and Fourier transforms is frequency resolution. The freqency resolution of a power density spectrum depends on the length of the sliding window in which the fast Fourier tranforms (FFT) are applied. The greater the length of the sliding window (higher number of samples) the higher the resolution but at the expence of lower signal to noise ratio (S/N). Consequently, the length of the sliding window depends on the length and sampling frequency of the signal, i.e., number of sampling points. As a result a high sampling frequncy and a long signal are required to resolve frequencies in the lower range which are of interest when studying cerebral autoregulation. Even if the frequency resolution is high enough it can still be difficult to capture frequencies in the lower range due to low S/N. In contrast to the Fourier transform, the Wavelet transform depends on scale which is inversely related to frequency. Consequently, there is a higher resolution at lower frequencies. Furthermore, WCC is a measure of the level of similarity between two signals in a given frequency band and does not depend upon the power of those signals provided that the time series are compared for a sufficiently long time interval. The WCC is based on the use of the CWT and a sufficient amount of time is needed to generate the results. Analysis using the continuous complex Morlet wavelet transform is significantly longer than the Fourier transform. This imposes an important limitation of the technique if the system is to be used for continuous monitoring at the bedside. In addition, WCC is a bivariate method of analysis and in this case cerebral circulation was only compared with fluctuations in the MAP. However, cerebral circulation is complex.41 It has been suggested that the relation between synchronously measured spontaneous slow waves of perfusion pressure and CBF is vulnerable to confounding influences such as changes in partial pressure.3 Payne and colleagues have recently shown that changes in the arterial blood gases have a direct effect on CBF and can attenuate the cerebral autoregulation response.40 They demonstrated that the phase angle between MAP and changes significantly with partial pressure but much less so with . The limitations of the current WCC method might be overcome by using discrete wavelet packet transforms which allow assessing cerebral autoregulation as a multivariate system that can be calculated instantaneously. 5.ConclusionsWCC between and MAP provides a useful method to investigate the dynamics of global and/or regional cerebral autoregulation. Cerebral autoregulation on ECMO is poorly studied, the most common reason being that that there have been no easy noninvasive methods to study and interpret complex cerebral physiological process such as cerebral autoregulation. There are potential challenges to global and regional cerebral autoregulation whilst supported on ECMO starting from the time of cannulation when the great vessels (artery and vein) on the right side of neck are ligated for cannulation. Multichannel near infrared spectroscopy (NIRS) offers the advantage of a continuous, noninvasive monitoring of regional cerebral oxyhaemoglobin concentration (). The analysis presented herein showed a relationship between WCC and ECMO flow in the grouped data of six patients. These differences were statistically significant between right and left hemispheres, especially when the flows were weaned sequentially by 10% and 20% of the baseline. Furthermore, studies are necessary to elucidate this relationship and to understand regional differences in cerebral autoregulation during different clinical states on ECMO. Multichannel NIRS in conjunction with WCC analysis can be used to form a noninvasive neuromonitoring system which has the potential to assess regional variations in cerebral oxygenation and autoregulation, and hence provide a useful clinical management tool. AcknowledgmentsThe authors would like to thank Hitachi Medical Ltd., Japan for funding the project. IT is supported by the Wellcome Trust (088429/Z/09/Z). We would like to thank Dr Stephen Payne for his technical insights regarding our wavelet analysis. ReferencesL. EdvinssonE. T. McKenzieJ. McCulloch, Cerebral Blood Flow and Metabolism, Raven Press, New York
(1993). Google Scholar
A. Van Beeket al.,
“Cerebral autoregulation: an overview of current concepts and methology with special focus on the elderly,”
J. Cerebr. Blood Flow Metab., 28
(6), 1071
–1085
(2008). http://dx.doi.org/10.1038/jcbfm.2008.13 JCBMDN 0271-678X Google Scholar
M. Czosnykaet al.,
“Monitoring cerebrovascular autoregulation: facts, myths, and missing links,”
Neurocrit. Care, 10
(3), 373
–386
(2009). http://dx.doi.org/10.1007/s12028-008-9175-7 NCEACB 1541-6933 Google Scholar
M. Czosnykaet al.,
“Continuous assessment of the cerebral vasomotor reactivity in head injury,”
Neurosurgery, 41
(1), 11
–19
(1997). NEQUEB Google Scholar
M. Czosnykaet al.,
“Monitoring of cerebral autoregulation in head-injured patients,”
Stroke, 27
(10), 1829
–1834
(1996). http://dx.doi.org/10.1161/01.STR.27.10.1829 SJCCA7 0039-2499 Google Scholar
E. Langet al.,
“Continuous monitoring of cerebrovascular autoregulation: a validation study,”
J. Neurol. Neurosurg. Psychiatry, 72
(5), 583
–586
(2002). http://dx.doi.org/10.1136/jnnp.72.5.583 JNNPAU 0022-3050 Google Scholar
K. Bradyet al.,
“Monitor cerebral blood flow pressure autoregulation in pediatric patients during cardiac surgery,”
Stroke, 41
(9), 1957
–1962
(2010). http://dx.doi.org/10.1161/STROKEAHA.109.575167 SJCCA7 0039-2499 Google Scholar
I. Tachtsidiset al.,
“Investigation of cerebral haemodynamics by near infrared spectroscopy in young healthy volunteers reveals posture-dependent spontaneous oscillations,”
Physiol. Meas., 25
(2), 437
–445
(2004). http://dx.doi.org/10.1088/0967-3334/25/2/003 PMEAE3 0967-3334 Google Scholar
M. D. Papademetriouet al.,
“Cerebral and peripheral tissue oxygenation in infants and children supported on ECMO for cardio-respiratory failure,”
Adv. Exp. Med. Biol., 662 447
–453
(2010). http://dx.doi.org/10.1007/978-1-4419-1241-1 AEMBAP 0065-2598 Google Scholar
M. Tsujiet al.,
“Cerebral intravascular oxygenation correlates with mean arterial pressure in critically ill premature infants,”
Pediatrics, 106
(4), 625
–632
(2000). PEDIAU 0031-4005 Google Scholar
J. S. Soulet al.,
“Fluctuating pressure passivity os common in the cerebral circulation of sick premature infants,”
Pediatr. Res., 61
(4), 467
–473
(2007). http://dx.doi.org/10.1203/pdr.0b013e31803237f6 PEREBL 0031-3998 Google Scholar
F. Y. Wonget al.,
“Impaired autoregulation in preterm infants identified by using spatially resolved spectrscopy,”
Pediatrics, 121
(3), e604
–e611
(2008). http://dx.doi.org/10.1542/peds.2007-1487 PEDIAU 0031-4005 Google Scholar
A. Caicedoet al.,
“Impaired cerebral autoregulation using near-infrared spectroscopy and its relation to clinical outcomes in premature infants,”
Adv. Exp. Med. Biol., 701 233
–239
(2011). http://dx.doi.org/10.1007/978-1-4419-7756-4 AEMBAP 0065-2598 Google Scholar
C. A. GillerM. Mueller,
“Linearity and non-linearity in cerebral haemodynamics,”
Med. Eng. Phys., 25
(8), 633
–646
(2003). http://dx.doi.org/10.1016/S1350-4533(03)00028-6 MEPHEO 1350-4533 Google Scholar
R. B. Panerai,
“Assessment of cerebral pressure autoregulation in humans—a review of measurement methods,”
Physiol. Meas., 19
(3), 305
–338
(1998). http://dx.doi.org/10.1088/0967-3334/19/3/001 PMEAE3 0967-3334 Google Scholar
R. B. PaneraiS. L. DawsonJ. F. Potter,
“Linear and nonlinear analysis of human dynamic cerebral autoregulation,”
Am. J. Physiol. Heart Circ. Physiol., 277
(3 Pt 2), H1089
–H1099
(1999). AJPHAP 0002-9513 Google Scholar
R. B. Paneraiet al.,
“Cerebral blood flow velocity during mental activation: interpretation with different models of the passive pressure-velocity relationship,”
J. Appl. Physiol., 99
(6), 2352
–2362
(2005). http://dx.doi.org/10.1152/japplphysiol.00631.2005 JAPYAA 0021-8987 Google Scholar
G. D. Mitsiset al.,
“Cerebral hemodynamics during orthostatic stress assessed by nonlinear modeling,”
J. Appl. Physiol., 101
(1), 354
–366
(2006). http://dx.doi.org/10.1152/japplphysiol.00548.2005 JAPYAA 0021-8987 Google Scholar
M. Latkaet al.,
“Phase dynamics in cerebral autoregulation,”
Am. J. Heart Circ. Physiol., 289
(5), H2272
–H2279
(2005). http://dx.doi.org/10.1152/ajpheart.01307.2004 Google Scholar
A. B. Rowleyet al.,
“Synchronization between arterial blood pressure and cerebral oxyhaemoglobin concentration investigated by wavelet cross-correlation,”
Physiol. Meas., 28
(2), 161
–173
(2007). http://dx.doi.org/10.1088/0967-3334/28/2/005 PMEAE3 0967-3334 Google Scholar
D. BulasP. Glass,
“Neonatal ECMO: neuroimaging and neurodevelopmental outcome,”
Seminars in Perinatology, 29
(1), 58
–65
(2005). http://dx.doi.org/10.1053/j.semperi.2005.02.009 SEMPDU 0146-0005 Google Scholar
D. Hofkoshet al.,
“Ten years of extracorporeal membrane oxygenation: neurodevelopmental outcome,”
Pediatrics, 87
(4), 549
–555
(1991). PEDIAU 0031-4005 Google Scholar
J. C. MendozaL. L. ShearerL. N. Cook,
“Lateralisation of brain lesions following extracorporeal membrane oxygenation,”
Pediatrics, 88
(5), 1004
–1009
(1991). PEDIAU 0031-4005 Google Scholar
J. S. Hahnet al.,
“Electroencephalographic and neuroimaging findings in neonates undergoing extracorporeal membrane oxygenation,”
Neuropediatrics, 24
(1), 19
–24
(1993). http://dx.doi.org/10.1055/s-2008-1071507 NRPDDB 0174-304X Google Scholar
V. Adolphet al.,
“Developmental outcome of neonates treated with extracorporeal membrane oxygenation,”
J. Pediatr. Surg., 25
(1), 43
–46
(1990). http://dx.doi.org/10.1016/S0022-3468(05)80162-9 JPDSA3 0022-3468 Google Scholar
D. Bulaset al.,
“Neonates treated with ECMO: predictive value of early CT and US neuroimaging findings on short term neurodevelopmental outcome,”
Radiology, 195
(2), 407
–412
(1995). RADLAX 0033-8419 Google Scholar
L. J. GrazianiM. GringlasS. Baumgart,
“Cerebrovascular complications and neurodevelopmental sequelae of neonatal ECMO,”
Clin. Perinatol., 24
(3), 655
–675
(1997). CLPEDL 0095-5108 Google Scholar
J. C. Ejikeet al.,
“Cerebral oxygenation in neonatal and pediatric patients during veno-arterial extracorporeal life support,”
Pediatr. Crit. Care Med., 7
(2), 154
–158
(2006). Google Scholar
A. Van Heijstet al.,
“Oxygenation and hemodynamics in left and right cerebral hemispheres during induction of veno-arterial extracorporeal membrane oxygenation,”
Pediatrics, 144
(2), 223
–228
(2004). http://dx.doi.org/10.1016/j.jpeds.2003.11.006 PEDIAU 0031-4005 Google Scholar
M. D. Papademetriouet al.,
“Regional cerebral oxygenation measured by multichannel near infrared spectroscopy (optical topography) in an infant supported on venoarterial extracorporeal membrane oxygenation,”
J. Thorac. Cardiovasc. Surg., 141
(5), e31
–e33
(2011). http://dx.doi.org/10.1016/j.jtcvs.2011.01.026 JTCSAQ 0022-5223 Google Scholar
A. Duncanet al.,
“Optical pathlength measurements on adult head, calf, and forearm and the head of the newborn infant using phase resolved optical spectrscopy,”
Phys. Med. Biol., 40
(2), 295
–304
(1995). http://dx.doi.org/10.1088/0031-9155/40/2/007 PHMBA7 0031-9155 Google Scholar
J. L. Semmlow,
“The wavelet transform,”
Biosignal and Biomedical Image Processing. MATLAB Based Applications, 177
–212 Marcal Dekker Inc., New York
(2004). Google Scholar
N. I. Fisher, Statistical Analysis of Circular Data, Cambridge University Press, Cambridge
(1995). Google Scholar
M. Latkaet al.,
“Wavelet assessment of cerebrospinal compensatory reserve and cerebrovascular reactivity,”
Physiol. Meas., 28
(5), 465
–479
(2007). http://dx.doi.org/10.1088/0967-3334/28/5/002 PMEAE3 0967-3334 Google Scholar
P. GlassJ. Brown,
“Outcome and follw-up of neonates treated with ECMO,”
ECMO Extracorporeal Cardiopulmonary Support in Critical Care, 319
–328 Extracorporeal Life Support Organization, Ann Arbor, Michigan
(2005). Google Scholar
F. Martini, Fundamentals of Anatomy and Physiology, Pearson Education/Benjamin Cummings, California
(2009). Google Scholar
H. W. Schytzet al.,
“Spontaneous low-frequency oscillations in cerebral vessels: applications to carotid artery disease and ischemic stroke,”
J. Stroke Cardiovasc. Dis., 19
(6), 465
–474
(2010). http://dx.doi.org/10.1016/j.jstrokecerebrovasdis.2010.06.001 1052-3057 Google Scholar
C. Elwellet al.,
“Oscillations in cerebral haemodynamics. Impications for functional activation studies,”
Adv. Exp. Med. Biol., 471 57
–65
(1999). http://dx.doi.org/10.1007/978-1-4615-4717-4 AEMBAP 0065-2598 Google Scholar
H. Obriget al.,
“Spontaneous low frequency oscillations of cerebral hemodynamics and metabolism in human adults,”
Neuroimage, 12
(6), 623
–639
(2000). http://dx.doi.org/10.1006/nimg.2000.0657 NEIMEF 1053-8119 Google Scholar
S. J. Payneet al.,
“Effects of arterial blood gas levels on cerebral blood flow and oxygen transport,”
Biomed. Opt. Express, 2
(4), 966
–979
(2011). http://dx.doi.org/10.1364/BOE.2.000966 BOEICL 2156-7085 Google Scholar
R. B. PaneraiS. L. DawsonJ. F. Potter,
“Linear and nonlinear analysis of human dynamic cerebral autoregulation,”
Am. J. Physiol. Heart Circ. Physiol., 277
(3 Pt 2), H1089
–H1099
(1999). AJPHAP 0002-9513 Google Scholar
|


