
|
|
1.IntroductionDuring the last two decades, nonlinear optical (NLO) microscope techniques experienced an impressive growth in biological and biomedical imaging applications.1 For early detection, screening, diagnosis, and image-guided treatment of life-threatening diseases and cancer, there is a clear need to develop novel imaging techniques to visualize and understand the interactions between cells, extracellular matrix, and stroma in a tissue environment. We believe that these goals can be achieved through the use of NLO methods coupled with high-resolution microscopy. Although the main reason to use NLO microscopy is its ability to observe non stained live cells and deep tissue, it can also be an important tool for stained normal biopsy samples for several reasons. The calibration of a new technique against the gold standard is one good reason. Second, because it allows the automatization of the analysis in clinical pathology that can enhance the productivity in this field. Third, different NLO microscopies, especially when combined, can uncover information not apparent in the hematoxylin and eosin (H&E) section under normal brightfield observations. To prove this statement is one of the goals of this paper. However, for diagnostic purposes new information could be irrelevant, after all, clinical pathology observation under the microscope is a procedure more than 150 years old, since Virchow, and all the medical doctors received a formal training in this area since the beginning of the 20th century. The fact that there is still space for improvements in diagnostics is provided by the example of Matthews’s work.2 They used a new photonic technique capable to discriminate real melanoma, amongst the most deadly diseases, from false melanoma. If one accepts that there is new information available from NLO images and that they could be useful for diagnostics, then it is clear that to reassess H&E, and or fixed but not stained, biopsies is important and would allow us to perform retrospective studies using the huge library of samples available. The legitimacy of diagnostic methods, however, is a long cumulative process of evidences collection provided by reports such as this and its references. One special concern in this case is that biopsy samples cannot be destroyed otherwise life saving diagnostics could not be performed. Finally, the fourth reason is that, besides its usefulness for the diagnostics, NLO microscopy also provides detailed analysis of microanatomy that can help the understanding of several diseases biology. Non linear optical signals depend on the chance to find more than one photon in time and space, which is hugely enhanced by the use of femtosecond pulsed lasers and happens strongly only at the focus of the objective.3 The laser-induced nonlinear light-matter interactions simultaneously generate two photon excitation fluorescence (TPEF) together with second and third harmonic generation (SHG and THG), that can be used as structural visualization contrast mechanisms.4,5 Moreover, the light pulse repetition is a natural clock to perform fluorescence lifetime imaging microscopy (FLIM). Each of these imaging techniques has its own unique approach to imaging which can be suitable to obtain certain biological information. TPEF, for example provides functional information of molecules.6 SHG and THG are endogenous signals preserved for decades in H&E stained samples and can be used to image organized biological subcellular structures and interfaces.7,8 SHG is excellent to observe collagen fibers network in extracellular matrices, features that cannot be directly observed with usual microscopy of H&E stained samples. THG highlights the nuclei in a background free image that makes automatic nuclei counting and size and shape measurements an easy task. Different fluorophores with the same emission band can be discriminated by their fluorescence lifetimes, visualized with FLIM, which enhances the specificity of fluorescence observations. Moreover, FLIM is sensitive to the chemical microenvironment around the fluorophores.9 Even for fixed, but not H&E stained, samples, Conklin and coworkers showed that inferences about the metabolism can be raised by FLIM targeting traces of NAD and FAD molecules left in the sample.10 Usual pathology widefield trans-illumination observations only see, or probe, one-photon absorption and, therefore, cannot directly access all the information described above. Moreover, NLO techniques acquires more chemical selective images that can be superimposed, while transillumination microscopy sees everything requiring a trained eye to discriminate each feature. The fact that each NLO technique provides different and complementary information means that one is required to use a combination of bioimaging methods, often at the same time, for a comprehensive investigation of biological processes. It is known that images of TPEF, SHG, and THG obtained from clinical ‘‘gold standard’’ H&E stained histology slides and FLIM images of fixed, but unstained, sections can provide optical biomarker signatures of diagnostic value.5,10–13 For these reasons, integration of the various techniques is one of the evolving areas in bioimaging. Different modalities of NLO microscopy have been developed and combined for imaging complex tissue samples.14,15 Recently, a multimodal microscopic technique was implemented with a combination of THG, SHG, and TPEF image contrast methods on the same microscope.16 Similarly, in 2011 we built a multimodal microscopy setup combining TPEF, SHG, and THG in the same platform. In that work we used a stored library of H&E stained samples to demonstrate, for the first time, that multicontrast nonlinear microscopy can differentiate between cancerous and healthy ovarian tissue.11 Nevertheless, these homebuilt systems lack the FLIM modality. Other systems have FLIM with TPEF and SHG, but not THG, which would provide another set of biological information. Recently we improved the previous system and incorporate FLIM technique on the same platform,17 showing that such a system combining all these techniques can be very useful. In this paper, we report multimodal NLO microscopy of human epithelial breast and ovarian cancer and osteogenesis imperfecta (OI) disease. For each example we discuss the impact that our technique could have in terms of diagnostics. Among these examples, as far as we know, human invasive lobular carcinoma (ILC) and mucinous carcinoma (MC) have never been studied with NLO techniques before. We demonstrate that integrated TPEF-FLIM-SHG-THG NLO images can be used to detect transformed epithelial cells and abnormal stromal configurations. Using different scoring methods we found significant differences in the distribution and organization of collagen fibrils in the skin and breast and ovarian stroma as well as in the lifetime of the epithelial ovarian cells. Quantitative evaluation was performed by image-pattern analysis of SHG images and lifetime components of FLIM images. The gray-level co-occurrence matrix (GLCM) analysis method allowed the classification of different tissues based on the evaluation of geometrical arrangement of collagen, whereas a pattern analysis of the FFT images allowed the discrimination of different tissues based on the anisotropy of collagen fibers distribution. These scoring methods allowed us to find differences between healthy and tumor tissues. All these quantitative analyses have been performed digitally, showing, therefore, the potential of these techniques for automatic procedures in diagnostics. SHG images of OI disease have been observed in mouse models,18 but, to our knowledge, this is the first demonstration of the use of SHG to detect OI in human samples. Usual OI diagnostics is performed by bone analysis and time consuming genetic tests. An imaging of a skin biopsy would be a much faster diagnostic tool and will allow a screening method to perform long-term DNA sequence for genetic disease research purposes. Therefore, we demonstrated that this system represents a promising tool to be extended to other epithelial cancers and collagen disorders as well as to be used in in-vivo imaging applications. 2.Methods2.1.Human TissuesIn all cases, the biopsies used in this work were removed using international approved protocol with patient consent prior to the procedures. All samples obtained in this study were processed according the following standard histological procedure: fixed in 10% buffered formalin, embedded in paraffin, cut in 4 to 8 μm thick sections. Tissue sections were de-waxed and examined either unstained (for FLIM experiments), or after H&E staining (for TPEF, SHG, and THG experiments) using standard techniques. Each H&E stained tissue section was evaluated by a certified pathologist, based on established World Health Organization histological criteria for cancer classification19 and clinical criteria according to Sillence et al. for OI classification.20 Breast tissues were obtained from a private laboratory “Locus” (www.locus.med.br, São Paulo, Brazil) which meets all international quality controls. A total of 15 breast specimens (obtained from different patients with ages from 35 to 65 years) were analyzed and classified as normal breast tissue (3 cases) or breast tumors [3 fibroadenomas, 3 infiltrating ductal carcinoma (IDC), 3 invasive lobular carcinoma (ILC), and 3 mucinous carcinoma (MC)]. Moreover, ovarian tissues were obtained from women attending a Women’s Health Center CAISM (Campinas, SP, Brazil) and the project was approved by the Institutional Ethics Committee (Faculty of Medical Sciences, Unicamp). A total of 16 ovarian specimens (obtained from different patients with ages from 40 to 75 years) were analyzed in this study and classified as normal ovarian tissue (5 cases) or ovarian mucinous tumors (4 adenomas, 2 borderline type, and 5 adenocarcinomas). Skin samples from patients with OI were obtained from the Laboratory of Pediatric Endocrinology, Campinas, SP, Brazil. This project was also approved by the Institutional Ethics Committee (Faculty of Medical Sciences, Unicamp). A total of 4 skin biopsies were analyzed and classified as normal (2 cases) or OI (type III and IV). The patient with OI type III, a more severe form, is 42 years old with history of multiple fractures after minimal traumas since childhood. Her last fracture was 10 years ago. She presents blue sclera, short stature (1.20 m), deformities in long and vertebral bones and osteoporosis. Her 13-year-old daughter presents similar features and history of multiple fractures since 5 years old. The patient with OI type IV is an 18 year old girl, with dentinogenesis and history of multiple fractures after minimal traumas since 9 years old. Her last fracture was one year ago. She presents normal stature (1.62 m), no bone deformities, and normal bone mineral density. A distant cousin also presents OI. 2.2.Multimodal Nonlinear Platform Setup and Image AcquisitionAll images were acquired with a custom multimodal NLO platform built at the Laboratory for Biophotonics of the State University of Campinas, which was recently described in detail.11,17 However, for this work the platform was improved by adapting FLIM modality in an available side port of the microscope. Now, the system allows image acquisition as shown in Fig. 1. Briefly, the platform was built around an inverted microscope IX-81, equipped with an Olympus FV300 scanner. All signals were excited with a Mai Tai laser from Spectra-Physics. SHG and THG signals were collected in the transmission mode while TPEF and FLIM were collected in the backscattering mode. SHG and THG images were acquired one after the other due to the optical filters exchange, but simultaneously with the backward TPEF signal detected with FV300 scan head photomultiplier tubes (PMT) with the aperture widely open. A high-pass filter (HP) E-690-HP (Omega Filters) reflected the TPEF and FLIM signal to a fast photon-counting PMT (Becker & Hickl, PMH-100). A time correlated single photon-counting [TSPC] card electronics (Becker & Hickl, SPC-830) detector allowed the direct TPEF image acquisition by direct photocounting, which was later processed to obtain the FLIM images in the time domain. The instrument response function (IRF) of the overall system was . TPEF, SHG, and THG images were acquired with a PLANAPO 40X, N.A. 1.3 oil immersion objective (Olympus, Tokyo, Japan) and excited at 940 nm with a Ti:Sapphire Mai Tai HP Spectra-Physics (Irvine, USA) which provides 100 fs pulses with a repetition rate of 80 MHz and powers from 1 to 3.5 W, generating a SHG signal at 470 nm and a THG signal at 313 nm. All the other parameters such as detector gain, offset, and frame averaging were maintained constant between different samples to enable comparative analysis. Images were acquired with spatial resolution, using a pixel dwell time of 5 ms, with total scanning time of order of 3 s, after a 5 frames Kalman filtering. All ImageJ (NIH, available from http://rsb.info.nih.gov/ij) digital processing were performed on the unprocessed images to avoid artifacts. FLIM data were acquired with the 890 nm excitation (5 mW at the sample), which excites mainly the fluorescence of flavin adenine dinucleotide (FAD), and collected for 60 s with a frame size. Becker & Hickl supply two programs, one for capturing image data and a separate program for displaying a lifetime image. The imaging program (SPCImage Ver. 2.9, Becker & Hickl) determines the best exponential fit to the histograms at each pixel and displays lifetime data utilizing a color-mapping scheme. Fig. 1(a) Experimental setup to TPEF, SHG, THG, and FLIM microscopy. Real setup with different detectors and images obtained from a thin section of normal human ovary sample stained with H&E. The principal contrasts produced for each technique are: in green: two-photon excited fluorescence (TPEF); in red: second harmonic generation (SHG); in magenta: third harmonic generation (THG); in blue/green/yellow: fluorescence lifetime image microscopy (FLIM); and MERGE: combination of . In FLIM images, blue and orange colors represent lower and higher fluorescence lifetime, respectively. (b) Simplified optical scheme build. : half wave plate; PBS: polarizing beam splitter; L1-L2: telescope lens; DM: dichroic mirror; LP: lowpass filter; PMT: photomultiplier tubes; and SP: short pass filter. The SHG (red lines) and THG (blue lines) are collected in a transmitted light configuration. The TPEF (green lines) and FLIM (yellow lines) are collected in back-scattering configuration. For interpretation of the references to color in this figure legend, the reader is referred to the online version of this paper. 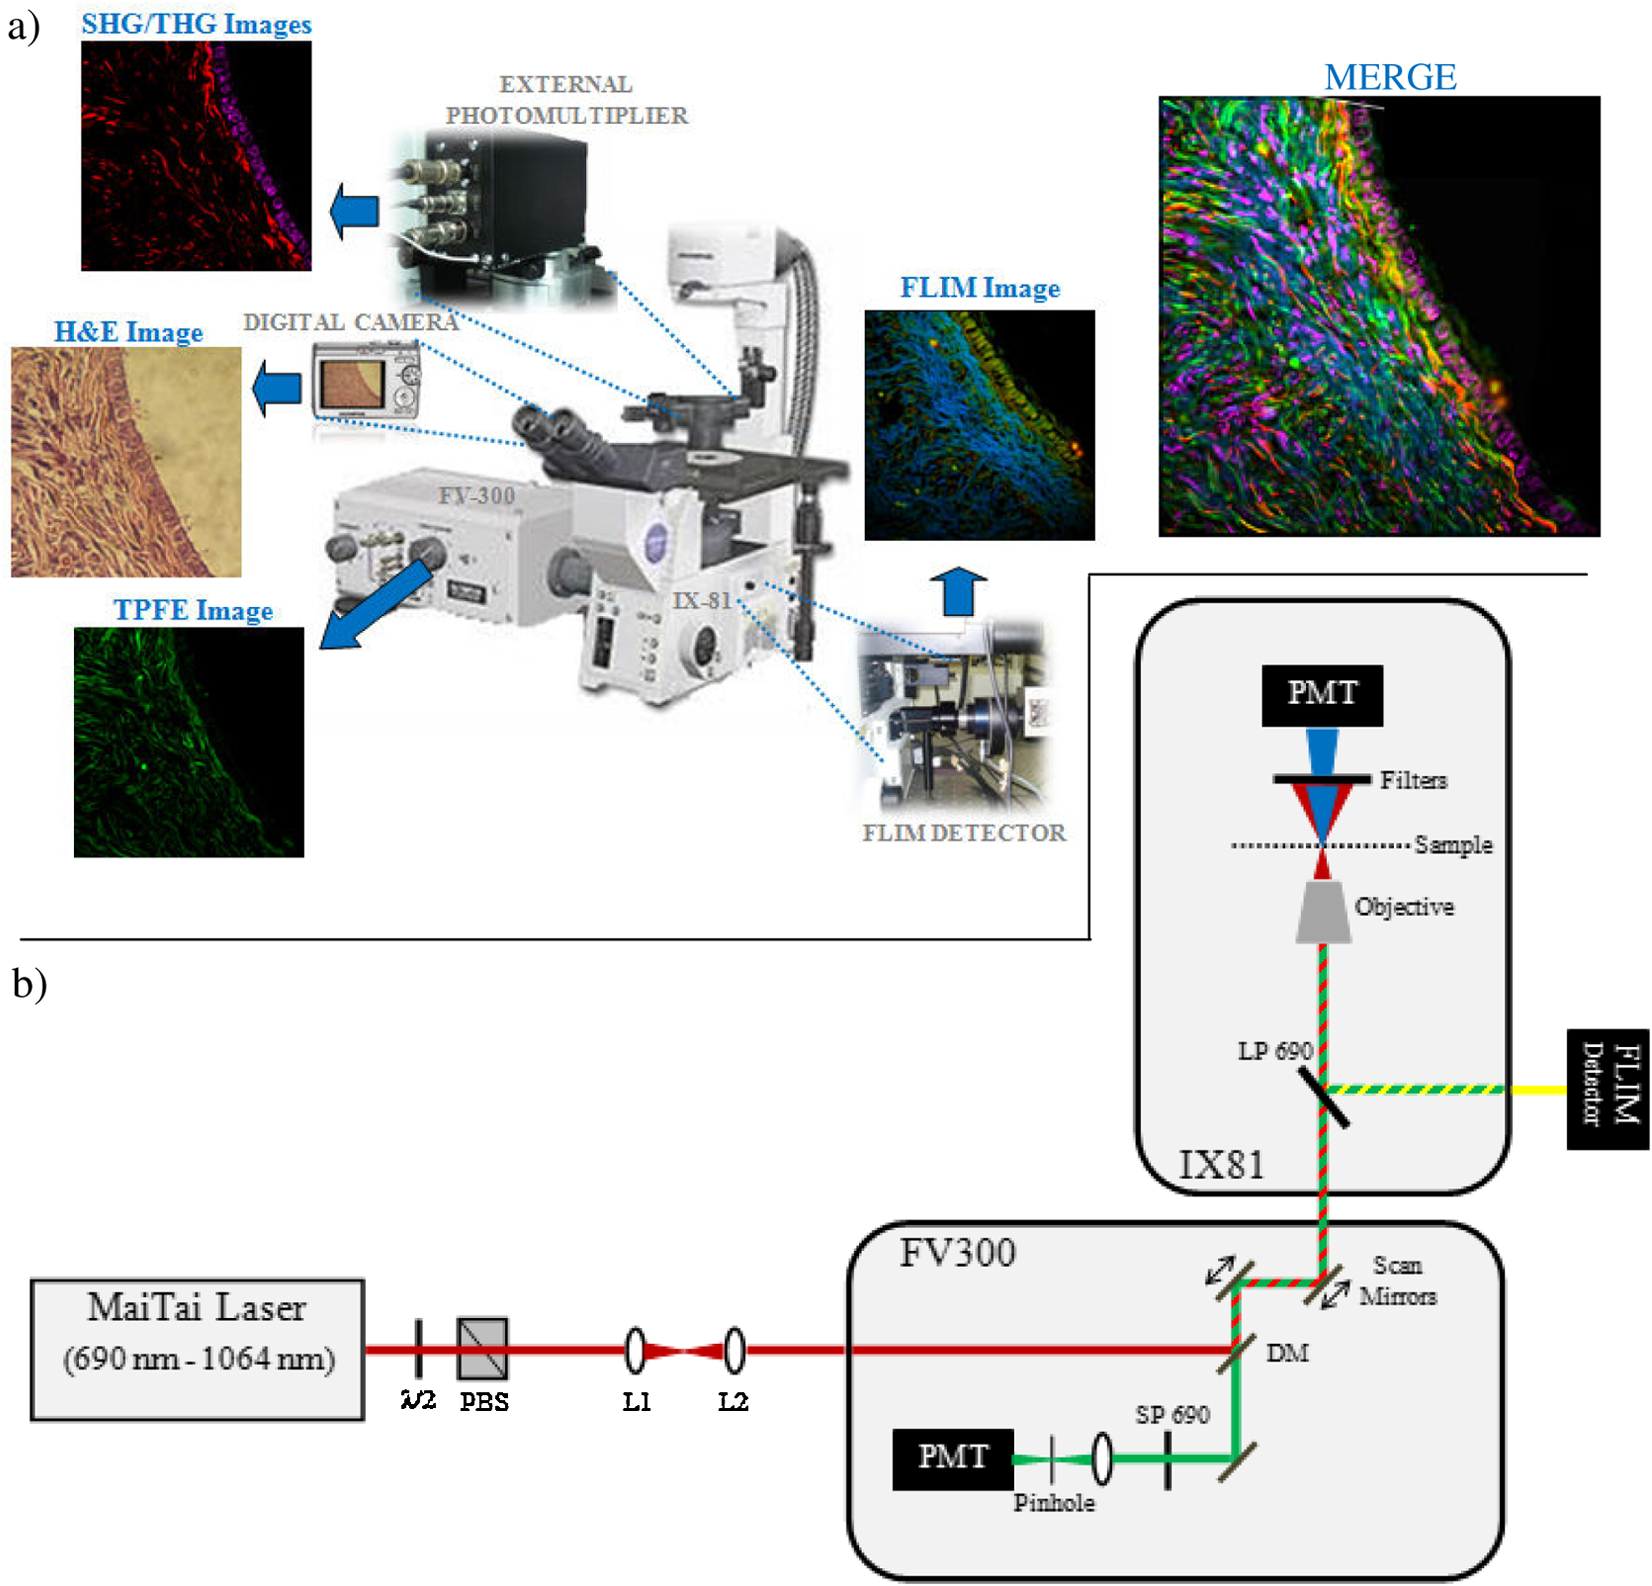 2.3.Analysis and Quantification of Nonlinear ImagesA qualitative and quantitative analysis was conducted with NLO images. TPEF and THG were used as qualitative tools while SHG and FLIM signal were used to obtain quantitative data. From the SHG signal we quantified collagen fibril orientation and structure present in stroma (breast and ovarian) and dermis (skin) using two different images pattern analysis methods. First, the collagen-fibril bundles orientation was carried out in the Fourier domain by analyzing the aspect ratio of the bidimensional distribution of the fast Fourier transform (FFT) images. The second method is based on texture analysis. From gray-level co-occurrence matrix (GLCM) of the images we can calculate uniformity, entropy, and correlation. We selected these methods because they already been successfully used in other analysis of cancer and skin diseases.11,21,22 The FFT method allows characterization of the SHG images of tissues based on their anisotropy. Although SHG is maximum when the fibril long axis is parallel to the light polarization, the anisotropy is never too large, with minimum/maximum ratio above 50%. Scattering in the sample depolarizes the incident light and microscope optical elements birefringence transforms linear polarized into elliptic polarized light.23 Therefore image of fibers in one direction could be dimmer than in the other direction but it is always present. For highly scattering samples the polarization anisotropy is weaker. If the fibers are perfect parallel lines than the vectors in -space are perpendicular to the fiber. For fibers not perfect, the two dimension image in -space becomes an ellipse, with the minor/major axis ratio dependent on the fibers orientation and organization but independent of the signal intensity. Although we used linear polarized light we only obtained the information using this ratio in -space, and not the SHG intensity. With GLCM methods we characterized tissues by estimating the typical length within which collagen maintains its organization. This is done by translating images in parallel or perpendicular direction, usually by 1 pixel step. For entropy and uniformity we used the average value between the 0 and 90 deg translations. Other information is obtained by the autocorrelation of the image with itself translated from 1 to 12 pixels in the horizontal direction (perpendicular to the fibers). We measured the distance where autocorrelation falls to , expressed in microns. All calculations were performed by using FFT and the GLCM-texture modules of ImageJ software (NIH), respectively. The SPCImage software (Becker and Hickl) was used to analyze the fluorescence lifetime decay curves, according to previous reports.24,25 The lifetime decay curve of each pixel was fit to a double-exponential decay model: where is the fluorescence intensity at time after the excitation light has ceased, and are the fluorophor lifetimes ( is the short-lifetime component and is the long-lifetime component), and are the relative contributions of the lifetime components (i.e., ), and is a constant related to the level of background light present. The presence of two different lifetimes for free and protein-bound FAD indicates that FAD fluorescence decay curves are best fitted to a double-exponential decay model.24 Data with a value greater than 1.2 was deemed to be of a poor fit and was eliminated from the results. The parameter and values were measured in epithelial cell and compared between different types of tumor tissues.For qualitative and quantitative analysis of the stromal and epithelial structures, three images were selected and collected for each biopsy, resulting in a total of 45 images from breast tissues, 48 images from ovary and 12 images from skin, respectively. Because all data come from a digital analysis of the images and all the processing was done automatically, a blind analysis was not necessary. 2.4.Statistical AnalysisFor multi-group comparisons, one-way analysis of variance (ANOVA) with a post-hoc Tukey-Kramer test was used. We performed -testing for two-group comparisons. The level of significance employed was: significant (*) and very significant (**) . Data were analyzed with SPSS 10.0 software. 3.Results and Discussions3.1.Normal TissueAny analysis with a new technique must use normal tissue as the standard against which pathological conditions shall be compared. Figure 1(a) shows how each NLO modality provides complementary information. TPEF signal (green) corresponds to eosin fluorescence, which is weak in nuclear regions but strong in the regions outside the nucleus, revealing connective structures in the stroma. The SHG (red) corresponds specifically to collagen within the stromal connective tissue and THG (magenta) highlights exclusively the nuclei. Because SHG is an instantaneous NLO process it also appears in the FLIM images like a very fast lifetime component, of order of the IRF (blue color). The same would be true for THG if the ultraviolet (UV) light could reach the FLIM detector, which was not possible in our system. Epithelial cells show lifetime values around 0.5 to 3 ns (green/yellow colors) that correspond fundamentally to the endogenous fluorophores NADH and FAD,26 in agreement with literature values.27,28 As far as we know these are the first results obtained with an integration of FLIM with SHG, THG, and TPEF modalities. As shown in merge image of Fig. 1, good correspondences between each NLO images can be obtained with this setup. The structural information revealed by each nonlinear contrast mechanism can be isolated and analyzed separately, while their superposition allows a better comparison and understanding of the spatial organization of the tissue. The next step was, then, to assess whether the integration of all the techniques, or a combination of them, can be useful to detect transformed epithelial cells and abnormal stromal configurations. 3.2.Quantitative Changes Detected in Breast CancerSHG and FLIM modalities have already been used to evaluate collagen of extracellular matrix.29,30 Keely and coworkers demonstrated that these techniques are a powerful tool to study epithelial-stromal interactions and matrix reorganization in breast tumor.9,10,30–34 Most of the previous studies using the combination of TPEF, SHG, and FLIM were performed in cell cultures and animal models of breast cancer. Only in 2011 Keel’s group presented results on human breast carcinoma (ductal and lobular) tissue using a complete analysis of SHG signals.35 In this paper we used human tissues and showed how useful the addition of THG microscopy is to analyze epithelial/stromal interaction. We also demonstrated, for the first time, the utility of to characterize morphological properties of human ILC and MC (tumors not previously assessed by other research groups). Figure 2(a) shows representative H&E-stained, TPEF, SHG, and THG images and their combinations of normal and malignant breast tissues. Characteristic microscopic appearance of each type of tissue, and relationship between cells and stromal can be identified, in the combination (third column). The different orientations and distribution of collagen fibers can be clearly identified in stroma region with SHG image (fourth column). We evaluated these collagen-related changes by anisotropy and texture features calculations [Fig. 2(b) and 2(c)] in the selected ROI (see yellow square). Figure 2(b) (black bars) shows the aspect ratio (AR) value averaged on all examined samples. Summarizing, these result show that, except for ILC which present a higher AR (with significant difference), the other breast tissues have an AR around 0.5, which means that they have a particular orientation. Figure 2(b) (red bars) and 2(c) shows the results of GLCM quantification. Normal and MC breast tumor tissues show the highest values of uniformity and lowest entropy. As expected, fibroadenoma, IDC, and ILC tumor present the inverse tendency. Correlation for the fibrils in ILC remained elevated for larger distances (between 0.5 and 1.5 μm), implying less defined fibrillar structure [Figure 2(c)]. We found that the correlation remained higher in ILC tissues with the , the pixel distance where the correlation dropped below 50% of the initial value, significantly greater when compared with the other types of tissues (, ANOVA). Fig. 2(a) Representative H&E-stained and TPEF (green), SHG (red), and THG (magenta) cross-sectional images of breast tissues diagnosed as normal (first row), fibroadenoma (second row), infiltrate ductal carcinoma (third row), invasive lobular carcinoma (fourth row), and mucinous carcinoma (fifth row). Yellow square in SHG images represents the representative selected ROI (four side squared ROI) used to perform FFT and GLCM quantification. D: duct. All scale bars are 20 μm. (b) Black bars represent FFT and red bars represent GLCM measurements, respectively. Each bar represents the mean . of independent measurements. The total number of ROI from which values were extracted for each sample was (). Asterisks indicate a very significant increase or decrease as compared to the non-tumor tissues (-test, ). (c) Correlation values in breast tissues versus distances pixels; the correlation for distances ranging from 1 to 12 pixels (0.25 to 3.0 μm) in the horizontal direction of pixel ROI of interest was calculated (). value. Fibroad: fibroadenoma; Duc. Carc.: ductal carcinoma; Lob. Carc.: lobular carcinoma; and Muc. Carc.: Mucinous Carcinoma. For interpretation of the references to color in this figure legend, the reader is referred to the online version of this paper.  Taking all the results obtained from SHG together, we can say that in general our results are in line with the analyses presented by other authors.31–34 In these reports the authors conclude that cells preferentially invade along perpendicularly aligned collagen fibers compared to randomly organized collagen.34 This coincides with our observations in IDC, but differs from our observations in ILC, where fibers are randomly orientated. However, we can confirm the stromal invasion analyzing THG of nuclei. The cells are arranged in rows between collagen fibers which is a characteristic of these tumors. Therefore, because it has been shown that invasion is severely limited in an unaligned matrix, future studies will be necessary to explain tumor cell proliferation in ILC. However, from SHG quantification, ILC can be easily identified from other cancer types because it shows high values of AR, entropy and correlation and a low value of uniformity. On the other hand, the detection of MC using only SHG analysis is difficult fundamentally because collagen fibers are organized and oriented similar to normal tissues. In this case, THG microscopy visualization was fundamental to see epithelial cells with neoplastic appearance and embedded in mucin lakes. In summary, for in breast cancer we demonstrated that it is possible to detect qualitative and quantitative different between each breast tumor. These results demonstrate the advantage of the integration of as many NLO techniques as possible. 3.3.Quantitative Changes Detected in Ovarian CancerThe next step was to demonstrate the utility of this multimodal optical setup to identify various pathologic diagnoses of mucinous ovarian human tumors. We used SHG, THG, and TPFE/FLIM techniques to analyze adenoma, borderline, and adenocarcinoma ovarian tissues, and compared each one with normal tissue (Fig. 3). By merging epithelial/stromal interface was easily identified [white outline, Fig. 3(a) to 3(d)]. In these images the differences in surface epithelium from each tumor type can be easily qualitatively recognized with THG (magenta color). Mucinous tumors show cells of varying sizes, distributed in multiple layers and containing abundant intracytoplasmic mucin (see yellow asterisk) with basal nuclei (see yellow arrowhead), including cellular atypia and proliferation. These characteristics are distinguishable in the enlarged images of insert. Fig. 3Representative multimodal cross-sectional images of stained-H&E samples for SHG and THG analyses (a) to (d) and unstained samples for FLIM study (e) to (h); of normal [(a), (e)], adenoma [(b), (f)], borderline [(c), (g)], and adenocarcinoma [(d), (h)] mucinous ovarian human tissues. The color map [(e) to (h)] represents the weighted average of the two-term model components [] using the equation shown in the text. Epithelial/stromal interface is indicated (white outline). In insets, mucin content is indicated with yellow and white asterisk; and epithelial cells are indicated with yellow arrowhead. All scale bars are 20 μm. (i) Black bars represent FFT and red bars represent quantitative analysis of fluorescent lifetime weighted mean component () from epithelial cells (), respectively. Each bar represents the mean . of independent measurements. Results of the aspect ratio of mucinous ovarian samples averaged on all ROI () examined: normal (), adenoma (), borderline (), and adenocarcinoma (). Results of FLIM images shows a gradual increase of with tumor progression. Note that at least 45 measurements per tumor image from three independent tumors were used to calculate lifetime values for tumor cells. One asterisk indicates a significant increase or decrease as compared to the non-tumor tissues (-test, ) and two asterisks indicate a very significant difference (-test, ). (j) Correlation values in mucinous ovarian tissues versus distances pixels; the correlation for distances ranging from 1 to 12 pixels (0.25 to 3.0 μm) in the horizontal direction of ROI of interest was calculated [normal (), adenoma (), borderline () and adenocarcinoma ()]. value. For interpretation of the references to color in this figure legend, the reader is referred to the online version of this paper.  Similar to previous analysis in breast tissue, collagen-related changes were evaluated in SHG images by anisotropy and texture features calculations in the ROI selected near the epithelium. Figure 3(i) (black bars) shows the aspect ratio (AR) value averaged on all examined samples. AR increased progressively, but only for adenocarcinoma it was significantly higher (, ANOVA) compared to normal. These results confirm the fact that normal ovary are more organized tissues as compared to adenocarcinoma. In relation to texture measurements, uniformity was larger in normal () and adenoma () tissues with respect to borderline () and adenocarcinoma (). Entropy shows the inverse tendency, which means that normal and adenoma tissues are less complex with respect to malignant tissues. In addition, Fig. 3(j) shows the correlation results. Normal, adenoma and borderline fibrils correlation fall off sharply with distance, indicating distinct, linear fibrils, whereas correlation for the fibrils in adenocarcinomas remained elevated for larger distances, implying less defined fibrillar structure. Consistent with qualitative appearances, we found that the correlation remained higher in adenocarcinoma tissues with the significantly larger than the other types of ovarian tissues (, ANOVA). The fact that distance of the adenocarcinoma fibrils was larger than the distance of the adenoma or borderline fibrils, suggests that fibrils in the precancerous group retained some of the normal tissue fine structure. These results reflect the fact that there is a link between the epithelial carcinogenesis process and progressive loss in the fibril distribution in the stroma. Figure 3(e) to 3(h) shows FLIM images exploiting cellular FAD as the endogenous biomarker to visualize cells. Epithelial cells of adenocarcinoma tissues showed a significantly higher weighted mean of the fluorescent lifetime () as compared with the non-tumor (), benign tissues () and borderline () [Fig 3(i), red bars]. These higher lifetime values may be due to the sum of FAD and mucin auto-fluorescence present in tumor epithelium. This difference allows epithelial cells of malignant ovary to be easily differentiated from epithelial cells of healthy ovary. Our data indicates that pathologists could perform a FLIM analysis before H&E staining the sample without any prejudice for the usual professional protocol or losses of important samples for diagnostic. We believe that if a large number of pathologists start to use FLIM they will prove the value of this technique for diagnostic purpose. In general, our results are coincident with the literature. Using SHG and THG similar results were found in ovarian tumors from mouse models.27,28,36 Last year, we quantified these differences but in serous ovarian human tumor.11 Several researchers have reported FLIM of endogenous fluorophores in cancer,24,32,37,38 but this is the first work on ovarian tissues. We therefore demonstrated that, based on intrinsic optical contrast obtained with each NLO technique, there are quantitative differences between healthy and tumoral ovary. The combined multidimensional information obtained from these imaging modalities applied to cells and tissues provides a relatively unique view of the relevant biological system that can explain mechanisms of tumor formation and progression. In this study, with SHG and THG, we quantify several events that occur at the tumor-stroma boundary crucial for tumor progression. For example, reorganization of the stromal matrix, and the invasion of tumor cells into the stroma. Also, with FLIM analysis in unstained slides, we reported an increase in the component of the FAD lifetime in pre-cancerous cells when compared with normal epithelium. These changes in the metabolic state of tumor cells, such as the concentration of FAD, (impossible to be observed with classical H&E stained tissues) at any given time during tumor progression have a diagnostic potential. Because endogenous biomarkers such as stromal collagen and cellular FAD show differences during tumor progression (adenoma to adenocarcinoma) and can be consistently quantified, we believe that they could be used as an indicator of early diagnosis in future studies in vivo. 3.4.Quantitative Changes Detected in Osteogenesis ImperfectaWe further demonstrated the usefulness of this multimodal optical setup in detecting modifications in the human skin dermis of patients with OI. It is known, from biochemical and molecular genetic studies, that the vast majority of individuals () affected with OI types I-IV, have mutations in either COL1A1 or COL1A2 genes that affect the primary structure of the collagen chain and induce changes in the secondary structure of the collagen trimmers that incorporate the mutant chains. The ultimate outcome is collagen fibrils that are either reduced in quantity or quality such as abnormal organization and short, or both.39 Therefore, one expects that skin with disorganized structures such as in OI would generate less SHG signal compared to highly ordered collagen structures found in normal skin. This was demonstrated by other authors using a murine model that expresses the disease.18,40 In this work, for the first time, we demonstrated the usefulness of SHG microscopy to quantify transformations in human skin dermis of patients with OI. Although the most dramatic clinical presentation of OI is in bone, skin was selected because our future goal is to develop SHG imaging as a clinical diagnostic tool, and skin is the most easily accessible tissue. Figure 4 shows one normal, one OI type IV, and one OI type III representative images. Comparing these images we can see that collagen [red] proportion to TPEF [green] changes in the stroma just by noticing the red/green proportion. Moreover, the insert images suggest that the fibrils are less ordered for the more severe form of OI patient. Collagen-related changes were evaluated by anisotropy and texture features calculations in the ROI selected in the dermis. These results confirm that patients with OI present collagen fibril with less organization and randomly oriented [Fig. 4(g), black bars]. Fig. 4Representative cross-sectional images of stained-H&E samples for TPEF and SHG analyses of normal [(a), (d)], OI type IV [(b), (e)], and OI type III [(c), (f)] skin human tissues. Epidermis/dermis interface is indicated (white outline). In insets, visual differences of fiber collagen are show. Ep: epidermis; and D: dermis. Yellow square in SHG images represents the representative selected ROI (four side squared ROI) used to perform FFT and GLCM quantification. All scale bars are 100 μm. (g) Black bars represent FFT and red bars represent GLCM measurements, respectively. Each bar represents the mean . of independent measurements. The total number of ROI from which values were extracted for each sample was normal () and for each type of OI (). Asterisks indicate a significant increase or decrease as compared to the non-tumor tissues (-test, ). (h) Correlation values in skin tissues versus distances pixels; the correlation for distances ranging from 1 to 12 pixels (0.5 to 8.3 μm) in the horizontal direction of ROI of interest was calculated ( normal and OI). value. OI_(III): OI type III; and OI_(IV): OI type IV. For interpretation of the references to color in this figure legend, the reader is referred to the online version of this paper.  Furthermore, uniformity decreased progressively and significantly from normal to diseases. As expected, entropy showed the inverse tendency, suggesting that normal skin tissue was less complex than OI patient’s skin [Fig. 4(g), red bars]. The correlation decay curve of OI_(III) sample was less pronounced than OI_(IV) and much less pronounced than normal decay curve, consistent with the loss of linear fibril structure and definition. This can be also quantified by the [Fig. 4(h)], which are for normal, for OI_(IV), and for OI_(III). According to literature collagen fibers have a diameter ranging between 0.3 and 2 μm. In dermis these fibers are arranged mainly parallel to the epithelial surface. This means that a periodic structure with distance ranging from 0.3 to 2 μm should appear from GLCM analysis. OI_(III) patient skin contains large thick fibers that are randomly oriented to the epithelial surface. Therefore, GLCM correlation signal is expected to drop on a longer scale. The typical distances we found are consistent with these fiber bundle diameters. These results reflect the fact that there is a link between the OI clinical severity and progressive loss of fibril distribution in the dermis. This optical scheme could be used in lieu of existing invasive, time consuming and destructive methods (such as biochemical measurements, histologic or biochemical evaluation of the collagen from biopsy-derived dermal fibroblasts, and also from bone biopsies), and may be especially useful in monitoring the status of individual patients relative to their initial screen, where patients would already have a genetic profile. Since there is no fast and clear method to diagnose OI at the moment, the imaging can be a very practical method to define the diagnosis, especially with improvements and automatic quantification procedures. 4.ConclusionThe integration of the various NLO techniques is one of the evolving areas in bioimaging that promises to have a strong impact on early detection of various diseases. In this work we integrated four techniques () on the same microscopy setup and established that it is possible to assess H&E-stained section with TPEF, SHG, and THG methodologies as well as unstained but fixed tissue with FLIM. Using this multimodal approach on adjacent section of the same biopsies, we demonstrated (qualitatively and quantitatively) that it can discern between healthy and abnormal tissues. We also detected changes in cellular behavior and chemical properties (), and changes in extracellular matrix composition and architecture () on healthy and pathological human tissues. Because these changes were consistently quantified we believe that they have great clinical potential. Multiphoton techniques, and all of the associated imaging modalities (MPFE, SHG, THG, FLIM, etc.), do not require biopsy tissue to be fixed, sectioned, or stained, which increases its potential use as a diagnostic tool, besides its valuable use as a research tool. This also means that samples can be preserved for normal procedure diagnostics. Many research groups actually are working on imaging both live tissue tumor biopsies and stained and unstained histology slides as a way to obtain additional quantitative information to supplement standard histopathology.41–43 We are presently extending the work to look at freshly unfixed tissues. The ability to image freshly harvested tissue for pathological evaluation could be of great clinical utility and could provide multiple sets of information (for example, metabolic state, tumor cell phenotype, stromal composition, etc.) in a single imaged tumor volume. AcknowledgmentsThe authors are grateful to FAPESP. This work is also linked with the CEPOF (Optics and Photonics Research Center, FAPESP) and National Institute of Photonics Applied to Cell Biology (INFABIC). ReferencesR. CicchiL. SacconiF. Pavone,
“Nonlinear imaging of tissues,”
Handbook of Photonics for Biomedical Science, 509
–537 CRC Press, Boca Raton, FL
(2010). Google Scholar
T. E. Matthewset al.,
“Pump-probe imaging differentiates melanoma from melanocytic nevi,”
Sci. Transl. Med., 3
(71), 71ra15
(2011). http://dx.doi.org/10.1126/scitranslmed.3001604 STMCBQ 1946-6242 Google Scholar
R. Carrileset al.,
“Imaging techniques for harmonic and multiphoton absorption fluorescence microscopy,”
Rev. Sci. Instrum., 80 081101
(2009). http://dx.doi.org/10.1063/1.3184828 RSINAK 0034-6748 Google Scholar
R. Ciseket al.,
“Multicontrast nonlinear microscopy,”
Biochemical Applications of Nonlinear Spectroscopy, 71
–102 CRC Press, Boca Raton, FL
(2009). Google Scholar
A. Tueret al.,
“Nonlinear multicontrast microscopy of hematoxylin-and-eosin-stained histological sections,”
J. Biomed. Opt., 15
(2), 026018
(2010). http://dx.doi.org/10.1117/1.3382908 JBOPFO 1083-3668 Google Scholar
W. R. ZipfelR. M. WilliamsW. W. Webb,
“Nonlinear magic: multiphoton microscopy in the biosciences,”
Nat. Biotechnol., 21
(11), 1369
–1377
(2003). http://dx.doi.org/10.1038/nbt899 NABIF9 1087-0156 Google Scholar
P. J. CampagnolaC. Y. Dong,
“Second harmonic generation microscopy: principles and applications to disease diagnosis,”
Laser Photon. Rev., 5
(1), 13
–26
(2011). http://dx.doi.org/10.1002/lpor.v5.1 LPRAB8 1863-8880 Google Scholar
D. Débarreet al.,
“Imaging lipid bodies in cells and tissues using third-harmonic generation microscopy,”
Nat. Methods, 3
(1), 47
–53
(2006). http://dx.doi.org/10.1038/nmeth813 1548-7091 Google Scholar
P. P. ProvenzanoK. W. EliceiriP. J. Keely,
“Multiphoton microscopy and fluorescence lifetime imaging microscopy (FLIM) to monitor metastasis and the tumor microenviroment,”
Clin. Exp. Metastasis, 26
(4), 357
–370
(2009). http://dx.doi.org/10.1007/s10585-008-9204-0 CEXMD2 0262-0898 Google Scholar
M. W. Conklinet al.,
“Fluorescence lifetime imaging of endogenous fluorophores in histopathology sections reveals differences between normal and tumor epithelium in carcinoma in situ of the breast,”
Cell. Biochem. Biophys., 53
(3), 145
–157
(2009). http://dx.doi.org/10.1007/s12013-009-9046-7 CBBIFV 1085-9195 Google Scholar
J. Aduret al.,
“Recognition of serous ovarian tumors in human samples by multimodal nonlinear optical microscopy,”
J. Biomed. Opt., 16
(9), 096017
(2011). http://dx.doi.org/10.1117/1.3626575 JBOPFO 1083-3668 Google Scholar
C. Yuet al.,
“Molecular third-harmonic-generation microscopy through resonance enhancement with absorbing dye,”
Opt. Lett., 33
(4), 387
–389
(2008). http://dx.doi.org/10.1364/OL.33.000387 OPLEDP 0146-9592 Google Scholar
K. W. Eliceiriet al.,
“Analysis of histology specimens using lifetime multiphoton microscopy,”
J. Biomed. Opt., 8
(3), 376
–380
(2003). http://dx.doi.org/10.1117/1.1584053 JBOPFO 1083-3668 Google Scholar
P. J. CampagnolaL. M. Loew,
“Second-harmonic imaging microscopy for visualizing biomolecular arrays in cells, tissues and organisms,”
Nat. Biotechnol., 21
(11), 1356
–1360
(2003). http://dx.doi.org/10.1038/nbt894 NABIF9 1087-0156 Google Scholar
W. R. Zipfelet al.,
“Live tissue intrinsic emission microscopy using multiphoton-excited native fluorescence and second harmonic generation,”
Proc. Natl. Acad. Sci. U S A., 100
(12), 7075
–7080
(2003). http://dx.doi.org/10.1073/pnas.0832308100 1091-6490 Google Scholar
E. J. Gualdaet al.,
“In vivo imaging of cellular structures in Caenorhabditis elegans by combined TPEF, SHG, and THG microscopy,”
J. Microsc., 229
(1), 141
–150
(2008). http://dx.doi.org/10.1111/jmi.2008.229.issue-1 JMICAR 0022-2720 Google Scholar
V. B. Pelegatiet al.,
“Multimodal optical setup for nonlinear and fluorescence lifetime imaging microscopies: improvement a commercial confocal inverted microscope,”
Microsc. Res. Tech., MRTEEO 1059-910X Google Scholar
R. LacombO. NadiarnykhP. J. Campagnola,
“Quantitative second harmonic generation imaging of the diseased state osteogenesis imperfecta: experiment and simulation,”
Biophys. J., 94
(11), 4504
–4514
(2008). http://dx.doi.org/10.1529/biophysj.107.114405 BIOJAU 0006-3495 Google Scholar
Atlas of Tumor Pathology: Tumors of the Ovary, Maldeveloped Gonads, Fallopian Tubes and Broad Ligament, 3rd ed.Armed Forces Institute of Pathology, Washington, D. C.
(1998). Google Scholar
D. O. SillenceA. SennD. M. Danks,
“Genetic heterogeneity in osteogenesis imperfect,”
J. Med. Genet., 16
(2), 101
–116
(1979). http://dx.doi.org/10.1136/jmg.16.2.101 JMDGAE 0022-2593 Google Scholar
S. Zhuoet al.,
“Quantitatively linking collagen alteration and epithelial tumor progression by second harmonic generation microscopy,”
Appl. Phys. Lett., 96
(21), 213704
(2010). http://dx.doi.org/10.1063/1.3441337 APPLAB 0003-6951 Google Scholar
R. Cicchiet al.,
“Scoring of collagen organization in healthy and diseased human dermis by multiphoton microscopy,”
J. Biophoton., 3
(1–2), 34
–43
(2010). http://dx.doi.org/10.1002/jbio.200910062 JBOIBX 1864-063X Google Scholar
O. NadiarnykhP. J. Campagnola,
“Retention of polarization signatures in SHG microscopy of scattering tissues through optical clearing,”
Opt. Express., 17
(7), 5794
–5806
(2009). http://dx.doi.org/10.1364/OE.17.005794 OPEXFF 1094-4087 Google Scholar
D. K. Birdet al.,
“Metabolic mapping of MCF10A human breast cells via multiphoton fluorescence lifetime imaging of the coenzyme NADH,”
Cancer. Res., 65
(19), 8766
–8773
(2005). http://dx.doi.org/10.1158/0008-5472.CAN-04-3922 CNREA8 0008-5472 Google Scholar
M. C. Skalaet al.,
“In vivo multiphoton fluorescence lifetime imaging of protein-bound and free nicotinamide adenine dinucleotide in normal and precancerous epithelia,”
J. Biomed. Opt., 12
(2), 024014
(2007). http://dx.doi.org/10.1117/1.2717503 JBOPFO 1083-3668 Google Scholar
K. Schenke-Layland,
“Non-invasive multiphoton imaging of extracellular matrix structures,”
J. Biophoton., 1
(6), 451
–462
(2008). http://dx.doi.org/10.1002/jbio.v1:6 JBOIBX 1864-063X Google Scholar
O. Nadiarnykhet al.,
“Alterations of the extracellular matrix in ovarian cancer studied by second harmonic generation imaging microscopy,”
BMC Cancer, 10
(94), 1
–14
(2010). http://dx.doi.org/10.1186/1471-2407-10-94 BCMACL 1471-2407 Google Scholar
R. M. Williamset al.,
“Strategies for high-resolution imaging of epithelial ovarian cancer by laparoscopic nonlinear microscopy,”
Transl. Oncol., 3
(3), 181
–194
(2010). Google Scholar
D. Dumaset al.,
“Innovative TCSPC-SHG microscopy imaging to monitor matrix collagen neo-synthetized in bioscaffolds,”
Biomed. Mater. Eng., 20
(3), 183
–188
(2010). Google Scholar
P. P. Provenzanoet al.,
“Collagen density promotes mammary tumor initiation and progression,”
BMC Med., 6
(11), 1
–15
(2008). http://dx.doi.org/10.1186/1741-7015-6-11 BMMECZ 1741-7015 Google Scholar
P. P. Provenzanoet al.,
“Collagen reorganization at the tumor-stromal interface facilitates local invasion,”
BMC Med., 4
(1), 38
(2006). http://dx.doi.org/10.1186/1741-7015-4-38 BMMECZ 1741-7015 Google Scholar
P. P. Provenzanoet al.,
“Nonlinear optical imaging and spectral-lifetime computational analysis of endogenous and exogenous fluorophores in breast cancer,”
J. Biomed. Opt., 13
(3), 031220
(2008). http://dx.doi.org/10.1117/1.2940365 JBOPFO 1083-3668 Google Scholar
P. P. Provenzanoet al.,
“Nonlinear optical imaging of cellular processes in breast cancer,”
Microsc. Microanal., 14
(6), 532
–548
(2008). http://dx.doi.org/10.1017/S1431927608080884 MIMIF7 1431-9276 Google Scholar
P. P. Provenzanoet al.,
“Contact guidance mediated three-dimensional cell migration is regulated by Rho/ROCK-dependent matrix reorganization,”
Biophys. J., 95
(11), 5374
–5384
(2008). http://dx.doi.org/10.1529/biophysj.108.133116 BIOJAU 0006-3495 Google Scholar
M. W. Conklinet al.,
“Aligned collagen is a prognostic signature for survival in human breast carcinoma,”
Am. J. Pathol., 178
(3), 1221
–1232
(2011). http://dx.doi.org/10.1016/j.ajpath.2010.11.076 AJPAA4 0002-9440 Google Scholar
N. D. KirkpatrickM. A. BrewerU. Utzinger,
“Endogenous optical biomarkers of ovarian cancer evaluated with multiphoton microscopy,”
Cancer. Epidemiol. Biomarkers Prev., 16
(10), 2048
–2057
(2007). http://dx.doi.org/10.1158/1055-9965.EPI-07-0009 CEBPE4 1055-9965 Google Scholar
P. J. Tadrouset al.,
“Fluorescence lifetime imaging of unstained tissues: early results in human breast cancer,”
J. Pathol., 199
(3), 309
–317
(2003). http://dx.doi.org/10.1002/(ISSN)1096-9896 JPTLAS 0022-3417 Google Scholar
N. P. Galletlyet al.,
“Fluorescence lifetime imaging distinguishes basal cell carcinoma from surrounding uninvolved skin,”
Br. J. Dermatol., 159
(1), 152
–161
(2008). http://dx.doi.org/10.1111/j.1365-2133.2008.08577.x BJDEAZ 1365-2133 Google Scholar
A. Gajko-Galicka,
“Mutations in type I collagen genes resulting in osteogenesis imperfecta in humans,”
Acta. Biochim. Pol., 49
(2), 433
–441
(2002). ABPLAF 0001-527X Google Scholar
O. Nadiarnykhet al.,
“Second harmonic generation imaging microscopy studies of osteogenesis imperfecta,”
J. Biomed. Opt., 12
(5), 051805
(2007). http://dx.doi.org/10.1117/1.2799538 JBOPFO 1083-3668 Google Scholar
S. J. Linet al.,
“Discrimination of basal cell carcinoma from normal dermal stroma by quantitative multiphoton imaging,”
Opt. Lett., 31
(18), 2756
–2758
(2006). http://dx.doi.org/10.1364/OL.31.002756 OPLEDP 0146-9592 Google Scholar
M. HanG. GieseJ. F. Bille,
“Second harmonic generation imaging of collagen fibrils in cornea and sclera,”
Opt. Express, 13
(15), 5791
–5797
(2005). http://dx.doi.org/10.1364/OPEX.13.005791 OPEXFF 1094-4087 Google Scholar
A. M. Penaet al.,
“Three-dimensional investigation and scoring of extracellular matrix remodeling during lung fibrosis using multiphoton microscopy,”
Microsc. Res. Tech., 70
(2), 162
–170
(2007). http://dx.doi.org/10.1002/jemt.v70:2 MRTEEO 1059-910X Google Scholar
|


