
|
|
1.IntroductionThe rapidly evolving biosensor research field yields powerful analytical tools with major applications in cell biology, drug discovery, and diagnostics.1–3 Successful implementation of the label-free biosensing techniques in biochemical assays, especially in the context of high-throughput screening, encourages the development of similar techniques at cellular level. In contrast to target-based labeling approaches that reveal specific one-to-one binding interactions, the label-free methods provide information on macroscopic cell properties, such as refractive index,4–8 electrical conductivity,9,10 viscosity, and mass.11,12 The challenge here is to extract useful bio-functional information (e.g., cell morphology, cell adhesion, cytotoxicity, etc.) from somewhat ambiguous label-free measurements of the physical parameters of the cells. In this respect, the optical label-free platforms, like surface plasmon4,5,13–15 or waveguide6–8 biosensors, have an advantage over the nonoptical platforms (e.g., impedance9,10 and quartz crystal microbalance11,12) since they can be backed by direct optical imaging. Although the majority of optical label-free biosensors operate in the visible wavelength range, and are typically used for bio-molecule affinity characterization,16,17 several groups recently applied these sensors to probe living cells.4–8,13–15 We present a label-free method for cell sensing based on the infrared reflection spectroscopy.18 We use the confined infrared waves such as surface plasmon (SP) and guided (TM) modes to study in real-time and label-free manner the structure and functioning of living cells on substrate. SP propagates at the cell/substrate interface and probes the lower (basal) part of the cell15 while the guided modes travel inside the cell monolayer, and are sensitive to cell height and cell-cell adhesion. By analyzing the resonant wavelength and intensity of these resonant excitations we study the morphological and physiologically-relevant properties of living cells, such as dynamics of cell-substrate attachment, cell morphology, and cell monolayer integrity and height. 2.Materials and Methods2.1.Experimental SetupThe sensing head for living cell measurements is shown in Fig. 1(a). The right-angle ZnS prism [ base (ISP Optics, Inc., Irvington, NY, US)] with Au coating (18 to 20 nm thickness) is attached to the 1.5-ml flow chamber equipped with the temperature controller (). All experiments with living cells were performed at 37°C. The medium flow in the chamber is enabled by the motorized bee syringe pump, and operated by a variable speed controller. The live cells were directly cultured on the Au-coated prism surface unless otherwise stated. Figure 1(b) and 1(c) shows two experimental setups used in this work. The angular interrogation experiments were performed in the configuration19 [Fig. 1(b)] where the incident beam is fixed in space while the flow chamber and detector are rotated using two coupled rotating stages. For the kinetic measurements at fixed incident angle, the prism-flow chamber assembly was mounted on the vertical translation stage [Fig. 1(c)] whereas the cell layer on the Au-surface was simultaneously imaged using a conventional optical microscope. 2.2.Infrared Reflectivity MeasurementsThe infrared beam is emitted from the external port of the FTIR spectrometer [Bruker IFS 55 Equinox FTIR], which is equipped with a tungsten lamp and KBr beamsplitter. The collimated and p-polarized infrared beam is reflected from the Au-coated prism and focused onto a liquid-nitrogen-cooled MCT (HgCdTe) detector. The measurement of a single spectrum takes approximately 25 s, and represents an average of 8 scans with or resolution. The -polarized spectrum was used as a background. In kinetic measurements, the background -polarized spectrum was measured only once, at . 2.3.Analysis of the Infrared SpectraTo convert the SP resonance wavelength into refractive index spectra we used an optical model based on Fresnel equations for tri-layer structure.20 The procedure involves calibration measurement with known analyte (pure water) that yields the optical constants of the Au film. At the next step we used the same Fresnel equations to find the optical constants (, ) of the unknown analyte.20 2.4.Cell Culture and PreparationMadin-Darby canine kidney cells (MDCK) were routinely cultured in minimal essential medium (MEM, Biological Industries, Beit Haemek, Israel), and supplemented with 5% (v/v) fetal calf serum (FCS) and 1% (v/v) antibiotics (Biological Industries). HeLa and human melanoma (MEL 1106) cells were cultured in Dolbecco’s modified Eagle’s medium (DMEM, Biological Industries, Beit Haemek, Israel), and supplemented with D-glucose, 10% (v/v) FCS and 1% (v/v) antibiotics. During the measurements, the cells were bathed in a growth medium supplemented with 20 mM Hepes, pH 7.5. Rat intestinal epithelial cells (IEC6) cells were maintained in DMEM (Sigma-Aldrich, St. Louis, MO, USA), and supplemented with 10% (v/v) FBS (Biological Industries, Beit Haemek, Israel) and 0.2% (v/v) penicillin-streptomycin-nystatin (BioLab LTD, Jerusalem Israel). The cells were cultured in 5% in a humidified atmosphere at 37°C. When the cells reached 80 to 90% coverage, the culture medium was removed, and 2.0 ml of Trypsin-EDTA (Biological Industries, Beit Haemek, Israel) solution was added. After the cell layer was dispersed (this occurs in 3 to 5 min), 4.0 ml of DMEM was added, and the cells were centrifuged. After centrifugation the cells were resuspended in 1 ml of fresh DMEM medium, and plated on the prism where they covered of the area (). During the measurements, the cells were bathed in fresh DMEM which was constantly replaced at slow flow. 3.Principle of Measurement3.1.Surface Plasmon WaveThe surface plasmon is a transverse magnetic (TM) wave that travels along the metal ()—dielectric () interface (-direction), and decays in the direction perpendicular to the interface (-direction).21 The SP wavevector is determined by the complex dielectric permittivity of the metal and of the dielectric (analyte), . Its lateral component, is complex and in order to enable propagation, its imaginary part is much smaller than the real part, The transverse component of the SP wavevector is also complex whereas its real part is much smaller than the imaginary part, Our experimental setup is based on Kretschmann’s configuration, which includes a high-refractive index prism coated with a thin conducting Au-film [Fig. 1(a)]. The SP is excited at certain angle/wavelength at which , where is the incident light wavevector and is the prism refractive index. The SP resonance can be observed using either angular [Fig. 1(a)] or wavelength [Fig. 1(b)] interrogation. The SP reflectivity dip is clearly visible and it shifts upon varying incident angle or wavelength. At fixed incident angle the resonant wavelength () of the SP is determined by the refractive index of the analyte, ,22,23 and for a low-loss analyte () the is given by the inexplicit expression where , and is the internal angle of incidence.The reflectivity at the SP resonance yields the imaginary part of refractive index, . Indeed, the reflectivity at resonance can be approximated by the Lorentzian:21,24 where is the Fresnel reflection coefficient at the prism-metal interface, and is the radiation loss resulting from the finite thickness of the metal film. At resonance the reflectivity achieves its minimal value, which is determined by the imaginary part of the SP wavevector, . The latter depends on the losses in the analyte and in the metal film. By measuring we find the imaginary part of the analyte refractive index, .The high sensitivity of the SP arises from its evanescent nature. SP is confined in a narrow layer in the vicinity of the metal-dielectric interface, and its sampling depth is determined by the decay length of the SP intensity into the dielectric media, , (Refs. 22 and 24) where The lateral spatial resolution of the SP equals to its propagation length in the -direction, .18 It means that when the analyte layer consists of the regions with different refractive indices, two separate SP resonances will appear only if the size of these regions is larger than the .18 Otherwise, there will be a single SP resonance corresponding to the mean refractive index. However, even this “average” SP resonance is sensitive to morphological changes in cells (see Sec. 4.1). 3.2.Studying Living Cells with Surface PlasmonWe focus here on the surface plasmon sensing of living cells cultured on top of the Au-coated ZnS prism. The cells are immersed in aqueous culture medium which enables their viability. Optical constants of the epithelia cell monolayer are shown in Fig. 2(a) and 2(b).20 The real part of cell refractive index [Fig. 2(a)] exceeds that of the culture medium (mostly water) due to presence of up to 30% organic substances. The imaginary part of the cell refractive index [Fig. 2(b)] is determined by the absorption and scattering. The scattering losses dominate at the shorter wavelengths () and the absorption losses dominate in the mid-infrared range ().20 For nonhomogeneous media such as cells, the effective refractive index sensed by the SP wave is a weighted average in -direction, Fig. 2Optical constants of living cells and water in the 1 to 4 μm wavelength region. (a) The red and black lines show the real parts of the cell and water refractive indices, . (b) The imaginary parts of the cell and water refractive indices, . The gray area indicates strong water absorption band that prevents surface plasmon (SP) excitation. 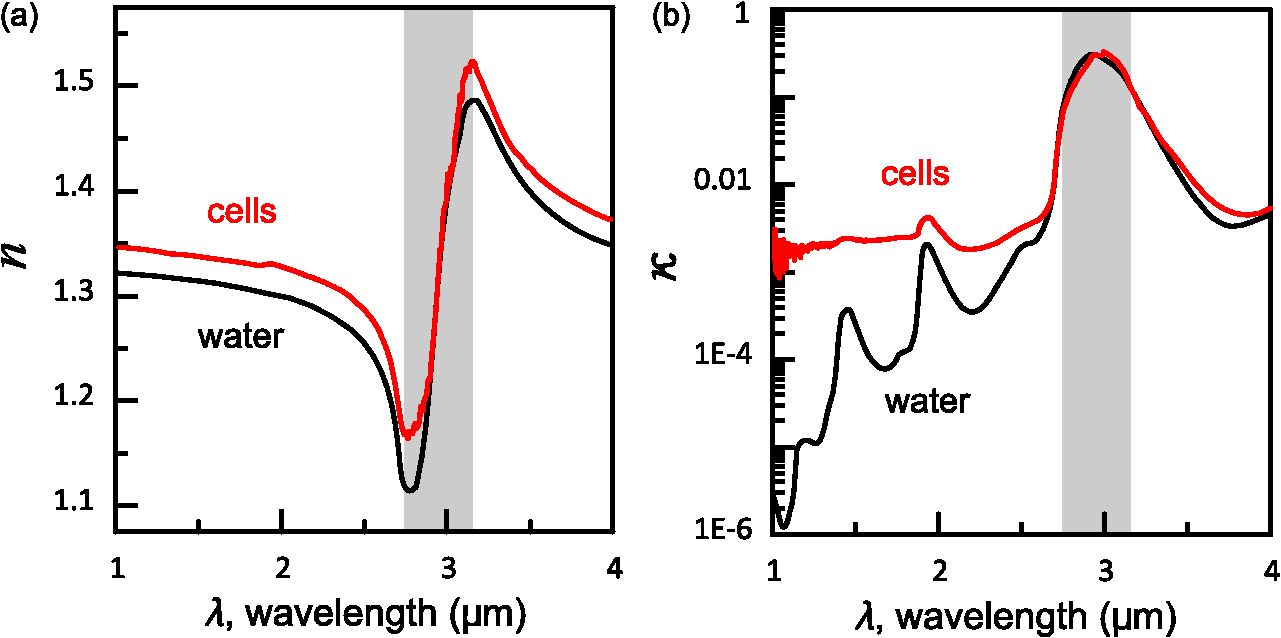 The real part of refractive index yields the total biomass inside the SP field while the imaginary part of the refractive index provides information on the cell morphology. Using our knowledge of the cell optical constants20 we could make a clever choice of the wavelength range for our living cell studies. Indeed, the infrared wavelength range enables extension of the SP sampling depth up to few microns [Fig. 3(a)] without losing the sensitivity ( RIU).18,19,23 This allows monitoring of cellular events not only in the cell-substrate contact region but also inside basal cell region and even in the cell nucleus. The SP propagation length, [Fig. 3(b)] is another parameter that should be considered in the SP-based biosensing. For nonconfluent cells there are two possible regimes: or where is the characteristic length of the cell cluster. In the first case, the SP resonance appears as a single resonance and its wavelength corresponds to the effective refractive index (e.g., the mean between the refractive indices of the cells and of the medium). Figure 4 illustrates the second case, where we observe two SP resonances corresponding to cell covered and cell-free regions. Indeed, the optical images show that HeLa cells have flat morphology with large cell-substrate contact area (cross-section approximately 50 μm) comparable to the SP propagation length (). Fig. 3Characteristic lengths associated with the surface plasmon biosensing. (a) The surface plasmon (SP) sampling depth in -direction. (b) The SP propagation length in -direction. The gray area indicates strong water absorption band that prevents SP excitation. 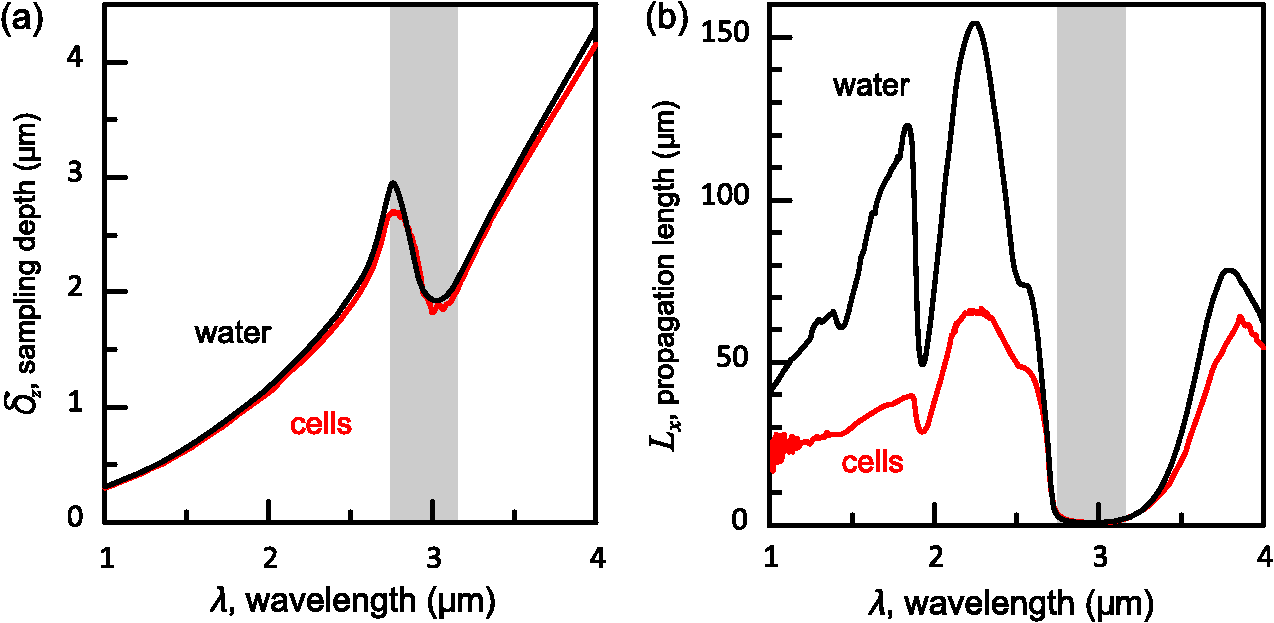 Fig. 4(a) Microscopic images of HeLa cells cultured on the Au substrate. The cell coverage of the substrate increases from left to right. (b) The surface plasmon (SP) resonance for different cell coverage. The SP resonance wavelength shifts from in the absence of cells to for full-cell coverage. At the intermediate cell coverage the two SP peaks, corresponding to the covered and uncovered regions, overlap. Note, the guided mode that appears in the spectrum (, blue line) which corresponds to full-cell coverage.  The infrared wave propagation along the cell layer can be associated with the guided mode excitation. The typical cell height is on the order of infrared wavelength; the thickness of the epithelial cell monolayers is approximately 10 μm. The correct order of the refractive indices () enables the total internal reflection at the cell-medium interface, which is mandatory for the guided mode excitation. When the propagation losses in cell monolayer are reasonably low () and the cell layer is uniform enough, the guided modes can be excited. The resonant wavelength of the guided mode () depends on the cell monolayer thickness , the cell refractive index , and the incident angle. Such guided mode resonances appear in the intact cell monolayers for angular [Fig. 5(a)] and for the wavelength interrogation as well [Fig. 5(b)]. Fig. 5(a) The angular reflectivity spectra from the Madin-Darby canine kidney cells (MDCK) cells cultured on Au substrate. The surface plasmon (SP) resonance appears as the reflectivity dip whose position depends on the incident beam wavelength, . Additional shallow reflectivity dip at larger angle corresponds to the guided mode. (b) Spectral reflectance for different incident angles for the same assembly. Both surface plasmon and guided modes appear as reflectivity minima whose position depends on the incident angle, .  4.Dynamic Measurements of Cellular Processes4.1.Measurement of Cell-Substrate Adhesion Rates with Surface PlasmonThe adhesion and spreading of cells on solid substrates has been studied using optical imaging techniques,25,26 as well as optical and nonoptical biosensors (surface plasmon,5,15,27 waveguides,6–8 cell-impedance,9,10 and quartz crystal microbalance11,12). These methods established that upon initial attachment, adherent cells tend to increase their contact area with the underlying substrate. In case of simple epithelial cells, this process is accompanied by the establishment of robust intercellular contacts through the development of the cell-cell junctions until a continuous polarized cell layer is formed.28 Here we track the morphology of the MDCK cell layer starting from deposition of suspended cells on substrate and ending with formation of a confluent cell monolayer. To derive the cell coverage we convert the change of SP resonant wavelength [Fig. 6(a)] into the refractive index change [Eq. (3)], . Thus, cell coverage , where is the difference of refractive indices of cells and the extracellular medium. Fig. 6Real-time measurement of Madin-Darby canine kidney cells (MDCK) cell monolayer formation. (a) Surface plasmon (SP) resonance development during the cell monolayer formation. The resonance red-shift results from the increment of the refractive index () corresponding to the increase of the cell coverage. (b) SP resonant wavelength (, upper panel) and corresponding refractive index change (right y-axis). The SP resonance depth (, lower panel) depends on the losses upon the SP propagation. This depth is proportional to total cell-medium interface length. (c) as function of the cell coverage resolves different phases in cell morphology: I- deposition and spreading of individual cells, II- cell-cell attachment, III- monolayer closure.  In course of the monolayer formation the SP resonant wavelength varies nonmonotonically. Eventually it shifts toward longer wavelength [Fig. 6(b), upper panel], indicating increase of the refractive index caused be the increase of the cell coverage. On the timescale of several hours the cell proliferation is negligible. This means that the number of cells does not change and the cell coverage grows as a result of cell-substrate attachment and cell spreading over the substrate. The magnitude of the SP resonance provides information on the cell layer structure as well. The resonant reflectivity depends on the losses upon SP propagation (i.e., scattering and absorption). The major mechanism that contributes to the at is the SP scattering at cell-medium interfaces [Fig. 2(b)]. The scattering occurs due to the difference of refractive indices between the cells and the medium, . From the dimensional considerations, the scattering cross section for the planar SP wave should scale with the length of the cell-medium interface; in other words, measures the length of the cell-medium perimeter per unit area. At the beginning (0 to 2 h), cells are still separated one from another so the perimeter () grows proportionally to the area/cell coverage (), although at the advanced stage [Fig. 6(b), phases II and III] changes very different from . Time-excluded representation of vs. cell coverage [Fig. 6(c)] provides better understanding of the cell morphology during monolayer formation. It pinpoints different phases of the process. Phase I corresponds to attachment and spreading of individual cells with concomitant growth of the cell coverage, and of the length of cell-medium interface. During phase II, the cell coverage continues to grow but does not. This corresponds to the cell-cell attachment between the neighboring cells. An additional increase of the at the end of phase II indicates that cells enlarge their projection on the substrate. We suggest that this change is associated with the development of protrusions (lamellipodia) by the marginal cells in the cell clusters. This increases the external perimeter of the clusters, similar to formation of lamellipodia at the wound margin.29 Finally, at phase III cells form a contiguous monolayer (with some voids). As these voids close the cell-medium interfaces shrink, resulting in a decrease of . 4.2.Cell DetachmentTrypsin is a pancreatic serine protease30 which is widely used to disrupt the cell-cell and cell-substrate adhesion. Here we measured the dynamics of trypsin-mediated detachment of MDCK cells from the Au-coated ZnS prism. Figure 7 shows that the massive cell detachment starts after a 5-min delay following the introduction of trypsin solution, while complete cell detachment takes another 10 min. In contrast to cell-substrate attachment, which starts from the stage of individual sedimented cells and is followed by the stage where the cells spread on the substrate; the detachment process starts from the cell monolayer and is followed by cell detachment. The latter is initiated not uniformly but at several specific locations. The weakest cell chain is broken first, than the next one and so on. This leads to opening of voids inside the cell layer. The inset [Fig. 7] compares two SP resonances measured at the same 60% cell confluence. The first one was measured during the attachment process and the second one was measured during trypsin-induced detachment. In the first spectrum, the SP resonance appears as a single dip corresponding to some effective medium, as expected for homogeneously dispersed cells (see Sec. 3.2). In the second spectrum, a very broad SP dip indicates on the existence of two different regions: adherent cells and cell-free substrate, as expected for a disrupted cell monolayer where contiguous regions are interspersed with large voids. This interpretation is also consistent with the optical microscopy observations (not shown here). Fig. 7Dynamics of Madin-Darby canine kidney cells (MDCK) cell detachment following exposure to 0.25% trypsin solution, as measured from the position. After a 5-min delay the cells start to detach one from another and from the substrate. The detachment is complete after 15 min. The inset compares the reflectivity spectra during attachment (dashed gray line) and detachment (solid black line) processes at 60% cell confluence. The narrow surface plasmon (SP) dip during attachment indicates that SP senses an effective medium consisting of cells and extracellular medium. The broad SP dip during detachment indicates that the SP dip arises from the two overlapping resonances: one from the cell-covered regions and another from uncovered regions. 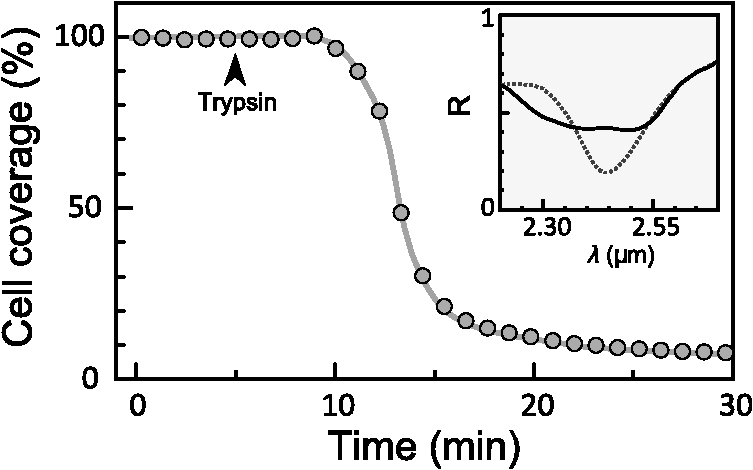 4.3.Chlorpromazine TreatmentChlorpromazine (CPZ) which is an amphipathic, antipsychotic agent, causes membrane corrugation in cells by the modulation of the outer cell membrane, as it was shown in the studies of red blood cells,31 endothelial,32 and epithelial cells.33 To track dynamics of this process through SP resonance we exposed a confluent human melanoma (MEL 1106) monolayer to 10 μM of CPZ. Figure 8(a) (upper panel) shows that is blue-shifted after CPZ introduction. This shift corresponds to the decrease of refractive index at cell-substrate region. This result is consistent with other studies.32,33 Explicitly, the measures penetration of extracellular medium between the cells and the substrate. Figure 8(b) schematically shows the cell morphological change induced by CPZ. The increment of [Fig. 8(a), lower panel] suggests increase of the cell-medium interface length, which is also consistent with the above interpretation. The effect of CPZ appears to be reversible. CPZ removal results in fast recovery of and (within ~45 min) and indicates that cell morphology recovers to its normal shape during this time. Fig. 8Surface plasmon (SP) follows the chlorpromazine (CPZ)-induced morphological changes in the MEL-1106 (human melanoma) cells. (a) The dynamics (upper panel) shows that the exposure to CPZ results in the refractive index () decrease. The dynamics (lower panel) indicates that the cell-substrate attachment region becomes corrugated and this results in increased SP losses. When the CPZ was washed out, both parameters recovered within 40 min. (b) Schematic illustration of the cell morphology for a CPZ treated () and untreated cell (). The cell outer membrane is corrugated in the presence of CPZ and recovers upon CPZ removal.  4.4.Progressive Polarization of the Epithelial CellsThe epithelium cell layer acts as an active barrier between lumen and serosa and enables transport of chemical substances between these two compartments.34 This function crucially depends on cell polarization, namely the difference between the apical and basal (the side that is attached to substrate) parts of the cell.28 The polarized epithelial cells typically have columnar shape, which is achieved through formation of intercellular junctions such as tight junctions.28,34 Here we utilized combination of SP and guided modes to measure changes in cell morphology during polarization of intestinal epithelial cells (IEC6). Suspended IEC6 cells were seeded on the Au-substrate and allowed to form a continuous monolayer. For the freshly formed IEC6 monolayer the wavelength of the guided mode yielded an average layer thickness (cell height) of only 6.0 μm [Fig. 9(a), ] while the analysis of the SP resonance indicated that these cells are well attached to the substrate. Simultaneous optical microscopy showed that these freshly sedimented cells have elongated, asymmetric morphology [Fig. 9(b), ]. During the subsequent 5.5-h period, (i) the cell height grew to 12.2 μm, (ii) the mode appeared in the infrared reflectivity spectrum, indicating on high uniformity of the cell layer, and (iii) the SP resonance shifted towards shorter wavelength, suggesting entrance of the extracellular medium beneath the cell layer [see Fig. 9(b), schematic drawing]. The optical images show that by this time the cells have already adopted the epithelial-like cobblestone shape [Fig. 9(a), ], typical for polarized cell phenotype. Figure 9(c) shows the real-time kinetics of the whole process. During the first couple of hours the average cell height grew exponentially from 6 to 12.2 μm, whereas the refractive index of the basal cell region decreased with similar dynamics. Fig. 9(a) The infrared reflectivity spectra from a confluent IEC6 intestinal cell monolayer on Au substrate. Each spectrum reveals the surface plasmon (SP) and guided mode (TM) resonances. The red line stays for the freshly formed monolayer (nonpolarized cells) while the blue line stays for the same monolayer after a 5.5-h incubation period (polarized cells). (b) Upper panel: optical images of the cells taken at the same time points as in (a). The bar represents 20 μm. Lower panel: Schematic representation of the nonpolarized and polarized simple epithelium. (c) Dynamics of (upper panel) and (lower panel) reveal the kinetics of cell polarization. measures the cell height. While the height of freshly formed cell monolayer is 6 μm, it takes 2 h to achieve the maximum monolayer height of 12.2 μm. The indicates concurrent decrease of the effective cell refractive index.  5.DiscussionBy extending the surface plasmon spectroscopy to the infrared range we became able to measure cell morphology in a label-free manner. The surface plasmon is extremely sensitive to the cell-substrate region. Note that the surface plasmon in the visible range probes only cell-substrate attachment due to its short sampling depth of 0.1 to 0.5 μm. Therefore, it has a difficulty in probing the cells cultured on extracellular matrix, which extends the distance between the cell body and the substrate even more. Since the sampling depth of the infrared surface plasmon reaches several microns and can be adjusted for specific assay by choosing the proper wavelength, it has no difficulty in probing the living cells cultured on extracellular matrices. The relatively large sampling depth of the infrared surface plasmon provides an additional advantage for cell studies. The infrared surface plasmon is sensitive not only to cell-substrate region but to more distant parts of the cell body as well. This allows one to follow the changes in the cell-cell attachment. We showed how the surface plasmon resonance magnitude and wavelength yield information about the structure of adherent cells. Namely, we could distinguish between individual cells, cell clusters or contiguous cell layer. Our method allows one to follow not only the slow processes such as cell sedimentation, but the faster processes as well. In particular, we were able to track in real-time the trypsin-induced detachment and cell membrane modulation with chlorpromazine. The infrared-guided modes excited inside the cell monolayer give an additional functionality—they can measure the cell-cell adhesion and cell height. This label-free method has obvious advantages over such methods as confocal microscopy that requires fluorescent labeling. AcknowledgmentsThis work was supported by the NOFAR grant of the Israel Ministry of Industry and Trade. We are grateful to the Yissum Research & Development Company of the Hebrew University of Jerusalem for financial support. Vladislav Lirtsman acknowledges support from the Lady Davis Fellowship Foundation. ReferencesM. A. Cooper,
“Optical biosensors in drug discovery,”
Nat. Rev. Drug Discov., 1
(7), 515
–528
(2002). http://dx.doi.org/10.1038/nrd838 NRDDAG 1474-1776 Google Scholar
M. A. Cooper,
“Non-optical screening platforms: the next wave in label-free screening?,”
Drug Discov. Today, 11
(23–24), 1068
–1074
(2006). http://dx.doi.org/10.1016/j.drudis.2006.10.001 DDTOFS 1359-6446 Google Scholar
S. M. ShamahB. T. Cunningham,
“Label-free cell-based assays using photonic crystal optical biosensors,”
Analyst, 136
(6), 1090
–1102
(2011). http://dx.doi.org/10.1039/c0an00899k ANLYAG 0365-4885 Google Scholar
R. Ziblatet al.,
“Infrared surface plasmon resonance: a novel tool for real time sensing of variations in living cells,”
Biophys. J., 91
(2), 776
–776
(2006). http://dx.doi.org/10.1529/biophysj.106.0900139 BIOJAU 0006-3495 Google Scholar
Y. Yanaseet al.,
“The SPR signal in living cells reflects changes other than the area of adhesion and the formation of cell constructions,”
Biosens. Bioelectron., 22
(6), 1081
–1086
(2007). http://dx.doi.org/10.1016/j.bios.2006.03.011 BBIOE4 0956-5663 Google Scholar
Y. Fanget al.,
“Resonant waveguide grating biosensor for living cell sensing,”
Biophys. J., 91
(5), 1925
–1940
(2006). http://dx.doi.org/10.1529/biophysj.105.077818 BIOJAU 0006-3495 Google Scholar
R. Horvathet al.,
“Multidepth screening of living cells using optical waveguides,”
Biosens. Bioelectron., 24
(4), 799
–804
(2008). http://dx.doi.org/10.1016/j.bios.2008.06.059 BBIOE4 0956-5663 Google Scholar
L. L. Chanet al.,
“A label-free photonic crystal biosensor imaging method for detection of cancer cell cytotoxicity and proliferation,”
Apoptosis, 12
(6), 1061
–1068
(2007). http://dx.doi.org/10.1007/s10495-006-0031-y 1360-8185 Google Scholar
Y. A. Abassi,
“Dynamic monitoring of cell adhesion and spreading,”
Genetic Eng. Biotechnol. News, 28
(18), 6
–9
(2008). Google Scholar
C. R. Keeseet al.,
“Electrical wound-healing assay for cells in vitro,”
Proc. Natl. Acad. Sci. USA, 101
(6), 1554
–1559
(2004). http://dx.doi.org/10.1073/pnas.0307588100 1091-6490 Google Scholar
C. Fredrikssonet al.,
“The piezoelectric quartz crystal mass and dissipation sensor: a means of studying cell adhesion,”
Langmuir, 14
(2), 248
–251
(1998). http://dx.doi.org/10.1021/la971005l LANGD5 0743-7463 Google Scholar
J. WegenerA. JanshoffC. Steinem,
“The quartz crystal microbalance as a novel means to study cell-substrate interactions in situ,”
Cell Biochem. Biophys., 34
(1), 121
–151
(2001). http://dx.doi.org/10.1385/CBB:34:1:121 Google Scholar
C. M. Cuerrieret al.,
“Surface plasmon resonance monitoring of cell monolayer integrity: implication of signaling pathways involved in actin-driven morphological remodeling,”
Cell. Mol. Bioeng., 1
(4), 229
–239
(2008). http://dx.doi.org/10.1007/s12195-008-0028-4 1865-5025 Google Scholar
V. Yashunskyet al.,
“Real-time monitoring of transferrin-induced endocytic vesicle formation by mid-infrared surface plasmon resonance,”
Biophys. J., 97
(4), 1003
–1012
(2009). http://dx.doi.org/10.1016/j.bpj.2009.05.052 BIOJAU 0006-3495 Google Scholar
V. Yashunskyet al.,
“Real-time monitoring of epithelial cell-cell and cell-substrate interactions by infrared surface plasmon spectroscopy,”
Biophys. J., 99
(12), 4028
–4036
(2010). http://dx.doi.org/10.1016/j.bpj.2010.10.017 BIOJAU 0006-3495 Google Scholar
W. Knoll,
“Interfaces and thin films as seen by bound electromagnetic waves,”
Ann. Rev. Phys. Chem., 49 569
–638
(1998). http://dx.doi.org/10.1146/annurev.physchem.49.1.569 ARPLAP 0066-426X Google Scholar
J. Homola,
“Present and future of surface plasmon resonance biosensors,”
Anal. Bioanal. Chem., 377
(3), 528
–539
(2003). http://dx.doi.org/10.1007/s00216-003-2101-0 ABCNBP 1618-2642 Google Scholar
M. Golosovskyet al.,
“Midinfrared surface-plasmon resonance: a novel biophysical tool for studying living cells,”
J. Appl. Phys., 105
(10), 1020
–1021
(2009). http://dx.doi.org/10.1063/1.3116143 JAPIAU 0021-8979 Google Scholar
V. LirtsmanM. GolosovskyD. Davidov,
“Infrared surface plasmon resonance technique for biological studies,”
J. Appl. Phys., 103
(1), 014702
(2008). http://dx.doi.org/10.1063/1.2828162 JAPIAU 0021-8979 Google Scholar
A. Zilbershteinet al.,
“Quantitative surface plasmon spectroscopy: determination of the infrared optical constants of living cells,”
Vib. Spectros., 61 43
–49
(2012). http://dx.doi.org/10.1016/j.vibspec.2012.01.019 VISPEK 0924-2031 Google Scholar
H. Raether, Surface-plasmons on Smooth and Rough Surfaces and on Gratings, Springer-Verlag, Berlin/New York
(1988). Google Scholar
A. ShalabneyI. Abdulhalim,
“Sensitivity-enhancement methods for surface plasmon sensors,”
Laser Photon. Rev., 5
(4), 571
–606
(2011). http://dx.doi.org/10.1002/lpor.v5.4 1863-8880 Google Scholar
A. ShalabneyI. Abdulhalim,
“Figure-of-merit enhancement of surface plasmon resonance sensors in the spectral interrogation,”
Opt. Lett., 37
(7), 1175
–1177
(2012). http://dx.doi.org/10.1364/OL.37.001175 OPLEDP 0146-9592 Google Scholar
K. Johansenet al.,
“Imaging surface plasmon resonance sensor based on multiple wavelengths: sensitivity considerations,”
Rev. Sci. Instrum., 71
(9), 3530
–3538
(2000). http://dx.doi.org/10.1063/1.1287631 RSINAK 0034-6748 Google Scholar
P. E. MortonM. Parsons,
“Dissecting cell adhesion architecture using advanced imaging techniques,”
Cell Adhes. Migrat., 5
(4), 351
–359
(2011). http://dx.doi.org/10.4161/cam 1933-6918 Google Scholar
S. MichaelisR. RobelekJ. Wegener,
“Studying cell-surface interactions in vitro: a survey of experimental approaches and techniques,”
Adv. Biochem. Eng. Biotechnol., 126 33
–66
(2012). ABEBDZ 0724-6145 Google Scholar
K. Giebelet al.,
“Imaging of cell/substrate contacts of living cells with surface plasmon resonance microscopy,”
Biophys. J., 76
(1 Pt. 1), 509
–516
(1999). http://dx.doi.org/10.1016/S0006-3495(99)77219-X BIOJAU 0006-3495 Google Scholar
D. M. BryantK. E. Mostov,
“From cells to organs: building polarized tissue,”
Nat. Rev. Mol. Cell. Biol., 9
(11), 887
–901
(2008). http://dx.doi.org/10.1038/nrm2523 NRMCBP 1471-0072 Google Scholar
G. FenteanyP. A. JanmeyT. P. Stossel,
“Signaling pathways and cell mechanics involved in wound closure by epithelial cell sheets,”
Curr. Biol., 10
(14), 831
–838
(2000). http://dx.doi.org/10.1016/S0960-9822(00)00579-0 CUBLE2 0960-9822 Google Scholar
W. E. BrownF. Wold,
“Alkyl isocyanates as active-site-specific reagents for serine proteases. Reaction properties,”
Biochemistry, 12
(5), 828
–834
(1973). Google Scholar
H. HagerstrandB. Isomaa,
“Morphological characterization of exovesicles and endovesicles released from human erythrocytes following treatment with amphiphiles,”
Biochem. Biophys. Acta., 1109
(2), 117
–126
(1992). http://dx.doi.org/10.1016/0005-2736(92)90074-V BBACAQ 0006-3002 Google Scholar
I. S. Huecket al.,
“Chlorpromazine modulates the morphological macro- and microstructure of endothelial cells,”
Am. J. Physiol. Cell. Physiol., 278
(5), C873
–C878
(2000). 0363-6143 Google Scholar
Y. LiJ. ZhangB. Zhang,
“Atomic force microscopy study on chlorpromazine-induced morphological changes of living HeLa cells In Vitro,”
Scanning, 31
(6), 259
–265
(2009). http://dx.doi.org/10.1002/sca.20174 SCNNDF 0161-0457 Google Scholar
E. Rodriguez-BoulanW. J. Nelson,
“Morphogenesis of the polarized epithelial cell phenotype,”
Science, 245
(4919), 718
–725
(1989). http://dx.doi.org/10.1126/science.2672330 SCIEAS 0036-8075 Google Scholar
|


