
|
|
1.IntroductionAutofluorescence spectroscopy is one of the noninvasive techniques that have different applications in the characterization of tissues and the diagnosis of a large number of different diseases.1 Metabolic states of the cells and conformations of macromolecules, in both quantity and microenvironment, could be reflected by changes of endogenous chromophores that are mainly represented by amino acids, flavin adenine dinucleotide (FAD), and reduced nicotinamide adenine dinucleotide (NADH).2 Both NADH and FAD play key roles in the conversion of energy from acetyl CoA, derived from food molecules, to adenosine triphosphate (ATP), the most important molecule for capturing free energy in cells. NADH functions as a coenzyme and is one of the primary electron donors, while FAD cofactor is among the electron acceptors in electron transport chain (ETC) of the oxidative phosphorylation. These metabolic electron carriers exist in two physiological forms, free and protein bound, and upon binding to mitochondrial membrane proteins they are associated with energy generation. NADH molecules carry away the energy liberated in these reactions in the form of a hydride ion, a hydrogen atom with two electrons.3 When the hydride ion is lost, NADH becomes . FAD is also used to carry energy away from the citric acid cycle. FAD removes two hydrogen atoms from the four-carbon compound succinate and becomes . Thus, monitoring the ratio between free and enzyme-bound forms of these fluorophores can give an insight into the metabolic state of cells. The nature of bacterial infections and their influence on cells are of critical interest to researchers in large area of disciplines, such as microbiology, medicine, and drug design. It has been known that enterohemorrhagic Escherichia coli (EHEC) and enteropathogenic Escherichia coli (EPEC) are important human pathogens that cause persistent diarrhea, especially in young children.4 EHEC and EPEC have similar but unique 35-kb pathogenicity island, the locus of enterocyte effacement (LEE), which contains genes critical for the bacterial virulence. Both of them colonize the intestinal mucosa and induce attaching and effacing (A/E) lesions, which are characterized by the destruction of intestinal microvilli and formation of polymerized actin structure beneath the bacterium called pedestal.5,6 To do so, the bacterial LEE islands encode type III secretion systems (TTSS) to deliver bacterial effector proteins into host cells to subvert host cell signaling pathways. One of the effector proteins of TTSS, Tir, is translocated into the host cell membrane and consequently interacts with a bacterial outer membrane protein, intimin, and this interaction triggers cytoskeletal rearrangements.7 Moreover, EHEC and EPEC would modulate the survival of host cell by interfering with pro-and antiapoptotic pathways. According to previous studies, EPEC could induce extrinsic and intrinsic apoptotic pathways by bacterial surface bundle-forming pili8,9 and effector proteins, such as EspF and Map.10–14 EPEC also antagonizes proapoptosis by delivering antiapoptosis effectors, such as EspZandNleH, to promote cell survival.15 Therefore, EPEC-infected cells only exhibit early-phase apoptotic features (expression of phosphatidylserine on the cell surface and DNA cleavage) and features of late-phase apoptosis (cell shrinkage, membrane blebbing, and nuclear condensation) are not observed.16,17 All these studies suggest a change of the cellular metabolism as a result of bacterial infection. NADH and FAD are intrinsically excitable to generate fluorescence, but their respective redox partners, and , are not.18 Strong NADH absorption takes place in the ultraviolet (UV) range, with a maximum wavelength at around 360 nm. The resulting emission maximum is at around 460 nm. As a comparison, FAD absorbs in the blue, with absorption maximum at around 470 nm and emits green/yellow, with an emission maximum at around 540 nm.19 The emission spectra of free and protein-bound forms of these fluorophores differ slightly and the overlapping endogenous spectra make it difficult to distinguish between individual components. In addition to measurements of the fluorescence intensity of NADH and FAD, further information on the metabolic state of a biological sample can be obtained from the fluorescence lifetimes of NADH and FAD by the use of fluorescence lifetime imaging microscopy (FLIM). The method is based on the measurement of the average time fluorescent molecules spent on the excited state levels.20 The values of fluorescence lifetime for a given chromophore is calculated by fitting a measured fluorescence decay. Among other parameters, fluorescence lifetime of a given chromophore can be affected in the proximity of a quencher and/or energy transfer. This makes FLIM a useful technique for probing molecular conformation. In particular, free and bound states of NADH and FAD have well-separated values of fluorescence lifetimes, caused by quenching by adenine moiety at folding.21 As NADH binds to a protein, its lifetime increases from to .22–25 The fluorescence lifetime of free FAD is thought to be around 2.3 ns.26 However, a number of short lifetime components, on the order of tens of picoseconds, have also been reported.27,28 The fluorescence lifetime of bound FAD is 0.3 ns, which is lower than that of free FAD.29 The fluorescence lifetime values measured from FAD in our studies differ from some of the publications, but are in agreement with others. Spectral properties of these molecules seem to vary between different tissues and cell cultures. Fitting the fluorescence decay of either NADH or FLIM to a double exponential model may give also an insight into the relative concentration of these coenzymes functional states (noted as and ). As NADH binds to a protein complex on mitochondrial inner membrane, it donates an electron, which, passed through several other protein complexes, called electron transfer chain, contributes to the hydrogen protons pumping to the intermembrane space, development of electromotive force, downhill flow of protons through the ATP synthase, and as a result, phosphorylation of ADP. NADH binding then can be directly associated with ATP synthesis and correlated with the metabolic activity of a cell. Molecular dynamics that elucidates the bioenergetics of cells in culture allows proper characterization of the range of the free to bound changes of NADH/FAD in normal state. This provides a baseline for studying cellular pathophysiology. The metabolic mapping in cell culture by means of FLIM has been demonstrated earlier.30,31 In this study we used FLIM to investigate changes in cellular metabolism during early apoptosis caused by EHEC infection and the results are compared with the FLIM data obtained from the staurosporine (STS)-treated cells. 2.Materials and Methods2.1.Sample PreparationCervical carcinoma HeLa cells were seeded at a concentration of on 24-mm-diameter round glass cover slips (Deckglaser) coated with poly-L-lysine (Sigma). Coverslips were kept in 3.5 cm dishes filled with growth media [(DMEM) supplemented with 10% fetal bovine serum] and incubated in humidified atmosphere at 37°C with 5% overnight. The cells were then washed with phosphate-buffered saline (PBS) and replenished with phenol red-free DMEM (Gibco BRL). Infection to the cells was accomplished by overnight incubation with wild-type (WT) EHECO157∶H7 (ATCC 43888) with dilution of 1∶50 with further incubation at 37°C in 5% incubator for 1 h. After infection, cover slips were washed with PBS and then overlaid with phenol red-free DMEM for another 3 and 5 h for observations of NADH/FAD autofluorescence and pedestal formation, respectively. For the treatment with apoptosis inducer, we used staurosporine (STS) (Sigma) at a concentration of 4 μM as a medium dose.32,33 HeLa cells () were similarly cultured as described above. The cells were then washed with PBS and replenished with phenol red-free DMEM containing 4 μM STS at 37°C in 5% incubator for 1 h, and autofluorescence observed for 3 h. 2.2.Flow CytometryThe procedure of sample preparation is similar to that of autofluorescence observation. To facilitate the flow cytometry measurement, of HeLa cells were used. After the infection or the STS treatment, cells were harvested and stained with FITC annexin V or 7-amino-actinomycin (7-AAD) (BD Biosciences). The percentage of the annexin V-stained or the 7-AAD-stained cells was analyzed by flow cytometer (BD FACS Canto) within 1 h. 2.3.ImagingFor both NADH and FAD FLIM observations, infected and control cells were excited by a mode-locked Ti:Sapphire Mira F-900 laser (Coherent), pumped by a solid-state frequency-doubled 532 nm Verdi laser (Coherent) and operating in two-photon mode at 740 and 860 nm, for the excitation of NADH and FAD, respectively. The excitation beam was coupled to the FV300 scanning unit (Olympus)34 with the scanning speed set by a function generator (AFG310; Tektronix) for the image acquisition optimization. The beam was focused on the sample with a plan apochromat oil immersion objective (Olympus). An average laser power of (power at focus is much more meaningful) above the objective was used for imaging in order to prevent photo damage of the cells.35 Imaging was conducted on a modified inverted Olympus microscope (IX 71) completed with incubator (H-201, Oko-Lab) to maintain the viable physiological and physicochemical conditions of 37°C and 5% . To match the spectral characteristics of excited molecules we used band-pass filters of and (Semrock) for detection of NADH and FAD autofluorescence, respectively.36 For rejection of the excitation light at 740 nm, we used an additional short-pass and infrared (IR) cut-off filters. The autofluorescence from the cells has been detected by a cooled GaAsP PMT (H7422-P40; Hamamatsu Photonics). Time-resolved data acquisition has been conducted by time-correlated single photon counting system (SPC-830; Becker&Hickl).37 All FLIM images were taken at resolution with the accumulation time of 600 s for collecting enough photon counts for statistics data analysis. 2.4.Data AnalysisThe analysis of collected data has been done with the SPCImage (v. 2.8) software package (Becker & Hickl GmbH).38 Lifetime calculation from the multiexponential decay was performed by mathematical convolution of a model function and the instrument response function (IRF) with fitting to the experimental data. Lifetimes from the composite decays of both NADH and FAD were derived by convolution of an IRF, , with a double-exponential model function, defined in Eq. (1), with offset correction for the ambient light and/or dark noise to obtain calculated lifetime decay function in Eq. (2): Here and represent the contributed fluorescence decays from short and long lifetime components of NADH, respectively. and are their corresponding lifetime constants; and are the corresponding relative amplitudes. was measured experimentally with the PPLN crystal at 370 nm and 480 nm for NADH and FAD imaging, respectively (the second harmonic of 740 nm and 860 nm from the Ti:Sapphire laser).Taking into account that IRF is a limiting factor in fluorescence lifetime measurements, deconvolution was applied to all decays in an image to overcome this problem.The decay FWHM in both cases thus obtained was equal to . The average lifetime was calculated as an amplitude-weighted of the two lifetime components: The model parameters (i.e., and ) were derived by fitting the decay , from Eq (2), to the actual data through minimizing the goodness-of-fit function defined in Eq (3b) using the Levenberg-Marquardt search algorithm. Here is the number of the data (time) points (equal to 256), and is the number of the model parameters. The ratio of and is the best indicator of free and protein-bound states of NADH and FAD and can be used to indicate the status and changes in cellular metabolism.30 3.Results and DiscussionMitochondria-mediated apoptosis involves a series of biochemical events including mitochondrial membrane potential (MMP) disruption, cytochrome C release, and various caspases’ activation. It has been previously reported that average NADH fluorescence lifetime exhibited a significant increase after 1 μM STS-induced mitochondria-mediated apoptosis.30 The results suggest that the increment of NADH fluorescence lifetime indicative of an increase of the bound NADH relative concentration could be related to changes of mitochondrial function and may be used as noninvasive optical probes for early detection of programmed cell death. In order to eliminate bacterial autofluorescence that may interfere with the observation of cellular NADH and FAD autofluorescence, nonattached bacteria were washed away after 1 h of infection prior to NADH and FAD autofluorescence detection for another 3 to 5 h. In a parallel experiment, infectivity of EHEC was examined by staining bacteria and cellular actin for the pedestal formation. Figure 1 shows that EHEC can adhere and contributes to the formation of pedestal structure. Fig. 1Pedestal formation after HeLa cells were infected with EHEC for 6 h. Pedestal formations (arrows) were observed by fluorescent microscopy. Bacteria were visualized by staining with an anti-EHEC O-antigen antibody (green); actin was detected by staining with Texas Red Phalloidin (red). The scale bar is 10 μm.  3.1.Bacteria Can Induce Early Stage of ApoptosisTo investigate whether EHEC also affects cellular signaling, such as apoptosis, HeLa cells were separately infected with EHEC, an EHEC mutant with one of the TTSS gene (escN) deletion, JM109 (a nonpathogenic K-12 E. coli strain),and UV-inactivated JM109. After infection, the cells were then measured for the apoptotic percentages by flow cytometry with Annexin V and 7-AAD staining. By doing so, the infected cells were discriminated into viable (), early apoptotic cells (), and late apoptotic cells or dead cells (). In addition, HeLa cells were treated with 4 μM STS as a known apoptosis positive control. After 4 h of infection, 66.5% and 12.1% of the EHEC-infected cells were found to be at early and late apoptotic phases, respectively. Notably 29.1% and 9.7% of noninfected cells at early and late stage of apoptosis were probably due to the fact that some damage occurred to cellular membrane during the detachment process. In contrast, the STS-treated cells yielded a lower percentage of the early apoptotic cells (53.4%) than that of the EHEC infected cells, whereas the percentage of cells stained at the late apoptotic phase (22.7%) was higher than that of the EHEC-infected cells. Therefore, these results supported the notion that the EHEC infection induces early apoptosis but slightly inhibits the late apoptosis. To further investigate whether TTSS is a necessity for apoptotic response during the infection, the escN—deleted EHEC was used to infect cells, which were analyzed by flow cytometry.39 Figure 2 and Table 1 show that these TTSS-defected bacteria () resulted in a lower percentages of apoptotic cells than those of the parental EHEC, suggesting the enhancing effect of TTSS on apoptosis. Furthermore, we used nonpathogenic JM109 and UV-inactivated JM109 as controls such that the effect of live, nonpathogenic bacteria and the lipopolysaccharide (LPS) from the dead bacteria could be evaluated, respectively. Whereas a total of 78.6% of apoptotic cells was associated with the infection with EHEC, only 55.1% of apoptotic cells were associated with that of JM109, and 44.2% from that with the UV-inactivated JM109. These observations consolidate the notion that pathogenic EHEC induce an apoptotic response in host cells, particularly with early apoptotic feature. Percentages of the late apoptotic cell were not significantly altered when compared with that of the control HeLa cells. Fig. 2Flow cytometry data showing apoptosis percentage of HeLa cells upon bacterial infection and STS-treatment. The and axes represent the intensity of FITC annexin V and 7-AAD, respectively. The percentage of cells in each cellular state (viable, early apoptotic cells, late apoptotic cells, or dead cells) is shown inside the cross. (a) HeLa cells only. (b) EHEC infected cells. (c) STS-treated cells. (d) Cells infected with escN-deleted EHEC. (e) JM109-infected cells. (f) cells treated with UV-inactivated JM109.  Table 1Percentage of the apoptosis probability in HeLa cells only, WT EHEC infected, STS-treated and ΔescN EHEC infected, JM109 infected, and UV-inactivated JM109 infected HeLa cells.
Mitochondria have been shown to be essential for cell metabolism and are one of the primary organelles affected by apoptosis. In particular, MMP disruption would lead to the failure of oxidative phosphorylation apoptosis (high ATP).40,41 The disruption could also lead to necrosis (low ATP). Our results described above indicate that EHEC induces early apoptotic response in the host cells. Furthermore, a complete, active TTSS of EHEC also enhanced apoptosis. 3.2.Cell Metabolism Perturbations by InfectionRecent studies showed that using multiphoton FLIM of NADH is a powerful tool to study cellular metabolism in living cells.29,42 NADH fluorescence lifetimes differ distinctly in cytosol, mitochondria and nucleus in single cell.43–45 Different bindings of NADH to proteins may result in different NADH fluorescence lifetimes that reflect the diverse physiological functions in these cellular compartments. To reveal metabolic changes in cells upon infection, cultured HeLa cells were continuously imaged during the 3 h after incubation with EHEC. Control noninfected HeLa cells were also imaged under the same conditions. We used from Eq. (3) along with the ratio of relative contributions from free and bound species () of both NADH and FAD to indicate the cellular metabolic states29 (Fig. 3). Fig. 3Bar charts for the peak values of ratio histograms, averaged for each hour after the treatment and control. (a) Time-lapse dynamics of NADH ratio measured from HeLa cells infected by EHEC. (b) Time-lapse dynamics of FAD ratio measured from HeLa cells infected by EHEC. (c) Table of hourly averaged summaries from at least five measurements of the peak values from NADH and FAD distribution histograms. (d) Representative color-coded FLIM images of the dynamic of the ratio of NADH. (e) Representative color-coded FLIM images of the dynamic of the ratio of FAD. The error bar represents the standard deviation for the ratio measurements. The scale bar is 100 μm. 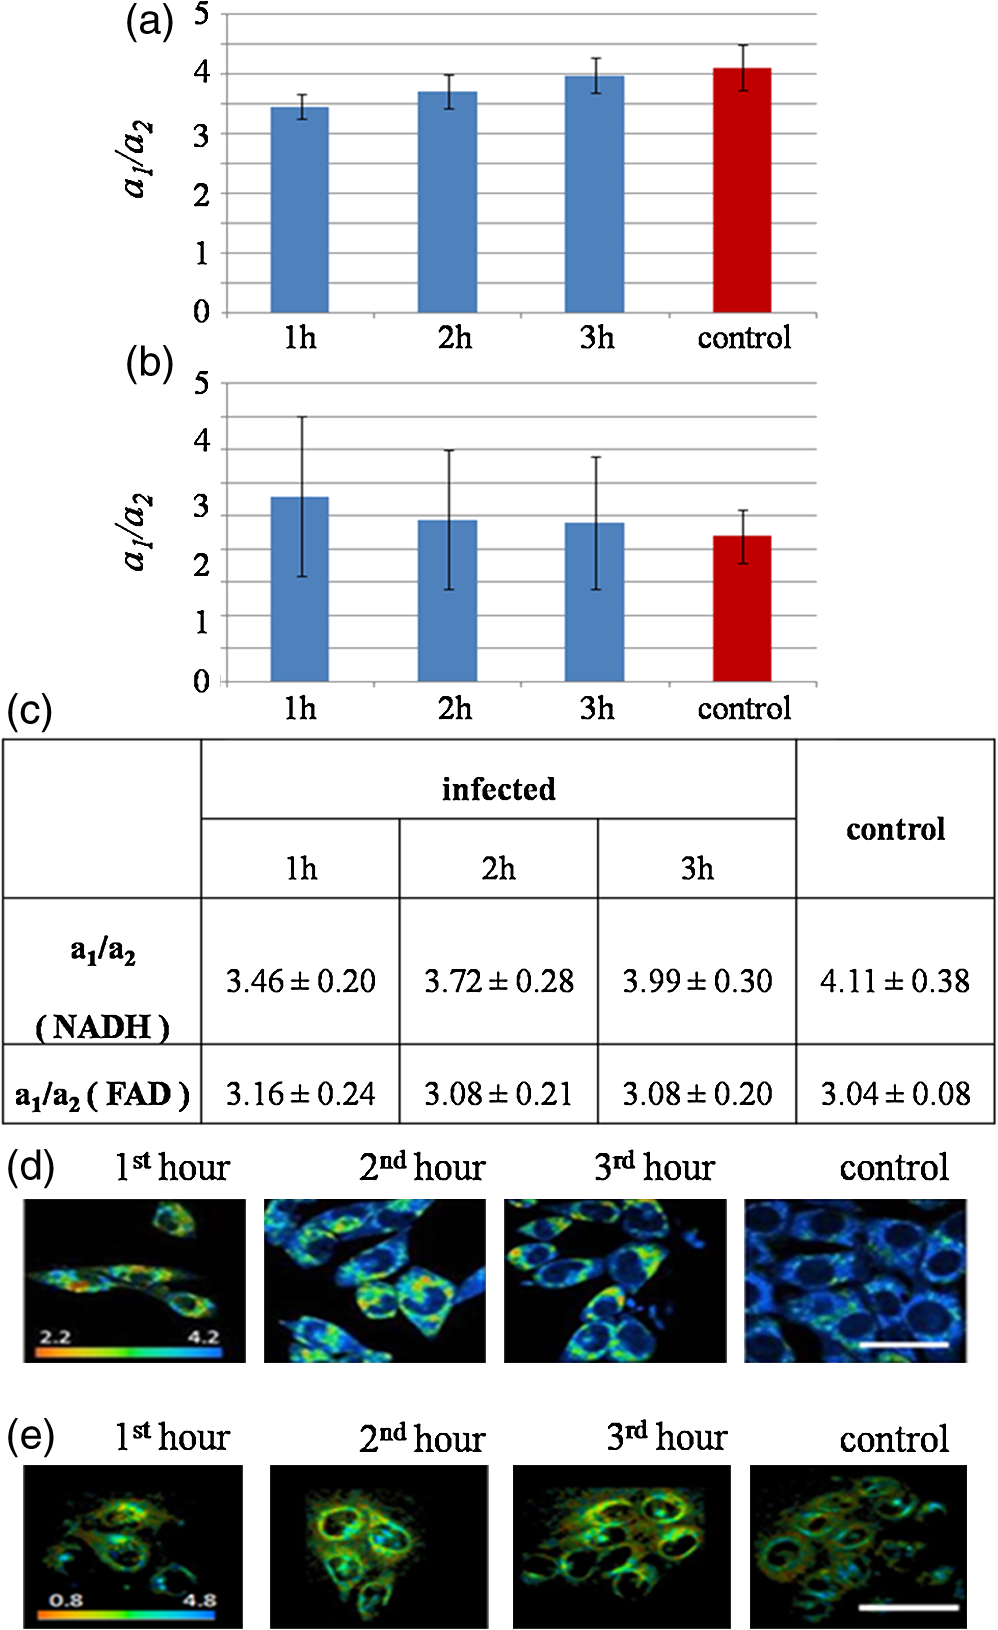 ratio of free and bound form of NADH () was observed at the initial phase of infection [Fig. 3(b)]. During the next 2 h of imaging, this ratio increased gradually up to at the third hour. Control value of is equal to . Similar results of ratio of NADH in mouse embryonic epithelial fibroblast NIH 3T3 cells have been reported by Buryakina et al.46 Most of the free energy released during oxidation of glucose to is retained in NADH and generated in glycolysis and the citric acid cycle. During respiration, electrons are released from NADH and then transferred to [Eqs (3) and (4)]: Figure 3(b) shows the relative intensity ratios of free and protein-bound FAD in HeLa cells, which exhibits opposite dynamics of changes in ratio in NADH during the same time of bacterial infection. The values of both of NADH and FAD are represented in Fig. 3(c). The increase of ratio of NADH and its decrease in FAD during infection are also illustrated in Fig. 3(d) and 3(e), respectively. ratio of NADH is increasing with infection time and the highest value is for control. In Fig. 3(b), ratio of FAD is decreasing with time and the lowest value is detected for the control. So in the case of NADH, after 1 h of infection protein-bound component increases, if free component is assumed unchanged. The shift of both NADH and FAD ratios to their control values at 3 h could be also used as the opposite trend of changes in time for donor coenzyme and acceptor co-factor. To assure that an infection results in cell apoptosis, we used STS, a well-known apoptosis inducer to treat the cells. At the first hour, we observed a high value of the mean lifetime of NADH at that decreased to at the third hour. Control sample has a value of , which is higher than those of the infected samples even at the first hour [Fig. 4(a)]. Fig. 4Column bar chart for the peak values of mean lifetime histograms, averaged for each hour after the treatment and control. (a) Mean lifetime of NADH of HeLa cells infected by EHEC. (b) Mean lifetime of HeLa cells treated by 4 μM of STS. The error bar represents the standard deviation for the ratio measurements.  Under similar experimental conditions, STS-treated cells exhibit a slight decrease of mean lifetime of NADH, from ps at the first hour of infection to at third hour, which is still higher than the mean lifetime value of the control sample [Fig. 4(b)]. Free and protein-bound components lifetimes ( and ) have peaks at and , respectively. These results are close to the previously published lifetime values of free to 500 ps and bound NADH to 3000 ps.19,47 Broader distribution of may be attributed to the wide distribution of lifetimes of NADH molecules bound to different proteins. Observed dynamics of dramatically high mean lifetime and its decrease in time upon both the addition of STS and infection was caused by the changes of the free and bound species’ relative fractions. The lifetime shift could be attributed to the fact that free NADH fraction is diminished to an extent after both treatments. Gradual increase exhibited by (data not shown) corresponds to the moving of average lifetime to the lower values at the time-lapsed imaging. It has been reported previously by Gukassyan et al.30 that upon the addition of 1 μM STS, cells exhibit a rapid and dramatic increase of the average lifetime from to . STS treatment at the first hour in our experiment resulted in a similar lifetime value of . The value was decreasing during the next 2 h. Obviously, bacterial infection and the STS-treatment resulted in a similar trend of decreasing lifetimes with time. The increase in the average lifetime of NADH fluorescence after STS-induced apoptosis may be attributed to the higher portion of bound NADH relative to that of free NADH. An additional explanation to account for our results is that the bound NADH lifetime increases when compared to free NADH lifetime. Observed decrease in time during possible apoptosis in both cases of STS-treatment and bacterial infection suggests that there may exist some fast dynamics of NADH lifetime in the first hour with further decrease, which, however, could not be detected more properly and are a subject for future studies. High fluorescence and metabolically active perinuclear ring represents a subpopulation of mitochondria that are mobilized in response to the apoptotic stimulus and may provide the energy required to execute the last step of apoptosis. Infected cells did not give the morphology changes mentioned above during 3 h of infection as the STS treatment. However, the fluorescence was becoming intense as the cells were undergoing a longer time of infection. During early apoptosis there is some loss of mitochondrial function, so that mean lifetime increases, because of free lifetime component of NADH remains constant and the protein-bound one increases. Bound NADH lifetime increases, assuming that the free NADH lifetime does not change, due to microenvironment changes that NADH binds to different enzymes during early apoptosis. Another possible reason is that the portion of bound NADH in total amount of NADH is higher than that of free NADH, assuming their lifetimes remain the same. It can be observed because some NADH may bind to different enzymes, so that lifetime distribution could become broader. The most common optical method for metabolic imaging is the redox ratio, which is the ratio of the fluorescence intensity of FAD and NADH. To calculate redox ratio we exported values of intensity in each pixel in useful FOV from both FAD and NADH by using included tool in SPCImage sofware before obtaining the lifetime images and calclulated the ratio of initial intensities.This ratio provides relative changes in the oxidation-reduction state in the cell. We also monitored the redox ratio of HeLa cells in both infection with bacteria and STS treatment (Fig. 5). Fig. 5Time-lapsed dynamics of redox ratio in HeLa cells. (a) Infection with EHEC. (b) Treatment with 4 μM STS. The error bar represents the standard deviation for the ratio measurements.  Conversion of NADH fluorescence intensity values to absolute concentration values is not straightforward. Therefore, this situation poses a limitation for NADH FLIM. In addition, the fluorescence decay parameters of the phosphorylated and nonphosphorylated forms of reduced are similar and indistinguishable. However, estimations of the cellular concentrations suggest that a substantial part of the cellular fluorescence originates from NAD(P)H rather than from NADH.39 The influence the NADPH on the signal detected in the 740 nm-excited spectral range is neglected. Early reports have identified lower quantum yield of NADPH at a factor of 1.25 to 2.5 when compared to that of NADH.30 The concentration of reduced NADH in cells is fivetimes greater than that of NADPH. There is still NAD(P)H signal, which hardly can affect the fluorescence of interest.48 Complex analysis of a mixture of multiple fluorophores, featuring multiexponential decays overlapping each other both spectrally and in their lifetimes and spectral unmixing can become possible to help the situations. There is also some portion of the FAD spectrum covered with the filter used,49 but given that measured at the maximum of the spectra FAD signal was smaller than NAD(P)H, we believe that there is little-to-no influence on the NADH fluorescence lifetime values. Nevertheless, a reliable analysis of the NAD(P)H fluorescence in the early phase of infection could not be performed. The use of NADH autofluorescence is still needed to provide a clue to the mapping of metabolic changes during early apoptosis caused by infection. 4.SummaryFLIM performed on NADH and FAD is able to properly characterize both physiological and pathological states of live cells by mapping of cellular metabolic states. This technique is important to understand and reflect the correlation of NADH and FAD lifetime dynamics with the biological processes in cells and can be efficiently used to distinguish lifetime differences in normal and pathological specimens. The combination of fluorescence redox ratio and lifetime imaging at high resolution might potentially provide a tool for understanding the morphological and metabolic changes in cell culture. These observations help to unravel the early studies of apoptosis in case of bacterial infection and could be used as a guide for the time-gated and steady-state fluorescence methods for the clinical detection of diseases. Moreover, the changes in lifetime and relative intensities ratios of FAD as opposed to NADH at early apoptosis make the technique able to demonstrate the roles and functions of enzymes and co-factors in cells by means of fluorescence lifetime signatures. Two-photon FLIM also reveals new insights into the crosstalk between host and pathogen metabolism and suggests that pathogenic E. coli (EHEC) induced changes in subcellular NADH in such a way as to directly interfere with signaling pathways that are involved in cellular survival and longevity. Understanding how host cell metabolism reacts on extracellular pathogens and metabolic profiling of infected cells by FLIM of NADH will be an invaluable tool that complements established large-scale genomic and proteomic approaches. To make the study more clear and solid, more experiments should be done. To prove the possible apoptosis in infected cells, ATP level both in control and treated cells should be measured. Imaging of NADH in HeLa cells infected with lower and higher bacteria concentration is important also to reveal the real changes in metabolism caused by the infection of E. coli. Not only E. coli, but also other types of bacteria should be used to infect the cells prior the imaging of NADH lifetime in HeLacells to reflect the fact of changes during different infection time. Other cell lines could be also informative to reveal changes in metabolism by means of NADH lifetime perturbations by FLIM. AcknowledgmentsThis work is generously supported by the National Science Council under grants 98-2112-M-010-001-MY3, 97-2112-M-010-002-MY3, 99-2627-M-010-002, in part by the UST-UCSD International Center of Excellence in Advanced Bioengineering sponsored by Taiwan National Science Council I RiCE Program under grant NSC-100-2911-I-009-101 and a grant from Ministry of Education, Aim for the Top University Plan. ReferencesY. WuJ. Y. Qu,
“Combined depth- and time-resolved autofluorescence spectroscopy of epithelial tissue,”
Opt. Lett., 31
(12), 1833
–1835
(2006). http://dx.doi.org/10.1364/OL.31.001833 OPLEDP 0146-9592 Google Scholar
Y. Wuet al.,
“Depth-resolved fluorescence spectroscopy reveals layered structure of tissue,”
Opt. Express, 12
(14), 3218
–3223
(2004). http://dx.doi.org/10.1364/OPEX.12.003218 OPEXFF 1094-4087 Google Scholar
B. Albertset al., Molecular Biology of the Cell, 5th ed.Garland Science, New York
(2008). Google Scholar
M. LevineR. Edelman,
“Enteropathogenic Escherichia coli of classic serotypes associated with infant diarrhea: epidemiology and pathogenesis,”
Epidemiol. Rev., 6
(1), 31
–51
(1984). EPIDEY 1044-3983 Google Scholar
T. Ideet al.,
“Differential modulation by Ca2+ of Type III secretion of diffusely adhering enteropathogenic Escherichia coli,”
Infect. Immun., 71
(4), 1725
–1732
(2003). http://dx.doi.org/10.1128/IAI.71.4.1725-1732.2003 INFIBR 1070-6313 Google Scholar
T. K. McDanielJ. B. Kaper,
“A cloned pathogenicity island from enteropathogenic Escherichia coli confers the attaching and effacing phenotype on E. coli K-12,”
Mol. Microbiol., 23
(2), 399
–407
(1997). http://dx.doi.org/10.1046/j.1365-2958.1997.2311591.x MOMIEE 0950-382X Google Scholar
M. De Grado,
“Identification of the intimin-binding domain of Tir of enteropathogenic Escherichia coli,”
Cell. Microbiol., 1
(1), 7
–17
(1999). http://dx.doi.org/10.1046/j.1462-5822.1999.00001.x CEMIF5 1462-5814 Google Scholar
M. Abul-Milhet al.,
“Induction of epithelial cell death including apoptosis by enteropathogenic Escherichia coli expressing bundle-forming pili,”
Infect. Immun., 69
(12), 7356
–7364
(2001). http://dx.doi.org/10.1128/IAI.69.12.7356-7364.2001 INFIBR 1070-6313 Google Scholar
A. R. Wong,
“Enteropathogenic and enterohaemorrhagic Escherichia coli: even more subversive elements,”
Mol. Microbiol., 80
(6), 1420
–1438
(2011). http://dx.doi.org/10.1111/mmi.2011.80.issue-6 MOMIEE 0950-382X Google Scholar
J.-Ph. NougayredeM. S. Donnenberg,
“Enteropathogenic Escherichia coli EspF is targeted to mitochondria and is required to initiate the mitochondrial death pathway,”
Cell. Microbiol., 6
(12), 1097
–1111
(2004). http://dx.doi.org/10.1111/cmi.2004.6.issue-11 CEMIF5 1462-5814 Google Scholar
V. Viswanathanet al.,
“Enteropathogenic E. coli-induced barrier function alteration is not a consequence of host cell apoptosis,”
Ann. J. Physiol. Gastrointest. Liver Physiol., 294
(5), G1165
–G1170
(2008). ARPHAD 0066-4278 Google Scholar
P. Deanet al.,
“The enteropathogenic E. coli effector EspF targets and disrupts the nucleolus by a process regulated by mitochondrial dysfunction,”
PLOS Pathog., 6
(6), e1000961
(2010). http://dx.doi.org/10.1371/journal.ppat.1000961 1553-7374 Google Scholar
A. Holmeset al.,
“The EspF effector, a bacterial pathogen’s Swiss Army Knife,”
Infect. Immun., 78
(11), 4445
–4453
(2010). http://dx.doi.org/10.1128/IAI.00635-10 INFIBR 1070-6313 Google Scholar
C. Hemrajaniet al.,
“NleH effectors interact with Bax inhibitor-1 to block apoptosis during enteropathogenic Escherichia coli infection,”
PNAS, 107
(7), 3129
–3134
(2010). 0370-0046 Google Scholar
J. Craneet al.,
“Host cell death due to enteropathogenic Escherichia coli has features of apoptosis,”
Infect. Immun., 67
(5), 2575
–2584
(1999). INFIBR 1070-6313 Google Scholar
J. Craneet al.,
“Role of EspF in host cell death induced by enteropathogenic Escherichia coli,”
Cell. Microbiol., 3
(4), 197
–211
(2001). http://dx.doi.org/10.1046/j.1462-5822.2001.00103.x CEMIF5 1462-5814 Google Scholar
M. R. DuchenA. SurinJ. Jacobson,
“Imaging mitochondrial function in intact cells,”
Methods Enzymol., 361 353
–389
(2002). http://dx.doi.org/10.1016/S0076-6879(03)61019-0 MENZAU 0076-6879 Google Scholar
B. Chanceet al.,
“Oxidation-reduction ratio studies of mitochondria in freeze-trapped samples. NADH and flavoprotein fluorescence signals,”
J. Biol. Chem., 254
(11), 4764
–4771
(1979). JBCHA3 0021-9258 Google Scholar
J. R. Lakowicz, Principles of Fluorescence Spectroscopy, Plenum Press, New York
(1999). Google Scholar
K. Blinovaet al.,
“Distribution of mitochondrial NADH fluorescence lifetimes: steady-state kinetics of matrix NADH interactions,”
Biochemistry, 44
(7), 2585
–2594
(2005). http://dx.doi.org/10.1021/bi0485124 MIRBD9 0144-0578 Google Scholar
A. J. W. G. VisserA. V. Hoek,
“The fluorescence decay of reduced nicotinamides in aqueous solution after excitation with a UV-mode locked laser,”
J. Photochem. Photobiol., 33
(1), 35
–41
(1980). 1010-6030 Google Scholar
W. R. ZipfelR. M. WilliamsW. W. Webb,
“Nonlinear magic: multiphoton microscopy in the biosciences,”
Nat. Biotechnol., 21
(11), 1369
–1377
(2003). http://dx.doi.org/10.1038/nbt899 NABIF9 1087-0156 Google Scholar
A. GafniL. Brand,
“Fluorescence decay studies of reduced nicotinamide adenine dinucleotide in solution and bound to liver alcohol dehydrogenase,”
Biochemistry, 15
(15), 3165
–3171
(1976). http://dx.doi.org/10.1021/bi00660a001 MIRBD9 0144-0578 Google Scholar
M. WakitaG. NishimuraM. J. Tamura,
“Some characteristics of the fluorescence lifetime of reduced pyridine nucleotides in isolated mitochondria, isolated hepatocytes, and perfused rat liver in situ,”
J. Biochem., 118
(6), 1151
–1160
(1995). MIRBD9 0144-0578 Google Scholar
F. FrischknechtO. RenaudS. L. Shorte,
“Imaging today’s infectious animalcules,”
Curr. Opin. Microbiol., 9
(3), 297
–306
(2006). http://dx.doi.org/10.1016/j.mib.2006.04.007 COMIF7 1369-5274 Google Scholar
N. Nakashimaet al.,
“Picosecond fluorescence lifetime of the coenzyme of D-amino acid oxidase,”
J. Biol. Chem., 255
(11), 5261
–5263
(1980). JBCHA3 0021-9258 Google Scholar
P. A. W. Van den Berget al.,
“Dynamic conformations of flavin adenine dinucleotide: simulated molecular dynamics of the flavin cofactor related to the time-resolved fluorescence characteristics,”
J. Phys. Chem. B, 106
(34), 8858
–8869
(2002). http://dx.doi.org/10.1021/jp020356s JPCHAX 0022-3654 Google Scholar
D. Chorvat Jr.A. Chorvatova,
“Multi-wavelength fluorescence lifetime spectroscopy: a new approach to the study of endogenous fluorescence in living cells and tissues,”
Laser Phys. Lett., 6
(3), 175
–193
(2009). http://dx.doi.org/10.1002/lapl.v6:3 1612-2011 Google Scholar
M. C. Skalaet al.,
“In vivo multiphoton microscopy of NADH and FAD redox states, fluorescence lifetimes, and cellular morphology in precancerous epithelia,”
PNAS, 104
(49), 19494
–19499
(2007). http://dx.doi.org/10.1073/pnas.0708425104 0370-0046 Google Scholar
H. W. Wanget al.,
“Differentiation of apoptosis from necrosis by dynamic changes of reduced nicotinamide adenine dinucleotide fluorescence lifetime in live cells,”
J. Biomed. Opt., 13
(5), 054011
(2008). http://dx.doi.org/10.1117/1.2975831 JBOPFO 1083-3668 Google Scholar
V. GhukasyanF. J. Kao,
“Monitoring cellular metabolism with fluorescence lifetime of reduced nicotinamide adenine dinucleotide,”
J. Phys. Chem. C, 113
(27), 11532
–11540
(2009). JPCHAX 0022-3654 Google Scholar
T. Shimizuet al.,
“A role of reactive oxygen species in apoptotic activation of volume-sensitive Cl- channel,”
PNAS, 101
(17), 6770
–6773
(2004). http://dx.doi.org/10.1073/pnas.0401604101 0370-0046 Google Scholar
E. Maeno,
“Normotonic cell shrinkage because of disordered volume regulation is an early prerequisite to apoptosis,”
PNAS, 97
(17), 9487
–9492
(2000). http://dx.doi.org/10.1073/pnas.140216197 0370-0046 Google Scholar
V. Ghukasyanet al.,
“Application of fluorescence resonance energy transfer resolved by fluorescence lifetime imaging microscopy for the detection of enterovirus 71 infection in cells,”
J. Biomed. Opt., 12
(2), 024016
(2007). http://dx.doi.org/10.1117/1.2718582 JBOPFO 1083-3668 Google Scholar
I.-H. Chenet al.,
“Wavelength dependent damage in biological multi-photon confocal microscopy: a micro-spectroscopic comparison between femtosecond Ti:sapphire and Cr:forsterite laser sources,”
Opt. Quant. Electron., 34
(12), 1251
–1266
(2002). http://dx.doi.org/10.1023/A:1021303426482 OQELDI 0306-8919 Google Scholar
S. H. HuangA. A. HeikalW. W. Webb,
“Two-photon fluorescence spectroscopy and microscopy of NAD(P)H and flavoprotein,”
Biophys. J., 82
(5), 2811
–2825
(2002). http://dx.doi.org/10.1016/S0006-3495(02)75621-X BIOJAU 0006-3495 Google Scholar
W. Becker, Advanced Time-Correlated Single Photon Counting Techniques, Springer, Berlin, Heidelberg, New York
(2005). Google Scholar
V. Ghukasyanet al.,
“Fluorescence lifetime dynamics of enhanced green fluorescent protein in protein aggregates with expanded polyglutamine,”
J. Biomed. Opt., 15
(2), 016008
(2010). http://dx.doi.org/10.1117/1.3290821 JBOPFO 1083-3668 Google Scholar
J. Treeet al.,
“Controlling injection: regulation of type III secretion in enterohaemorrhagic Escherichia coli,”
Trends Microbiol., 17
(8), 361
–370
(2009). http://dx.doi.org/10.1016/j.tim.2009.06.001 TRMIEA 0966-842X Google Scholar
Q. YuA. Heikal,
“Two-photon autofluorescence dynamics imaging reveals sensitivity of intracellular NADH concentration and conformation to cell physiology at the single-cell level,”
J. Photochem. Photobiol. B, 95
(1), 46
–57
(2009). 1010-6030 Google Scholar
N. PollakC. DolleM. Zeigler,
“The power to reduce: pyridine nucleotides—small molecules with a multitude of functions,”
Biochem. J., 402 205
–218
(2007). http://dx.doi.org/10.1042/BJ20061638 BIJOAK 0264-6021 Google Scholar
J. J. Lemasters,
“Modulation of mitochondrial membrane permeability in pathogenesis, autophagy and control of metabolism,”
J. Gastroenterol. Hepatol., 22
(s1), S31
–S37
(2007). http://dx.doi.org/10.1111/jgh.2007.22.issue-s1 JGHEEO 1440-1746 Google Scholar
E. F. Mason,
“Cell metabolism: an essential link between cell growth and apoptosis,”
Biochim. Biophys. Acta, 1813
(4), 645
–654
(2011). http://dx.doi.org/10.1016/j.bbamcr.2010.08.011 BBACAQ 0006-3002 Google Scholar
M. Szaszaket al.,
“Fluorescence lifetime imaging unravels C. trachomatis metabolism and its crosstalk with the host cell,”
PLoS Pathogens, 7
(7), e1002108
(2011). Google Scholar
D. Liet al.,
“Time-resolved spectroscopic imaging reveals the fundamentals of cellular NADH fluorescence,”
Opt. Lett., 33
(20), 2365
–2367
(2008). http://dx.doi.org/10.1364/OL.33.002365 OPLEDP 0146-9592 Google Scholar
T. Buryakinaet al.,
“Monitoring cellular metabolism of 3T3 upon wild type E. coli infection by mapping NADH with FLIM,”
Chin. Opt. Lett., 8
(10), 931
–933
(2010). http://dx.doi.org/10.3788/COL COLHBT 1671-7694 Google Scholar
H. Schneckenburgeret al.,
“Autofluorescence lifetime imaging of cultivated cells using a UV picosecond laser diode,”
J. Fluoresc., 14
(5), 649
–654
(2004). JOFLEN 1053-0509 Google Scholar
A. S. LadokhinL. Brand,
“Evidence for an excited-state reaction contributing to NADH fluorescence,”
J. Fluoresc., 5
(1), 99
–106
(1995). JOFLEN 1053-0509 Google Scholar
D. Schweitzer,
“Quantifying fundus autofluorescence,”
Fundus Autofluorescence, 78
–95 Lippincott Williams &Wilkins, Philadelphia
(2009). Google Scholar
|
|||||||||||||||||||||||||||||||||||


