|
|
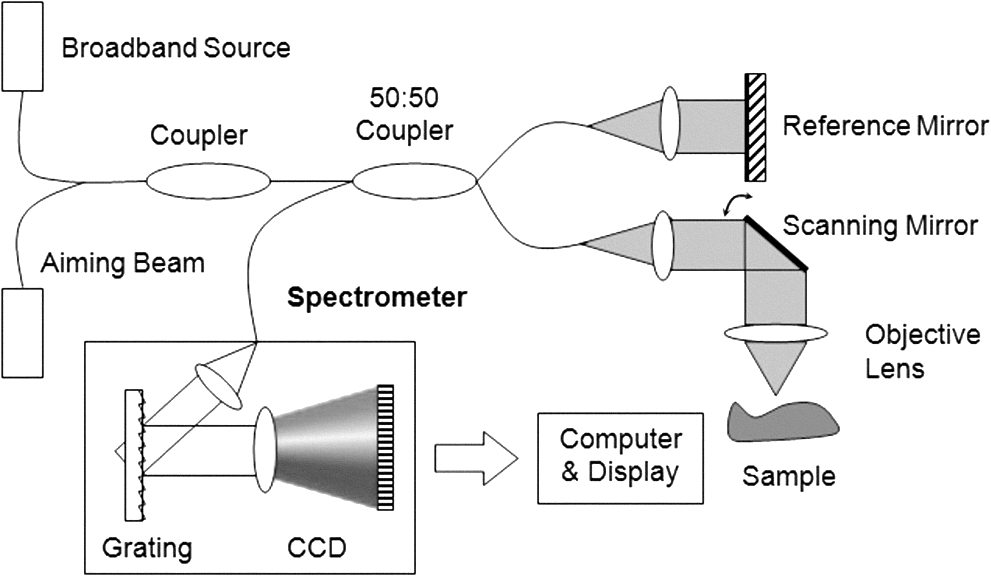
1.IntroductionThe World Health Organization estimates that more than 346 million people worldwide have diabetes. Without intervention, this number is likely to more than double by 2030. Almost 80% of diabetes deaths occur in low- and middle-income countries.1 Diabetes has become a major public health problem in China, where there are 92.4 million adults with diabetes (the most in the world) and 148.2 million adults with prediabetes.2 Diabetes and its complications (including heart disease, stroke, hypertension, blindness, kidney disease, and nervous system disease) killed more than 231,000 Americans in 2007. In the United States, 25.8 million children and adults (8.3% of the population) have diabetes. Worse still, as obesity rates in children continue to soar, this disease is becoming more common in young people, whereas it used to be seen primarily in adults over age 45.3 These facts indicate that strategies aimed at the prevention and treatment of diabetes are needed. Tight monitoring and control of blood glucose in diabetic patients would significantly reduce complications and mortality caused by this disease. Therefore, monitoring of glycemic status in patients with diabetes is considered a cornerstone of their care. Results from monitoring are of great value to achieve the best possible glucose control.4,5 Currently, control of this disease involves daily self-monitoring of blood glucose (SMBG) by finger puncture several times a day to obtain a blood sample for further chemical analysis. This procedure is invasive, painful, and unpleasant for patients. Even though SMBG has revolutionized the management of diabetes, these defects may limit its frequent application and result in poor management of the disease. Therefore, there is a vital need for development of a noninvasive blood glucose monitoring technique that would provide continuous, painless glucose monitoring and much greater insight into glucose levels throughout the day so as to promote the quality of life for diabetic patients and reduce complications and mortality associated with this disease.4–6 In the past three decades, several scientific groups and companies have tried to develop a continuous noninvasive device for blood glucose concentration measurements. At present, two types of noninvasive glucose measuring techniques are under development: optical and transdermal. Most of the noninvasive methods use optical signals by detecting the physical properties of light in biological tissues. These approaches include polarimetry, near-infrared (NIR) spectroscopy, Raman spectroscopy, photoascoustics, and optical coherence tomography (OCT).7–9 Polarimetry measures the optical rotary dispersal of polarized light. The concentration of the solution can be obtained by calculations based on the polarimetric results. This method is implemented across the anterior chamber of the eye. One obstacle to this is that the cornea causes some intrinsic rotation. In addition, it is uncomfortable and inconvenient for patients to measure glucose concentration across the eye.10,11 Blood glucose concentration has been measured across the oral mucosa12 and the tongue13 using NIR spectroscopy. The NIR spectroscopy technique uses absorption spectrum dependent on molecular structure. However, the NIR spectroscopy is influenced by many tissue components, including water, fat, protein, and glucose, as well as temperature. Thus, the SNR is depressed.14,15 Raman spectroscopy has been implemented to measure glucose transcutaneously and in human aqueous humor. The results sound good, but in vivo, biological tissue is at the risk for damage from the powerful laser of the Raman system.16 What’s more, the Raman signal is weaker than with other technologies. Surface enhancement Raman spectroscopy (SERS) has the advantage of greatly enhancing the signal strength. But this technique requires metal nanoparticles to be implanted, which is hardly to be realized.8,16,17 Photoacoustic spectroscopy uses the principle that absorption of light causes ultrasonic waves. The photoacoustic process involves the conversion of optical energy into acoustic energy by a multistage energy conversion process. The complicated nature of both the photoacoustic generation process and the structure and composition of human tissue can be impediments to this method.18 OCT is a relatively new imaging technique that provides images of tissues with high resolution of about 10 µm or less. It was first introduced in 1991 to perform tomographic imaging of the human eye.19 Subsequently, this technique was actively developed by several research groups for many diagnostic applications and medical imaging.20–29 It has been proposed for blood glucose monitoring as well and was tested in vivo and in vitro. It has been shown that OCT is capable of detecting changes of blood glucose concentration in the normal physiology range.29–34 OCT allows measurement of light attenuation in biological tissues, using an interferometer with a low coherent light source. It operates with ballistic and near-ballistic photons. 2-D OCT images are obtained by collecting the back-reflected light from the subject.35,36 Backscattered light from the object is detected and integrated to assemble an image. According to the Beer–Lambert law, light attenuation inside tissues is exponential. By analyzing the exponential slope of the light attenuation in specific layers of tissue, one can calculate the attenuation coefficient of ballistic photons. The slope of this exponential attenuation is proportional to the total attenuation coefficient of ballistic photons (, where is total attenuation, is scattering, and is the absorption coefficient). The scattering coefficient in the NIR spectral range is substantially greater than the absorption coefficient in most biological tissues, including skin. Thus, the slope of light attenuation is proportional to the tissue-scattering coefficient.37 The variations of the blood glucose concentration (BGC) can induce changes in the tissue-scattering coefficient of a specific layer in the biological tissues. Therefore, BGC can be measured by analyzing the glucose-induced changes in the OCT signal slope detected from the biological tissues, such as the dermis area of the skin.38 The skin consists of three major layers: stratum corneum (SC), epidermis, and connective tissue of dermis, which is the only layer containing a developed blood microvessel network. The OCT technique allows measurement of glucose-induced changes in the skin-scattering coefficient directly from the dermis. However, one limitation to the application of light-based diagnostic imaging is the skin surface, which prevents light access to deeper targets. One method to enhance light penetration into skin and control the optical properties of tissues is the use of optical clearing by means of immersion technology. Several optical clearing agents (OCAs) with different refractive indices have been used to decrease scattering, enhance light penetration depth, and increase image contrast.39–44 When monitoring blood glucose with OCT across the skin, proper application of OCAs would increase the effective light dose penetrating through the SC and the epidermis; i.e., more light reaches the targeted area of the tissue. The purpose of this study is an experimental examination of how optical clearing affects the results of noninvasive blood glucose monitoring with OCT. To facilitate, this we used four kinds of OCAs made of two kinds of agents in the trial, which were applied in vivo through human skin tissues. The experimental results clearly show the significant improvement in the accuracy of blood glucose measurement with OCT when OCAs are properly applied. 2.Materials and Methods2.1.OCT SystemIn this work, we used a portable spectral domain OCT system with a central wavelength of 840 nm, a bandwidth of 80 nm, and longitudinal and transverse resolution of 7.8 and 30 μm, respectively. It is made by Shenzhen MOPTIM Imaging Technique Co., Ltd., China. Figure 1 shows the diagram of the OCT system used in this study, and a photograph of the experimental setup is shown in Fig. 2. Lateral and longitudinal scanning are at 3 and 1.8 mm, respectively. Single lateral scans can be accomplished in ; in other words, we can obtain 15 images every second. The OCT system operation is controlled automatically by a portable personal computer (PC), and a 2-D OCT image is selected every half minute. Altogether, there are more than 300 2-D OCT images obtained in each experiment and stored in the PC for further processing.24 2.2.MaterialsThe measurements were carried out on 12 volunteers (7 men and 5 women) aged 22 years or older (mean age 28 years). They were in good health, took no medication, and were selected from the same racial groups randomly. A signed informed consent was obtained from all subjects. The in vivo window preparation had a 1-cm diameter circle in the skin of dorsal forearms, and OCT images were taken. Before each individual experiment, the detected area would be shaved to eliminate influences to the experimental results by the fine hair on the arm.34 During the measurements, the volunteers were asked to remain still to minimize motion artifacts, and food and drinks were not permitted. Three subjects were excluded from the study because they were not able to complete the experiments. A standard oral glucose tolerance test (OGTT) using 75 g glucose was performed in all volunteers starting at 0900 (time 0) after an overnight fast. At the same time, OCA was applied to the surface of the skin (approximately 0.1 mL) of the volunteers’ forearms where the OCT images were taken. Synchronously, BGC was monitored serially at about 10-min intervals using one touch ultra easy glucose analyzers. Whole-blood samples were drawn from the subjects’ fingertips.31,33 The duration of each individual experiment was about 160 min. Before being treated with the OCAs, the detected regions of subjects were measured for about 10 min to establish a baseline. Continuous monitoring of tissue optical properties upon application of different OCAs was performed for up to 150 min. The room temperature was maintained at 25°C throughout the experiment, so as to eliminate influences caused by temperature fluctuation.32,45 Four kinds of OCA were used in this study: glycerol (100% G), glycerol (50% G), mannitol (16% M), and mannitol (10% M) solutions. The glycerol solution was prepared through mixing the agents with distilled water, and mannitol solutions were prepared by dissolving 16 or 10 g of mannitol in 100 mL purified and distilled water. Mannitol and glycerol (with 99.9% concentration) were purchased from Tianjhi Damao Chemical Reagent Factory, China. 2.3.MethodsIn this study, OCT images obtained from human skin were processed using an original program developed in Microsoft Visual C++ 6.0 to obtain the OCT signal and calculate the OCT signal slope (OCTSS)45 Over approximately 1 mm, which is sufficient for speckle noise suppression, the 2-D images were averaged in the lateral ( axis) direction into a single curve to obtain an OCT signal that represents 1-D distribution of light in depth.26 To reduce the effect of surface curvature, the most flat regions of the 2-D images were used for averaging.45 The 1-D distribution was plotted in logarithmic scale as a function of depth for further analysis. The local increase of glucose concentration in the chosen region caused the scattering coefficient to decrease, which was clearly reflected in the OCTSS graph. The average effects of OCAs on glucose monitoring by OCT were estimated by analyzing correlation between the OCTSS changes and the actual blood glucose concentration. The correlation coefficients () and values were calculated. The OCTSS was calculated by linear least-squares fit of a segment with the length of 75 to 125 µm, where the signal is linear and undergoes minimal alterations. This segment lies in the 400- to 650-µm depth range. This analytical method is shown in Fig. 3. The OCT signal slopes were plotted in the inverse scale, and then slopes of four consecutive OCT signals were averaged, normalized, and plotted as a function of time or of actual blood glucose concentration.30 Fig. 3OCT signals recorded from the human skin in vivo at different times, indicating OCTSS analysis method. 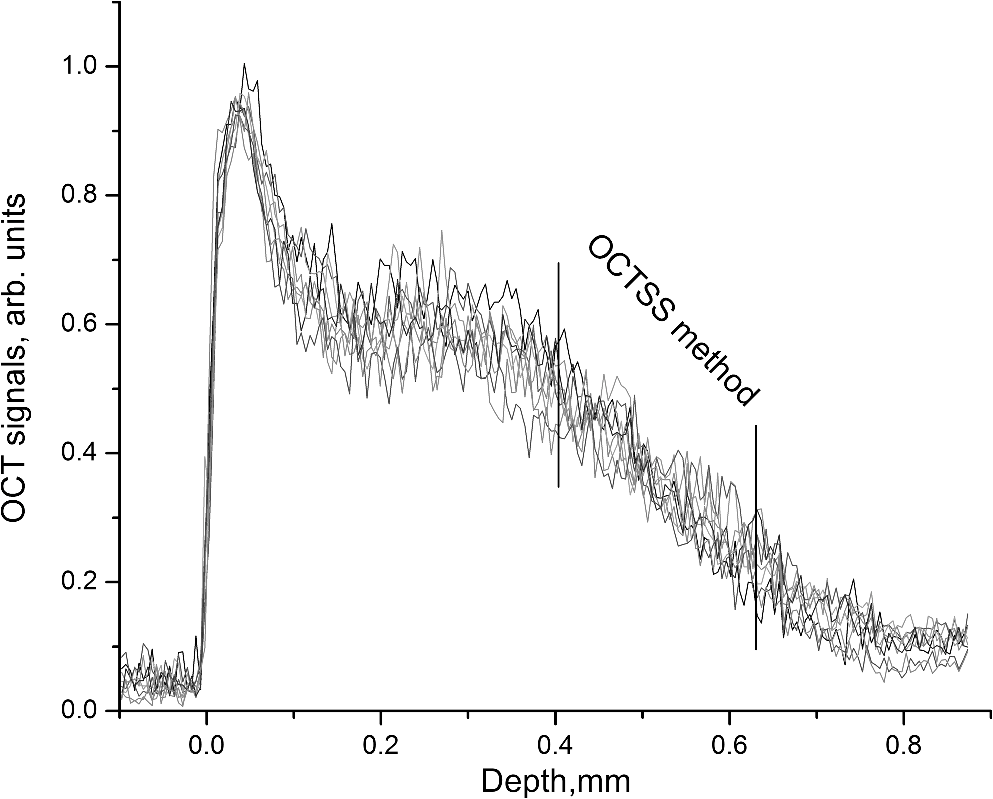 The reason we decided to monitor BGC in the forearm is for convenience. The epidermis of the forearm appears to be much thinner than that of the hand, finger, or wrist.46 During rapid blood glucose changes, however, forearm blood glucose lags behind fingertip blood glucose by 30 min on average. As a result, there is a lag time () between glucose-induced changes in skin optical properties and variations in BGC.47–49 We varied to find the maximal absolute value of to determine the value of .50 Values of varied from 10 to 50 min with an interval of 1 min, and the value of could be calculated according to each . When reached its maximum value, the lag time of the test was determined. 3.Results and Discussion3.1.Correlation between OCTSS and BGCThe experiments in which sharp blood glucose changes were realized by glucose uptake can be divided into five groups: group A was a control group (no OCA was used), group B used 50% G, group C used 10% M, group D used 100% G, and group E used 16% M. Every volunteer who completed the experiments took part in all five tests (nine people tested in each group). In group A, good correlations were found between the values of blood glucose and the OCTSS, which is in agreement with Larin’s findings in 2002.30 In the results of group A, when OCTSS is calculated in the depth region from the skin surface, (correlation coefficient between the OCTSS and the BGC) varied between 0.81 and 0.87, and the average value was 0.848; no calculated value was higher than 5%, and most of the values were . One representative result is shown in Fig. 4. Fig. 4(a) OCTSS (plotted in the inverted scale) and corresponding BGCs for one of the experiments of group A; no OCA was used in this group. (b) OCTSS versus BGC for the data shown in (a); , . The slope was calculated at a depth region of 430–510 µm. 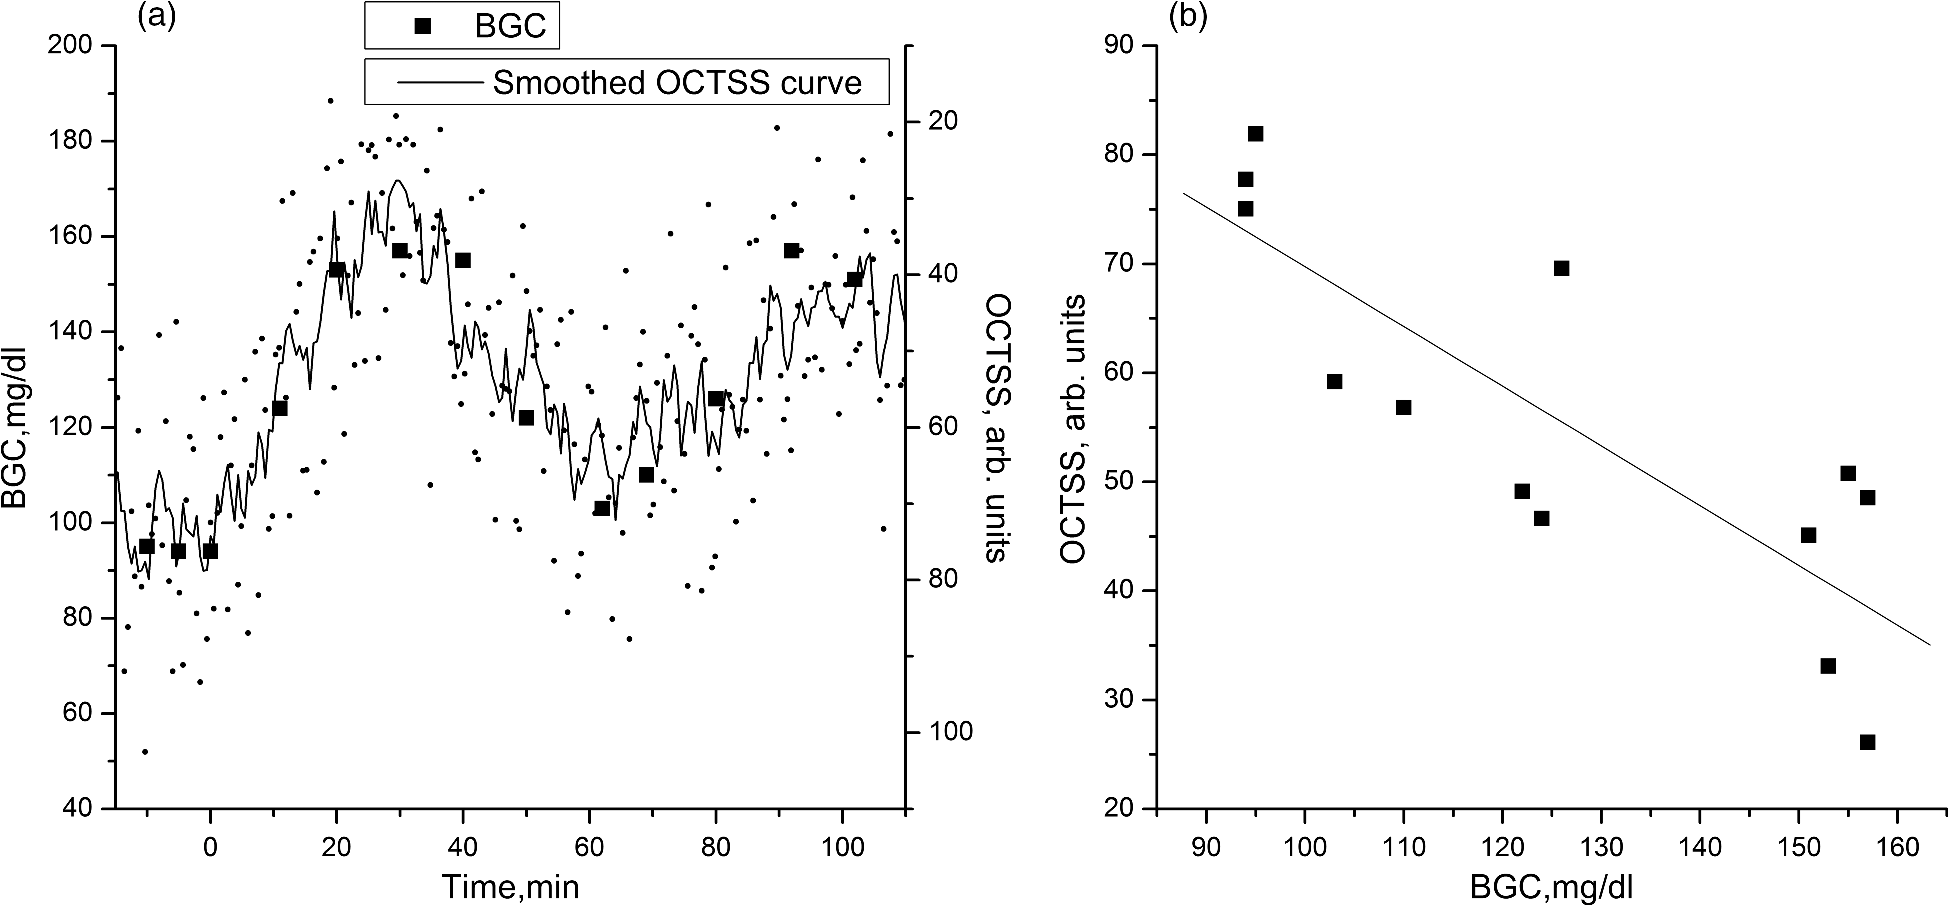 Figures 4 and 5, which are derived from the same individual, indicate that with the increase of BGC, the OCTSS decreases. In human skin, the scattering of light depends on the ratio of the refractive indices of the components. Changes in the ratio of the refractive indices of the scattering particles and the solute lead to a variation in the transparency of the tissue. An increase in BGC leads to a subsequent rise in the refractive indices of blood and interstitial fluid, whereas the refractive index of scattering particles in the skin remains unchanged.51,52 Thus, the refractive index mismatch between the solute and the particles diminishes and the scattering is decreased, which was clearly reflected in the OCT signal slopes. Fig. 5OCTSS versus BGC for one of the experiments of group B; 50% glycerol was used in this group; , . The slopes were calculated at a depth region of 560–650 µm.  Figures 4 and 5 indicate that when the OCTSS is calculated at a depth region of 560 to 650 µm, the correlation between the OCTSS and the BGC is better than that of the region of 430 to 510 µm. Most likely, this phenomenon is caused by the gradient of glucose concentration from dermal blood microvessels to the epidermis. Therefore, sensitivity and accuracy of the OCT measurements of BGC would be maximal in the lower dermis area.30 This was also demonstrated in the results of groups B and C. In this study, low-concentration OCAs performed better than high-concentration ones. In groups B and C, both the sensitivity and accuracy of the measurements were improved significantly. The results of group B were the best ones: when OCTSS was calculated in the region, ranged between 0.88 and 0.94, average value 0.908; no calculated value was higher than 1%. One representative result is shown in Fig. 5. OCAs, such as glycerol, have been identified that can change the light-scattering properties of turbid biological tissues. The strong affinity of OCAs produces a water flux out of tissue and leads to dehydration in the tissue. There is a difference in the biomembrane (mainly cell membrance) penetrability between water and glycerol. These factors are the main reasons for optical clearing. In addition, the interaction between collagen and OCAs can also lead to a substantial reduction in tissue light scattering.51–53 Thus, there would be more effective light dose penetrating through the SC and the epidermis into the lower dermis area, where blood in the skin tissue is much more abundant. The probing depth of OCT was increased when the glycerol optical clearing agent was applied topically on the skin.40 Mannitol is also a hyperosmotic agent with molecular weight similar to that of glucose. However, the influence of mannitol on biological tissues has been little studied except in the dura mater.43 In our study, 10% mannitol did not perform as well as 50% glycerol. In group C, varied between 0.85 and 0.93, average value 0.892 (no calculated value was higher than 1%). For comparison, the results for groups A, B, and C are shown in Table 1. Table 1Correlation coefficient between OCTSS and BGC for groups A, B, and C.
In groups D and E, we could hardly see any result better than in group A, most likely because diluted OCAs more easily diffuse into biological tissue. We did not continue investigating the optical clearing effects of these two kinds of high-concentration agents in our trials. 3.2.No Glucose UptakeTo see the effects of OCAs only, three additional groups of experiments were proposed in which there is no glucose uptake. No OCA was used in group A1, 50% G was used in group B1, and 10% M was used in group C1. In these groups, no good correlation was found between the values of blood glucose and the OCTSS, and no value of was . Figure 6 gives two representative result of groups A1 and B1. More details about the results are shown in Table 2. Fig. 6(a), OCTSS (plotted in the inverted scale) and corresponding BGCs for one of the experiments of group A1; , . The slope was calculated at a depth region of 450–540 µm. (b), OCTSS (plotted in the inverted scale) and corresponding BGCs for one of the experiments of group B1; , . The slope was calculated at a depth region of 500–600 µm. 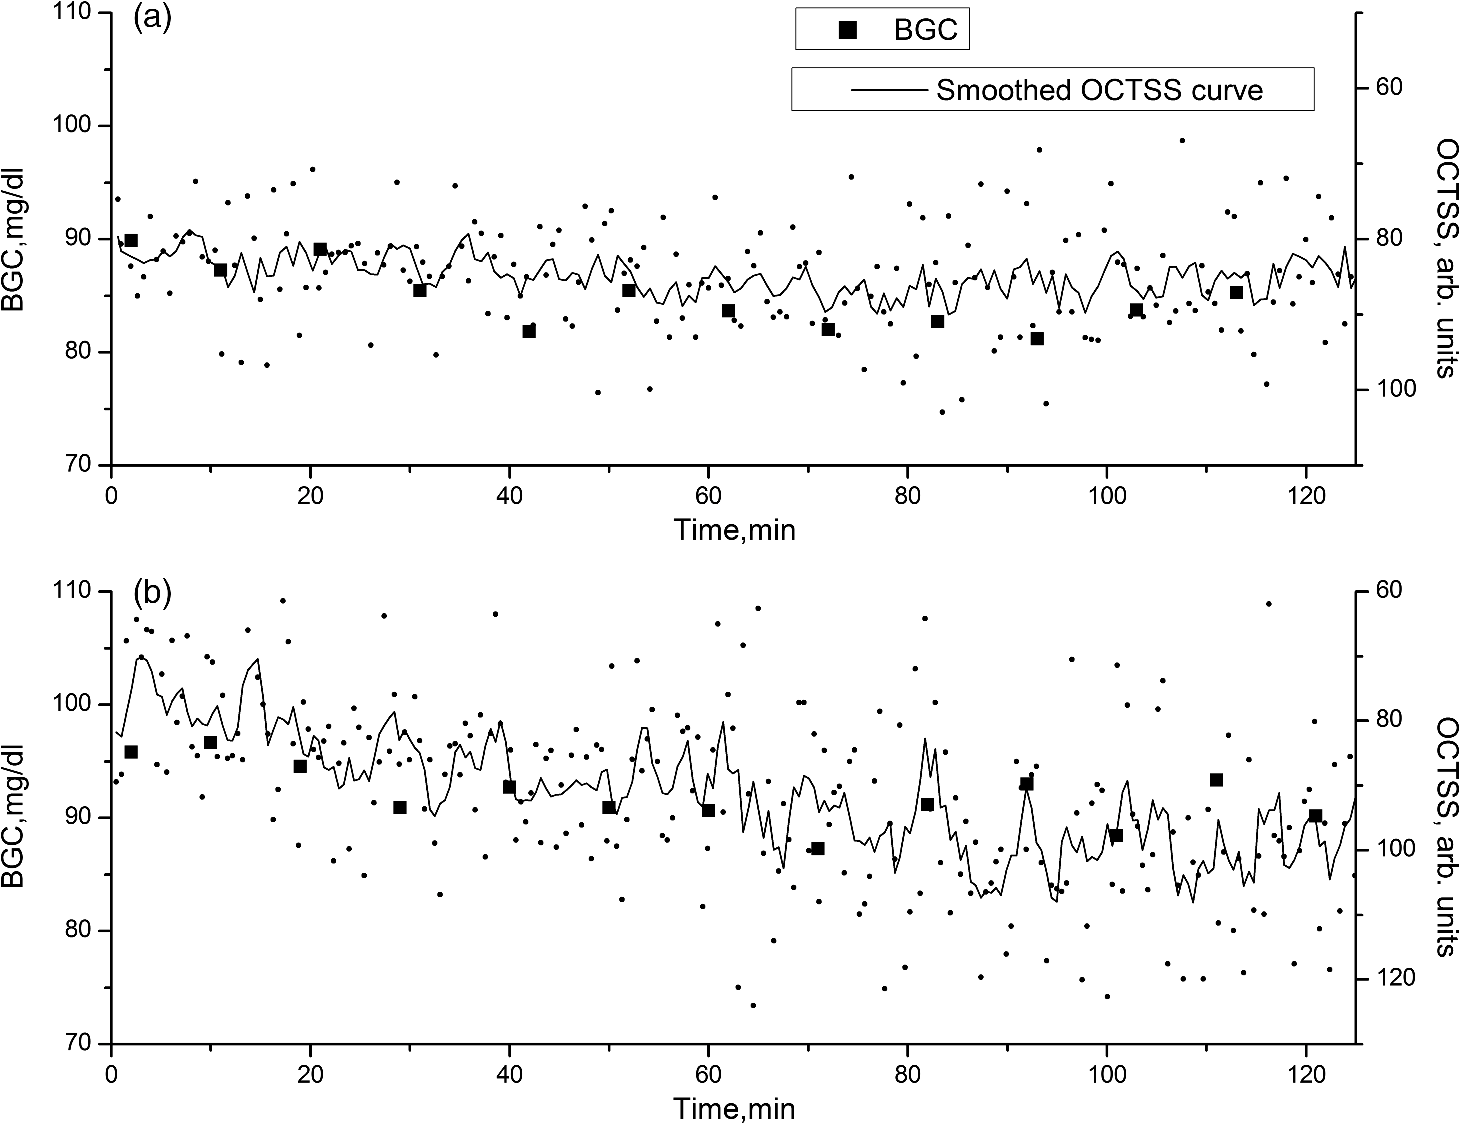 Table 2Correlation coefficient between OCTSS and BGC for groups in which there is no glucose uptake.
The main reason we did not find good correlation may be that when BGC is low and undergoes tiny fluctuations, it leads to little rise in the refractive indices of blood and interstitial fluid, and the refractive index mismatch inside the tissue does not change much. Thus, there is a less effect on the OCT signal. 3.3.Lag Time between OCTSS and BGCIn this study, the OCT signals presenting the optical properties of the skin tissues were obtained from dorsal forearms, and the glucose values were measured by fingerprick. The glucose levels in interstitial fluid determined the optical properties of the skin tissues, while the BGC values in fingertips closely followed arterial BGC. However, changes of glucose levels in interstitial fluid do not occur at the same time as those in the intravasal compartment; actually they occur with a delay. During rapid blood glucose changes, the forearm lags behind the fingertip by about 30 min on average. As a result, the detection of hyperglycemia as well as hypoglycemia could be delayed. This physiological delay is dangerous.48,49 The maximum and minimum values of (the lag time between the OCTSS and the BGC) in our experiments were 15 and 46 min, respectively; the mean value was 33 min. When compared with group A, however, the in group B was 8 min shorter on average, and 5 min shorter in group C. This is mainly because the OCT signal slopes in groups B and C were calculated in the lower dermis region where the glucose level in interstitial fluid more closely follows that in veins. 4.ConclusionsThe results of our studies performed on healthy volunteers showed that there is a good correlation between changes in the OCTSS and actual blood glucose concentration in normal subjects during an OGTT, which is in agreement with previous studies. In addition, if the detected area of the human skin is properly treated with OCAs, the correlation would be improved significantly. To discuss the effects of skin optical clearing in this trial, comparisons were performed between different groups of experiments. Among the four kinds of OCAs we used in the experiments, glycerol solute is the best enhancer of noninvasive blood glucose monitoring using OCT. When 50% glycerol is applied onto the human skin topically, the correlation coefficient between the OCTSS and BGC is improved by 7.1% on average, the values become much smaller, and the lag time between changes in the OCTSS and BGC is cut short by 8 min on average. OCAs increase the transparency of superficial skin tissues and detecting light permeates deeper into the skin. Thus, the depth of imaging is significantly improved. Without OGTT, we could hardly find good correlation between the OCTSS and BGC. In the groups where there was no glucose uptake, the BGC kept to low levels and underwent tiny fluctuations, making less impact on the OCT signal. During the measurements, the room temperature was maintained at 25°C. As normal temperature fluctuations of the skin () do not change the OCT signal slope,27 fluctuation of data points obtained in our experiments are mostly caused by motion artifacts and tissue inheterogeneity. Our further studies will focus on finding out the detailed mechanism of the results of this study and more effective methods improving the accuracy and sensitivity of noninvasive blood glucose monitoring, especially when the BGC are at a low level or undergo tiny fluctuations. AcknowledgmentsThis research is supported by the National Natural Science Foundation of China (60678050). References, “Health topics: diabetes: world diabetes day,”
(2012) http://www.who.int/mediacentre/events/annual/world_diabetes_day/en/index.html Google Scholar
W. Yanget al.,
“Prevalence of diabetes among men and women in China,”
N. Engl. J. Med., 362 1090
–1101
(2010). http://dx.doi.org/10.1056/NEJMoa0908292 NEJMAG 0028-4793 Google Scholar
, “Data from the 2011 National Diabetes Fact Sheet (released Jan. 26, 2011),”
(2011) http://www.diabetes.org/diabetes-basics/diabetes-statistics December ). 2011). Google Scholar
D. C. Klonoff,
“Continuous glucose monitoring: roadmap for 21st century diabetes therapy,”
Diabetes Care, 28
(5), 1231
–1239
(2005). http://dx.doi.org/10.2337/diacare.28.5.1231 DICAD2 0149-5992 Google Scholar
D. E. Glodsteinet al.,
“Tests of glycemia in diabetes,”
Diabetes Care, 27
(7), 1761
–1773
(2004). http://dx.doi.org/10.2337/diacare.27.7.1761 DICAD2 0149-5992 Google Scholar
M. Franciosiet al.,
“The impact of blood glucose self-monitoring on metabolic control and quality of life in type 2 diabetic: an urgent need for better educational strategies,”
Diabetes Care, 24
(11), 1870
–1877
(2001). http://dx.doi.org/10.2337/diacare.24.11.1870 DICAD2 0149-5992 Google Scholar
E.-H. YooS.-Y. Lee,
“Glucose biosensors: an overview of use in clinical practice,”
Sensors, 10
(5), 4558
–4576
(2010). http://dx.doi.org/10.3390/s100504558 SNSRES 0746-9462 Google Scholar
N. S. Oliveret al.,
“Glucose sensors: a review of current and emerging technology,”
Diabet. Med., 26
(3), 197
–210
(2009). http://dx.doi.org/10.1111/dme.2009.26.issue-3 DIMEEV 1464-5491 Google Scholar
L. L. SamuelsonD. A. Gerber,
“Recent developments in less invasive technology to monitor blood glucose levels in patients with diabetes,”
Lab Med., 40
(10), 607
–610
(2009). SCIEAS 0036-8075 Google Scholar
B. D. Cameronet al.,
“The use of polarized laser light through the eye for noninvasive glucose monitoring,”
Diabetes Technol. Ther., 1
(2), 135
–143
(1999). http://dx.doi.org/10.1089/152091599317341 DTTHFH 1520-9156 Google Scholar
B. D. CameronH. Anumula,
“Development of a real-time corneal birefringence compensated glucose sensing polarimeter,”
Diabetes Technol. Ther., 8
(2), 156
–164
(2006). http://dx.doi.org/10.1089/dia.2006.8.156 DTTHFH 1520-9156 Google Scholar
K. Kajiwaraet al.,
“Non-invasive measurement of blood glucose concentrations by analysing Fourier transform infra-red absorbance spectra through oral mucosa,”
Med. Biol. Eng. Comput., 31
(1), S17
–S22
(1993). http://dx.doi.org/10.1007/BF02446645 MBECDY 0140-0118 Google Scholar
J. J. BurmeisterM. A. ArnoldG. W. Small,
“Noninvasive blood glucose measurements by near-infrared transmission spectroscopy across human tongues,”
Diabetes Technol. Ther., 2
(1), 5
–16
(2000). http://dx.doi.org/10.1089/152091500316683 DTTHFH 1520-9156 Google Scholar
S. F. Malinet al.,
“Noninvasive prediction of glucose by near-infrared diffuse reflectance spectroscopy,”
Clin. Chem., 45
(9), 1651
–1658
(1999). CLCHAU 0009-9147 Google Scholar
J. J. BurmeisterM. A. Arnold,
“Evaluation of measurement sites for noninvasive blood glucose sensing with near-infrared transmission spectroscopy,”
Clin. Chem., 45
(9), 1621
–1627
(1999). CLCHAU 0009-9147 Google Scholar
J. L. LambertC. C. PelletierM. Borchert,
“Glucose determination in human aqueous humor with Raman spectroscopy,”
J. Biomed. Opt., 10
(3), 031110
(2005). http://dx.doi.org/10.1117/1.1914843 JBOPFO 1083-3668 Google Scholar
A. M. K. Enejderet al.,
“Raman spectroscopy for noninvasive glucose measurements,”
J. Biomed. Opt., 10
(3), 031114
(2005). http://dx.doi.org/10.1117/1.1920212 JBOPFO 1083-3668 Google Scholar
H. A. MacKenzieet al.,
“Advances in photoacoustic noninvasive glucose testing,”
Clin. Chem., 45
(9), 1587
–1595
(1999). CLCHAU 0009-9147 Google Scholar
D. Huanget al.,
“Optical coherence tomography,”
Science, 254 1178
–1181
(1991). http://dx.doi.org/10.1126/science.1957169 SCIEAS 0036-8075 Google Scholar
Z. Zhuet al.,
“Investigation of the permeability and optical clearing ability of different analytes in human normal and cancerous breast tissues by spectral domain OCT,”
http://dx.doi.org/10.1002/jbio.201100106 Google Scholar
M. G. GhosnV. V. TuchinK. V. Larin,
“Nondestructive quantification of analyte diffusion in cornea and sclera using optical coherence tomography,”
Invest. Ophth. Vis. Sci., 48
(6), 2726
–2733
(2007). http://dx.doi.org/10.1167/iovs.06-1331 IOVSDA 0146-0404 Google Scholar
I. V. MeglinskiC. BuranachaiL. A. Terry,
“Plant photonics: application of optical coherence tomography to monitor defects and rots in onion,”
Laser Phys. Lett., 7
(4), 307
–310
(2010). http://dx.doi.org/10.1002/lapl.v7:4 1612-2011 Google Scholar
X. XuL. YuZ. Chen,
“Effect of erythrocyte aggregation on hematocrit measurement using spectral-domain optical coherence tomography,”
IEEE Trans. Biomed. Eng., 55
(12), 2753
–2758
(2008). http://dx.doi.org/10.1109/TBME.2008.2002134 IEBEAX 0018-9294 Google Scholar
Q. L. Zhaoet al.,
“Quantifying glucose permeability and enhanced light penetration in ex vivo human normal and cancerous esophagus tissues with optical coherence tomography,”
Laser Phys. Lett., 8
(1), 71
–77
(2011). http://dx.doi.org/10.1002/lapl.v8.1 1612-2011 Google Scholar
H. Q. Zhonget al.,
“Quantification of glycerol diffusion in human normal and cancer breast tissues in vitro with optical coherence tomography,”
Laser Phys. Lett., 7
(4), 315
–320
(2010). http://dx.doi.org/10.1002/lapl.v7:4 1612-2011 Google Scholar
V. V. TuchinX. XuR. K. Wang,
“Dynamic optical coherence tomography in studies of optical clearing, sedimentation, and aggregation of immersed blood,”
Appl. Opt., 41
(1), 258
–271
(2002). http://dx.doi.org/10.1364/AO.41.000258 APOPAI 0003-6935 Google Scholar
Y. HeR. K. Wang,
“Dynamic optical clearing effect of tissue impregnated with hyperosmotic agents and studied with optical coherence tomography,”
J. Biomed. Opt., 9
(1), 200
–206
(2004). http://dx.doi.org/10.1117/1.1629682 JBOPFO 1083-3668 Google Scholar
K. V. Larinet al.,
“Quantification of glucose diffusion in arterial tissues by using optical coherence tomography,”
Laser Phys. Lett., 4
(4), 312
–317
(2007). http://dx.doi.org/10.1002/(ISSN)1612-202X 1612-2011 Google Scholar
R. O. EsenalievK. V. LarinI. V. Larina,
“Noninvasive monitoring of glucose concentration with optical coherence tomography,”
Opt. Lett., 26
(13), 992
–994
(2001). http://dx.doi.org/10.1364/OL.26.000992 OPLEDP 0146-9592 Google Scholar
K. V. Larin,
“Noninvasive blood glucose monitoring with optical coherence tomography: a pilot study in human subjects,”
Diabetes Care, 25
(12), 2263
–2267
(2002). http://dx.doi.org/10.2337/diacare.25.12.2263 DICAD2 0149-5992 Google Scholar
K. V. Larinet al.,
“Monitoring of tissue optical properties using OCT: application for blood glucose analysis,”
Proc. SPIE, 4707 181
–188
(2002). http://dx.doi.org/10.1117/12.475628 PSISDG 0277-786X Google Scholar
K. V. Larin,
“Specificity of noninvasive blood glucose sensing using optical coherence tomography technique: a pilot study,”
Phys. Med. Biol., 48
(10), 1371
–1390
(2003). http://dx.doi.org/10.1088/0031-9155/48/10/310 PHMBA7 0031-9155 Google Scholar
K. V. Larinet al.,
“Optical coherence tomography and noninvasive blood glucose monitoring: a review,”
Proc. SPIE, 5474 285
–290
(2004). http://dx.doi.org/10.1117/12.578965 PSISDG 0277-786X Google Scholar
R. V. Kuranovet al.,
“Prediction capability of optical coherence tomography for blood glucose concentration monitoring,”
J. Diabetes Sci. Technol., 1
(4), 470
–477
(2007). Google Scholar
A. G. Podoleanu,
“Review article: optical coherence tomography,”
Br. J. Radiol., 78
(935), 976
–988
(2005). http://dx.doi.org/10.1259/bjr/55735832 BJRAAP 0007-1285 Google Scholar
A. F. Fercher,
“Optical coherence tomography: principles and applications,”
Rep. Prog. Phys., 66
(2), 239
–303
(2003). http://dx.doi.org/10.1088/0034-4885/66/2/204 RPPHAG 0034-4885 Google Scholar
V. V. Tuchin,
“Optical clearing of tissues and blood using the immersion method,”
J. Phys. D, 38
(15), 2497
–2518
(2005). http://dx.doi.org/10.1088/0022-3727/38/15/001 JPAPBE 0022-3727 Google Scholar
X. Xu,
“Effect of dextran-induced changes in refractive index and aggregation on optical properties of whole blood,”
Phys. Med. Biol., 48
(9), 1205
–1221
(2003). http://dx.doi.org/10.1088/0031-9155/48/9/309 PHMBA7 0031-9155 Google Scholar
X. XuQ. ZhuC. Sun,
“Assessment of the effects of ultrasound-mediated alcohols on skin optical clearing,”
J. Biomed. Opt., 14
(3), 034042
(2009). http://dx.doi.org/10.1117/1.3156827 JBOPFO 1083-3668 Google Scholar
S. G. ProskurinI. V. Meglinski,
“Optical coherence tomography imaging depth enhancement by superficial skin optical clearing,”
Laser Phys. Lett., 4
(11), 824
–826
(2007). http://dx.doi.org/10.1002/(ISSN)1612-202X 1612-2011 Google Scholar
A. K. Buiet al.,
“Revisiting optical clearing with dimethyl sulfoxide (DMSO),”
Laser Surg. Med., 41
(2), 142
–148
(2009). http://dx.doi.org/10.1002/lsm.v41:2 LSMEDI 0196-8092 Google Scholar
M. G. Ghosnet al.,
“Monitoring of glucose permeability of monkey skin in vivo using optical coherence tomography,”
J. Biophotonics, 3
(1–2), 25
–33
(2010). http://dx.doi.org/10.1002/jbio.200910075 JBOIBX 1864-063X Google Scholar
A. N. Bashkatovet al.,
“Glucose and mannitol diffusion in human dura mater,”
Biophys. J., 85
(5), 3310
–3318
(2003). http://dx.doi.org/10.1016/S0006-3495(03)74750-X BIOJAU 0006-3495 Google Scholar
A. N. Bashkatovet al.,
“Monte Carlo study of skin optical clearing to enhance light penetration in the tissue,”
Proc. SPIE, 6535 653514
(2007). http://dx.doi.org/10.1117/12.740977 PSISDG 0277-786X Google Scholar
X. Guoet al.,
“In vivo quantification of propylene glycol, glucose and glycerol diffusion in human skin with optical coherence tomography,”
Laser Phys., 20
(9), 1849
–1855
(2010). http://dx.doi.org/10.1134/S1054660X10170032 LAPHEJ 1054-660X Google Scholar
J. T. WhittonJ. D. Everall,
“The thickness of the epidermis,”
Br. J. Dermatol., 89
(5), 467
–476
(1973). http://dx.doi.org/10.1111/bjd.1973.89.issue-5 BJDEAZ 1365-2133 Google Scholar
K. JungheimT. Koschinsky,
“Glucose monitoring at the arm: risky delays of hypoglycemia and hyperglycemia detection,”
Diabetes Care, 25
(6), 956
–960
(2002). http://dx.doi.org/10.2337/diacare.25.6.956 DICAD2 0149-5992 Google Scholar
K. Rebrin,
“Subcutaneous glucose predicts plasma glucose monitoring independent of insulin: implications for continuous,”
Am. J. Physiol. Endocr. Med., 277
(3), E561
–E571
(1999). Google Scholar
T. KoschinskyL. Heinemann,
“Sensors for glucose monitoring: technical and clinical aspects,”
Diabetes Metab. Res. Rev., 17
(2), 113
–123
(2001). Google Scholar
R. V. Kuranovet al.,
“In vivo study of glucose-induced changes in skin properties assessed with optical coherence tomography,”
Phys. Med. Biol., 51
(16), 3885
–3900
(2006). http://dx.doi.org/10.1088/0031-9155/51/16/001 PHMBA7 0031-9155 Google Scholar
X. Wenet al.,
“In vivo skin optical clearing by glycerol solutions: mechanism,”
J. Biophotonics, 3
(1–2), 44
–52
(2010). http://dx.doi.org/10.1002/jbio.200910080 JBOIBX 1864-063X Google Scholar
J. Hirshburget al.,
“Correlation between collagen solubility and skin optical clearing using sugars,”
Lasers Surg. Med., 39
(2), 140
–144
(2007). http://dx.doi.org/10.1002/(ISSN)1096-9101 LSMEDI 0196-8092 Google Scholar
X. XuQ. Zhu,
“Evaluation of skin optical clearing enhancement with Azone as a penetration enhancer,”
Opt. Commun., 279
(1), 223
–228
(2007). http://dx.doi.org/10.1016/j.optcom.2007.06.055 OPCOB8 0030-4018 Google Scholar
|