
|
|
1.IntroductionCharacterization of circulatory and metabolic function in skeletal muscle has important applications in exercise and sports medicine1–5 and provides key information for understanding many common diseases (e.g., peripheral vascular disease,6–8 fibromyalgia,9 heart failure10,11) affecting skeletal muscle. Because differences between healthy and diseased populations are not always apparent at rest, it is important to study muscle hemodynamic and metabolic changes in response to stimuli.2,6,8,10,12,13 Rhythmic exercise is an effective stimulus that induces change in both blood flow (BF) and oxygen consumption rate ().14 The ability to noninvasively quantify these parameters during exercise has great potential for improving diagnosis and treatment assessment, as well as understanding of general muscle function and exercise physiology. BF in skeletal muscle has been quantified over the years by a number of noninvasive methods. Doppler ultrasound BF measurements can probe deep muscle tissue but are limited to large vessels.15 Laser Doppler is capable of monitoring BF in small vessels but is restricted to shallow tissue measurements (skin flow).16 Arterial-spin-labeled MRI (ASL-MRI)17 and positron emission tomography (PET)18 are capable of monitoring deep-tissue microvasculature BF but require expensive and cumbersome equipment not available to all clinics or laboratories. Furthermore, most of these technologies are sensitive to motion artifacts, which can distort signals from contracting muscle. Such limitations have prevented widespread use of these noninvasive technologies in exercise research and clinical settings.19 Oxygen consumption in skeletal muscle has also been quantified by a number of technologies. Whole body can be measured noninvasively via spirometry but does not provide information on the contribution of individual organs/tissues.20 Muscle is often measured invasively using the Fick principle with blood sampling via catheter.21,22 Although this method is established, it is still regional in the scope of dynamics, as blood samples are taken from major vessels connected to several muscle groups, rather than at the level of the local microvasculature. Local muscle has been quantified noninvasively by phosphorus magnetic resonance spectroscopy (31P-MRS) but requires large and expensive equipment, has limited sensitivity, and does not provide high temporal resolution.23 Near-infrared (NIR) diffuse optical methods for quantification of hemodynamics have gained popularity in recent years owing to the noninvasive, portable, relatively inexpensive, and continuous nature of the measurement.1,5,21 These technologies take advantage of the low absorption spectrum of tissue in the NIR range (650 to 950 nm) to penetrate deep tissue and detect absorption of photons by chromophores such as oxy- and deoxyhemoglobin ([] and [Hb], respectively) and scattering by cell and organelle membranes. NIR spectroscopy (NIRS) has been used indirectly to quantify absolute local BF using exogenous tracers24,25 or venous occlusion plethysmography21,26,27 and has been validated against the more standard strain-gauge plethysmography. However, these methods require invasive injection of exogenous tracers or external manipulations (venous occlusion) that interrupt the flow response and prevent truly continuous BF measurement. NIRS has also been used in several studies to quantify absolute muscle at rest and postexercise via arterial or venous occlusion21,26,28,29 and has been validated against blood sampling methods.21 A novel technology, diffuse correlation spectroscopy (DCS), has recently been developed to directly measure relative changes in tissue BF ().30–32 DCS uses a coherent NIR light source to penetrate tissue and monitors temporal light intensity fluctuations caused by moving scatterers (primarily red blood cells) to calculate a flow index (). DCS techniques for measurements have been used previously to study tissue hemodynamics in skeletal muscle13,33–36 and validated in a variety of tissues/organs against other local BF measurements such as xenon-CT,37 laser Doppler,30 and perfusion MRI.33,38 A recently developed hybrid optical device combining NIRS and DCS technologies is capable of simultaneously measuring [Hb], [], total hemoglobin concentration (THC or [tHb]), tissue blood oxygen saturation (), and rBF.31 From and measurements, relative change in () can be calculated.13 Although previous studies have employed this type of hybrid instrument in studying skeletal muscle, measurement is limited to providing only relative values of BF and . In addition, DCS is highly sensitive to muscle fiber motion, which can distort the signal and cause significant overestimation of flow. Previous efforts to minimize motion artifact have required precise coregistration of contraction status and offline data analysis.34 The goal of this study was to provide a method using the hybrid diffuse optical technologies described above to obtain truly continuous, completely noninvasive measurement of absolute BF and in exercising skeletal muscle. Absolute quantification of these values was achieved by using pre-exercise occlusions to quantify absolute baseline BF and and calibrating continuous and signals. Reduction of motion artifact during exercise was achieved by using a novel gating algorithm embedded in the instrument control software, which enables data recording only at time points when muscle fiber motion is minimal. To the best of our knowledge, our experiment demonstrates for the first time the capabilities of using a hybrid optical device to measure absolute BF and continuously and noninvasively in exercising muscle. 2.Methods2.1.Subject CharacteristicsNine healthy young subjects (five men and four women) volunteered to participate in this study after written consent in accordance with approval of the Institutional Review Board at the University of Kentucky. Average physical characteristics () of the subject population were age , height , and weight . 2.2.Experimental DesignAs in previous studies,14,26,28 three protocols were used in this study to obtain absolute BF, , and in forearm muscle during exercise. First, venous occlusion at 50 mmHg was applied on the upper arm to obtain absolute baseline BF.26 Second, arterial occlusion at 240 mmHg was applied to obtain absolute baseline .28 Third, muscle BF and were manipulated by 5-min rhythmic forearm handgrip exercise at 25% maximal voluntary contraction (MVC)14 to test the capabilities of using the hybrid optical device for quantifying absolute BF and continuously during exercise. A previous study14 has shown that at this exercise intensity, muscle is echallenged enough to reach an elevated plateau value without inducing obvious postexercise hyperemic response. This exercise protocol is in line with many other similar studies10,11,26 to allow a basis for comparison of results. During all protocols, a fiber-optic probe was taped to the skin surface above the forearm flexor muscles (flexor digitorum superficialis/profundus) to allow for continuous DCS/NIRS measurements (Fig. 1). The measurement protocols and data acquisition parameters are described in detail in the following subsections. Fig. 1Experimental setup showing dynamometer and flexible fiber-optic probe containing source and detector fibers for both NIRS and DCS, taped to forearm flexor muscles (flexor digitorum superficialis/profundus). Subject is supine, while arm is slightly elevated on a pillow. Hand is resting around handgrip attachment of the dynamometer. 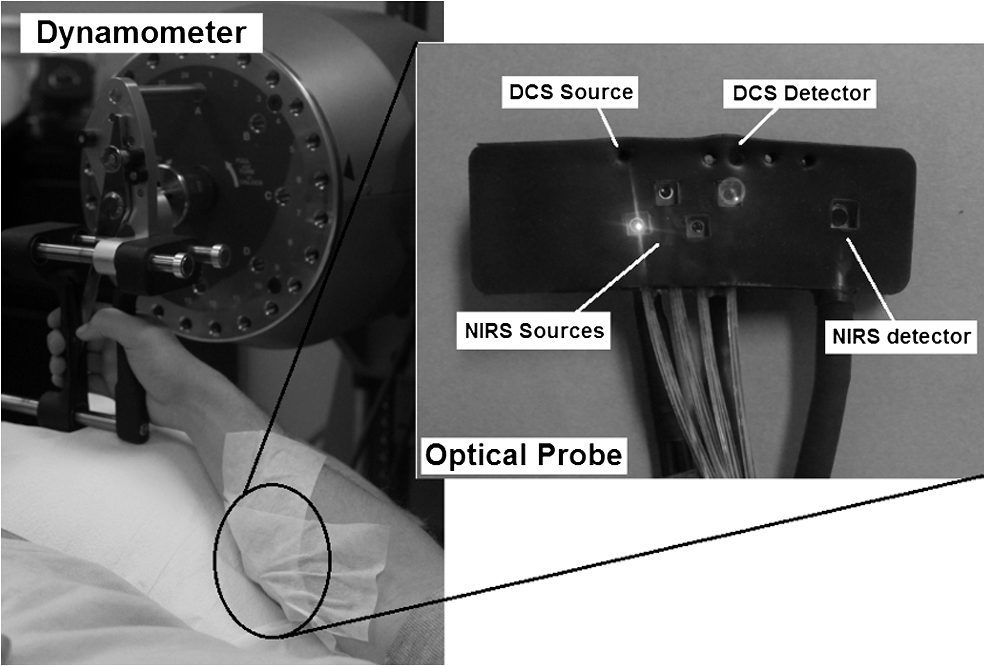 2.3.Experimental ProtocolsBefore the optical probe was fixed, subjects were instructed to lie in supine position with right arm extended, slightly elevated above heart level () to facilitate venous return. Elbow flexion was kept as close to 0 deg as possible. Blood pressure was obtained using an automatic monitor (Omron HEM-80, Kyoto), and skin/adipose tissue thickness above wrist flexor muscles was measured using a skinfold caliper (Lange 85300, Texas). Average resting systolic arterial pressure was , which was sufficiently lower than the pressure used for arterial occlusion (240 mmHg). Skin/adipose tissue thickness (ATT) was (1 to 3 mm), which was sufficiently less than the NIR light penetration depth of (see Discussion). First, subjects’ MVC for isotonic handgrip exercise was determined. Subjects squeezed a handgrip device on a dynamometer (BTE PrimusRS, Maryland) through a distance of 5 cm ( contract, release) for an increasing load (beginning at with an increment of ), until they were unable to perform the task. In most subjects, MVC could be determined within four contractions, reducing the effect of potentiation and fatigue. Average MVC was . After testing of the MVC, the dynamometer load was reduced to 25% MVC () and subjects were given a very brief training period ( repetitions) to familiarize themselves with the rhythm of contractions during the exercise protocol ( contract, release, 1 s rest). Pace was dictated by a visual metronome on the dynamometer monitor, and subjects were able to perform at the set rhythm without difficulty. Subjects were then instructed to rest while the optical probe was fixed to the right forearm and a fast-inflating automatic tourniquet cuff (Zimmer ATS 1000, Indiana) was placed just above the elbow on the right upper arm. For the venous occlusion protocol, 1-min baseline measurement was recorded, followed by three 10-s occlusions (50 mmHg) separated by 30-s rest each. Following the last 30-s rest period, another 1-min recovery was recorded. Then a 3-min arterial occlusion (240 mmHg) was performed, followed by 5-min recovery to baseline. After recovery, subjects performed 5-min handgrip exercise following the rhythm described above. Recovery data was then recorded for 5 min. 2.4.Data Acquisition[], [Hb], THC, and were all measured with NIRS using a commercial tissue oximeter (Imagent, ISS Inc., Illinois). Briefly, the optical probe (Fig. 1) emits light at four alternating wavelengths (690, 750, 780, and 830 nm) modulated at 110 MHz. Light from the four wavelengths was detected at varying distances of 2, 2.5, 3, and 3.5 cm away from the sources and analyzed using frequency domain spectroscopy at multiple source-detector separations (i.e., spatially-resolved spectroscopy) to determine the absolute baseline [Hb] and [].39 To reduce noise contributed by the phase component of the detected signals present in four-wavelength spatially-resolved analysis, relative changes (Δ[Hb], ) were calculated with the data from two wavelengths (830 and 690 nm) at a separation of 2 cm using the modified Beer–Lambert method.40 The and were then added to the absolute baselines to obtain continuous absolute concentrations. THC was calculated as the sum of [Hb] and [], and as the ratio of [] to THC. The instrument used for DCS data acquisition has been described in detail elsewhere.32,41 Briefly, a long-coherence (), continuous-wave laser at 830 nm (Crystalaser Inc., Nevada) emits photons into the tissue surface through a multimode optical fiber, while four single-mode detector fibers located 2 cm away (Fig. 1) measure surface light speckle fluctuations caused by moving scatterers (primarily red blood cells). Detected photons are counted by avalanche photodiodes (APDs, PerkinElmer Inc., Canada), and the output is fed to an autocorrelator board (correlator.com, New Jersey), which uses photon arrival times to determine the light intensity temporal autocorrelation function. Data acquired from the four detectors were averaged together to improve signal-to-noise ratio. From the normalized-intensity temporal autocorrelation function, the electric-field temporal autocorrelation function was derived, satisfying the correlation diffusion equation in highly scattering media.42,43 For the case of diffusive motion, the decay of this function depends on an effective diffusion coefficient and a parameter (ranging from 0 to 1), which is proportional to the red blood cell fraction of the probed tissue.34 BF index () was extracted from the signal by fitting the normalized electric-field temporal autocorrelation function with the theoretical solution.32 The was then normalized to determine the relative change of BF (). During the venous occlusion protocol, only NIRS data were collected at a sampling rate of 3.7 Hz. Preliminary testing showed that this high sampling rate was required to precisely fit the curve of THC increase during venous occlusion measurements. The slope of this curve was then used as a measure of the absolute BF. For the arterial occlusion and exercise, NIRS measurements were combined with DCS measurements in an alternating fashion. Data were acquired continuously during baseline, 3-min arterial occlusion, and recovery and modulated with a gating algorithm during exercise. Sample input and control signals for the gating algorithm are shown in Fig. 2. Because DCS flow measurements are sensitive to motion artifact from muscle fibers, sampling time was constrained to the rest period between contractions during exercise (). DCS sample time was set to whereas NIRS sample time was set to , resulting in a total sampling time of per data point. Contraction status was determined by analog voltage output transferred from the dynamometer to the DCS. Once the voltage surpassed a threshold indicating change from contracted (low voltage) to relaxed (higher voltage) status, the data acquisition entered a short delay period (50 ms) to account for residual motion, and then began recording data. After the frame had been recorded and stored, the algorithm waited for the next rising edge in the dynamometer signal to reinitiate measurement. Fig. 2Input and control signals for the gating algorithm controlling data acquisition during exercise. The dynamometer voltage is the input signal, which parallels the handgrip position. A handgrip position of 0 cm corresponds to fully contracted, whereas 5 cm corresponds to fully relaxed (no motion). The trigger signal is high following the rising edge of the dynamometer voltage. The delay between the trigger impulse and the beginning of data recording accounts for residual muscle motion once the dynamometer voltage has surpassed the threshold.  2.5.Absolute Blood FlowVenous-occlusion plethysmography is a widely accepted method for determining peripheral BF19,44 and has been used with NIRS techniques in several studies.21,26,27,45 Absolute baseline muscle BF was determined as the average rate of increase in THC during the first 5 s of three venous occlusions and converted from units of μM to mL using an average blood hemoglobin concentration of ,46 accounting for a hemoglobin molecular weight of .47 During exercise, absolute BF was calculated by multiplying by the absolute baseline value measured by the venous occlusion protocol. 2.6.Absolute Oxygen Consumption RateBaseline was measured as the linear regression of the oxygen desaturation rate () during the first 60 s of arterial occlusion28 and expressed as mL (accounting for molecular weight of , ratio of to hemoglobin, density of , and muscle density of ). during exercise was calculated based on Fick’s law,13,48,49 which states that is equal to the arteriovenous [] difference times the flow: . Defining the oxygen extraction fraction as: , the equation becomes: . Relative changes in each variable can be defined as rBF, rOEF, and , by dividing each parameter by its respective baseline value. Assuming does not change, the relative change in oxygen consumption rate is calculated as . OEF is related to tissue blood oxygen saturation by the following: , where and are arterial and tissue saturations, and is a measure of the percentage of blood volume contained in the venous compartment of the vascular system,13 assumed to be constant for the duration of the measurement. Further assuming a constant of 100%, becomes: , and , where is baseline tissue oxygen saturation. is measured directly with NIRS, whereas is measured directly with DCS. Absolute during exercise was then calculated by multiplying by the absolute baseline measured by the arterial occlusion protocol. 3.Results3.1.Effect of Gating on Signal AcquisitionFigure 3 shows results from a preliminary test on a single subject demonstrating the difference in DCS flow index () signals acquired during exercise with [Fig. 3(a)] and without [Fig. 3(b)] applying the gating algorithm. The two trials were performed at the same rate and intensity as the other exercise protocols (25% MVC, 1-s contraction/relaxation) and separated by more than 6 min, allowing for recovery of BF and . These results clearly show that the gating algorithm significantly reduced noise due to motion artifact. Fig. 3(a), Raw DCS signal () acquired during exercise with application of gating algorithm. (b), Raw DCS signal acquired during exercise without application of gating algorithm. Exercise was performed at 25% MVC, with 1-s contraction/relaxation. The bold vertical lines denote beginning and end of exercise.  3.2.Typical Individual ResponseThe typical muscle hemodynamic response for a single subject through the entire protocol is shown in Fig. 4. Bold lines illustrate slope-fitting during occlusion. During venous occlusions (VO), THC increased at a rate proportional to the arterial inflow (BF).21 During arterial occlusion (AO), THC remained constant, whereas the desaturation rate () decreased at a rate proportional to .28 This corresponded to a decrease in , and near zero. During exercise, increased, causing a corresponding decrease in as well as an increase in to meet the metabolic demand. Figure 5 shows continuous absolute BF and responses during exercise for the same sample subject. Fig. 4Hemodynamic responses to physiological manipulations in protocols for a single subject. Bold lines show slope fitting for baseline BF and calculations. Vertical lines denote beginning and end of physiological manipulations (occlusions, exercise). (a), Three venous occlusion (VO) measurements with slope fitting for BF calculation. (b), Arterial occlusion (AO) with slope fitting for calculation and exercise (Ex) protocol. Baseline BF and values for this subject were and 0.11 mL (5.04 μmol ), respectively.  Fig. 5Absolute BF (a) and (b) during exercise for a single subject. Values were calculated by multiplying and by their baseline values, and converting to mL and mL , respectively. The bold vertical lines denote beginning and end of exercise. Note that there are some residual motion artifacts, especially before the beginning and at the end of exercise. 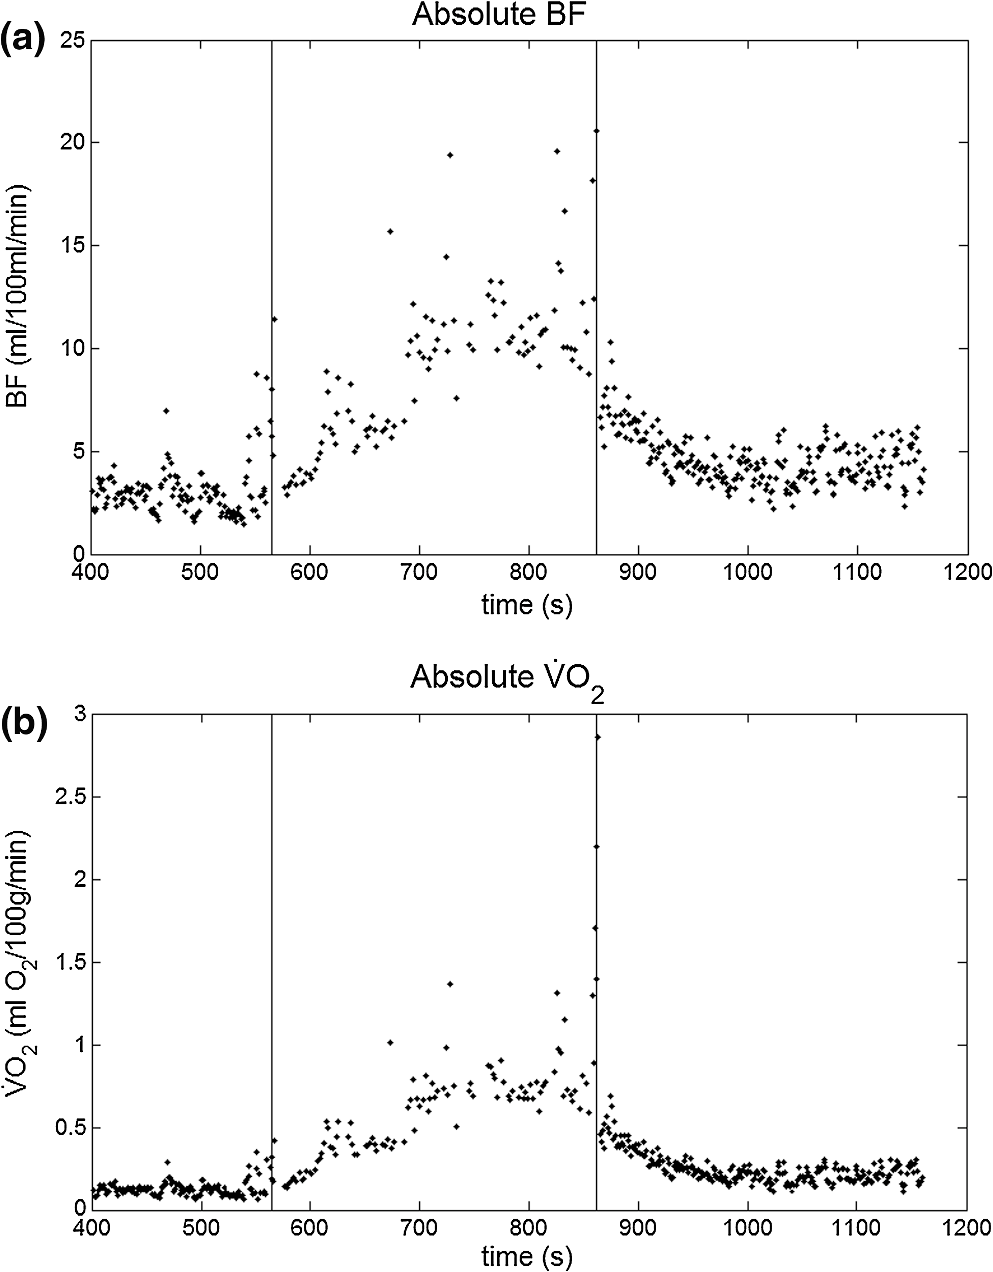 3.3.Average Blood FlowAll subjects demonstrated similar trends in response to occlusion and exercise (Fig. 6). For clarity, filtered BF and responses across the subject population were averaged at 10 s intervals during the exercise protocol. Resting baseline BF for nine subjects () obtained by venous occlusion was . After arterial occlusion, the pre-exercise BF value was determined as the average of data points 30 s before the beginning of exercise (). The pre-exercise BF did not differ significantly from resting BF, indicating that there was no residual hyperemic response following arterial occlusion. During exercise, BF increased rapidly during the first few minutes, then increased following a more exponential pattern to a gradual plateau [Fig. 6(a)]. The plateau BF value was determined as the average BF 30 s before the end of exercise (). Fig. 6(a), Average BF dynamics for all subjects. Pre-exercise average value was , and the average plateau value towards the end of exercise was . (b), Average dynamics for all subjects. Pre-exercise average value was , and average plateau value towards the end of exercise was . Values are . The bold vertical lines denote beginning and end of exercise.  3.4.AverageBaseline value for nine subjects () obtained by arterial occlusion was ( ). During exercise, dynamics followed the BF change; with initial linear increase followed by exponential increase to a gradual plateau [Fig. 6(b)]. Pre-exercise values were determined as the average of data points during the first 30 s before exercise ( ) and were the same as the average resting baseline value. The plateau value toward the end of exercise was found to be . 4.Discussion and ConclusionsQuantification of skeletal muscle BF and during exercise is a useful metric in evaluating circulatory and metabolic function, which can be applied to assessment of pathological conditions in muscular diseases, as well as evaluation of training-induced adaptation of muscle in exercise physiology and sports medicine. The present study employed hybrid NIRS and DCS technology, calibrated on an individual basis by simple physiological manipulations, operating in tandem with a gating algorithm to continuously and noninvasively acquire real-time absolute BF, , [], [Hb], and data from exercising skeletal muscle. Although NIRS/DCS shows promise for hemodynamic measurement during exercise as presented in this study, one should consider the limitations and benefits compared to alternate measurement techniques. The most obvious advantage of NIRS/DCS is that it is completely noninvasive. Compared to catheterization or blood sampling22 for measurement, this technique is much easier to use and more comfortable for the subject, making it ideal for use in research or with fragile patient populations. In addition, the running cost of NIRS/DCS is inexpensive compared to other techniques evaluating local perfusion and oxygen consumption, such as PET, perfusion MRI, and 31P-MRS.19 NIRS/DCS is limited to measuring perfusion at a very specific location, however, which—depending on the application—can be an advantage or a disadvantage. Ultrasound Doppler is a popular method for measuring limb BF through major arteries but is not necessarily reflective of the actual delivery and utilization of oxygen in local skeletal muscle.4 Furthermore, it requires precise placement of the probe in relation to the vessel. To acquire measurement with ultrasound Doppler by the Fick method, additional blood sampling is required. The advantage to using ultrasound Doppler for exercise studies is that it can monitor flow both during the contraction and relaxation phases of rhythmic exercise.19 Previous studies have shown that flow is much higher in major arteries during relaxation compared to contraction,50 although arterial inflow occurs almost exclusively between contractions.51 Perfusion in the microvasculature is inhibited during contractions due to increased intramuscular pressure and extravascular compression.34 Because NIRS/DCS monitors only the smaller vessels,4 it is reasonable to measure BF and only during the relaxation phase of rhythmic exercise. Many previous studies using diffuse optical spectroscopies to monitor exercise hemodynamics and oxidative metabolism in muscle have focused on monitoring values before and after exercise, largely because of the lack of adequate technologies.34 It has been shown, however, that muscle BF and recover quickly to baseline following moderate exercise and can display a significant hyperemic response following heavy exercise.14 Thus, techniques to evaluate BF and directly postexercise can result in significant over- or underestimation depending on the exercise response. This error can be avoided by using DCS/NIRS technology to continuously monitor hemodynamic parameters throughout exercise. In addition, the dynamic pattern of flow and oxygenation response during exercise may contain useful information that cannot be assessed without continuous monitoring. Researchers have applied venous occlusion in conjunction with NIRS to determine BF in resting and exercising muscle21,26,27,52 and validated against the clinically accepted method of strain-gauge plethysmography. Although venous occlusion can provide absolute BF measurement, it requires interruption of natural flow response and can only provide data at discrete time points. By contrast, combined NIRS/DCS allows for continuous and direct measurement of BF without interruption of natural response, making it ideal for studying muscle response during exercise. In addition, studies have also shown that the variability of NIRS with venous-occlusion plethysmography versus strain-gauge measurement increases considerably with increased BF,26 making the validity of the technique questionable for BF measurement in exercise state. By using venous occlusion with NIRS only at baseline to calibrate the DCS measurement, NIRS/DCS reduces this variability and provides more accurate absolute BF response information during exercise. Both venous and arterial occlusions have been used with NIRS in resting quantification,21,28,52,53 and some argument exists as to which is the better method.29 Venous occlusion is less uncomfortable for the subject but is more susceptible to local vasoreactivity and changes in pressure that can cause flow variations. With arterial occlusion, the closed compartment mitigates the effect of centrally mediated variation, and previous studies have found that arterial occlusion has higher reproducibility.21 Measurement of regional muscle during exercise has been previously achieved using the Fick method, which requires continuous monitoring of BF as well as invasive blood sampling in addition to monitoring BF.14 Blood sampling by invasive catheterization causes unwanted discomfort and anxiety to the subject, and the same limitations to continuous monitoring of BF using occlusions apply to continuous monitoring of . Absolute baseline can be easily determined by using noninvasive arterial occlusion with NIRS and calibrating the continuous signal acquired from the hybrid NIRS/DCS instrument. In this way, continuous absolute during exercise can be measured noninvasively. DCS measurement of has been validated against ASL-MRI for monitoring hemodynamic changes in skeletal muscle during reactive hyperemia following ischemia.33 However, further exercise studies have demonstrated that DCS measurements in exercising muscle are highly sensitive to motion artifact causing overestimation of flow, and previous efforts using DCS to quantify during exercise have required precise coregistration with dynamometer recordings and offline analysis to extract noncontaminated DCS data.34 The gating algorithm outlined in the present study eliminates the need for such offline data processing and more accurately determines flow at optimal points in the contraction/relaxation cycle. Figure 3 shows the significant improvement in DCS signals acquired with the gating algorithm compared to those acquired without. Although the motion artifact is not completely eliminated, noise can be further reduced by employing slower exercise protocols, or possibly with improved data acquisition speeds as technology advances. Additionally, noise may be reduced by utilizing real-time data filters. Our baseline results are consistent with previously reported baseline values of BF10,11,21,22,26,27,45,54 and 10,11,21,22,26,45 using similar methods and protocols, as are the plateau values towards the end of exercise10,11,26 (Table 1). The dynamic physiological profiles of BF and changes during exercise agree with previous exercise studies,14,55,56 and the physiologic variability represented by the error bars (Fig. 6) is consistent with another exercise study.14 One difference between our results and others comparing these dynamic profiles is the elevated value during the recovery period following exercise, relative to the resting baseline (Fig. 6). The origin of this shift is not specifically known, but may be due to increased temperature at the probe site from accumulated heat generated by exercising muscle, or flow response differences between the microvasculature and large vessels measured by different modalities (e.g., DCS versus Doppler ultrasound) in different studies. Further investigation is necessary to verify the cause. Table 1Comparison of our results (bottom row) to previous findings.
Note: All measurements are on forearm flexor muscles of healthy adults, and those with exercise data shown are for protocols which involve light/moderate repeated exercise at a similar intensity to that presented in the present study. Venous and arterial occlusion methods are represented as VO and AO, respectively. n/a, not applicable. One concern with NIRS measurements is the influence of adipose tissue thickness ATT. It is well known that penetration depth of near-infrared light in human tissue is roughly half of the source–detector separation.21 Because of this limitation, ATT can sometimes distort hemodynamic measurement. For this study, a source-detector separation of 2 cm was used, probing a depth of . Previous studies have shown that for an optode separation of 2 cm or greater, the contribution of skin is of total light absorption, and the detected signal is mainly from muscle tissue.53 There have been studies58 aimed at correcting the variation in measurement sensitivity due to ATT based on algorithms derived from Monte Carlo simulations with in vivo measurements, which may be useful to employ in future work with subjects that have significant ATT. The results imply, however, that up to the maximal ATT observed in our study (3 mm), the sensitivity of the NIRS/DCS signal is affected by less than 10%. Furthermore, no significant correlation was found between ATT and or BF in this study. Therefore, it is reasonable to assume that skin thickness did not adversely influence our measurements. In calculating , the percentage of blood contained in the venous compartment () was assumed constant. However, there was a detectable change in total blood volume during exercise in the present study, evident as an increase in THC (an average of ). Previous research has shown that NIRS/DCS signals originate primarily from the microvasculature, including arterioles, capillaries, and venules,59 so it may be assumed that the detected blood volume increase is limited to changes in these small vessels. Part of the volume increase is likely due to capillary recruitment, which is a normal physiological response to exercise that increases area for metabolic exchange within the muscle.60 Previous work on mathematical modeling of NIRS measurements61 has suggested that blood volume changes during exercise are primarily due to changes in number of microvascular units perfused and attribute the volume increase to the capillaries. An increase in capillary blood volume is neither in the arterial compartment nor in the venous compartment, and would have minimal impact on . Part of the volume increase may also be due to an increase of blood volume in venules, which are more compliant than arterioles and therefore more capable of accommodating volume changes. In the most dramatic case, we may assume that the total is due solely to changes in venule volume (), while arterial volume () remains constant. This would cause the largest variation in . In this case, an average of change in (representing ) would cause a increase from (Ref. 13) to . This increased during exercise leads to a variation of by a factor of []. Considering the several-fold increase in during exercise (see Fig. 6), this small variation may be considered unimportant. It should be noted that differences in assumed will only impact the measurement, as it is a secondary calculated parameter, whereas BF is measured directly by DCS without any assumption of . While the findings of this study are encouraging, further investigation is necessary to fully validate the technique. The technique developed in this study has been applied at this point only to mild-intensity exercise, and validation is qualitative. The reliability of the technique should be investigated through a range of exercise intensities and energy demands. Simultaneous measurements with other established technologies such as ASL-MRI and 31P-MRS would allow for a quantitative multipoint comparison of both microvascular perfusion and with thorough statistical analysis. A larger subject population is desirable to reduce the effects of intersubject variability and would significantly decrease the error bars shown in Fig. 6. Other means of monitoring muscle contraction status, such as electromyography (EMG), may provide more accuracy in determining time points where data should be acquired to minimize motion artifact. In conclusion, this study demonstrates the capability of novel hybrid NIRS/DCS to continuously monitor absolute hemodynamic and metabolic parameters in local muscle groups during exercise with reduced noise from motion artifact. Because skeletal muscle function depends strongly on oxidative metabolism and BF response, this technology is highly relevant to the study of muscle physiology and pathology. The technology is especially appealing in clinical settings due to its fast, noninvasive, and portable nature, making it an option for even vulnerable populations, in both research laboratory and clinical field. Future developments in spectroscopic technologies promise to make BF and quantification even more accessible, with higher quality real-time data. AcknowledgmentsWe thank the National Institutes of Health for support from NIH-R21AG034279. We also thank Dr. Tim Uhl for his technical assistance with dynamometer operation, and for volunteering his lab space. ReferencesT. Hamaokaet al.,
“The use of muscle near-infrared spectroscopy in sport, health and medical sciences: recent developments,”
Philos. T. R. Soc. A, 369
(1955), 4591
–4604
(2011). http://dx.doi.org/10.1098/rsta.2011.0298 PTRMAD 1364-503X Google Scholar
J. L. JasperseD. R. SealsR. Callister,
“Active forearm blood-flow adjustments to handgrip exercise in young and older healthy-men,”
J. Physiol., 474
(2), 353
–360
(1994). 0022-3751 Google Scholar
B. Chanceet al.,
“Recovery from exercise-induced desaturation in the quadriceps muscles of elite competitive rowers,”
Am. J. Physiol., 262
(3), C766
–C775
(1992). AJPHAP 0002-9513 Google Scholar
K. K. McCullyT. Hamaoka,
“Near-infrared spectroscopy: what can it tell us about oxygen saturation in skeletal muscle?,”
Exerc. Sport Sci. Rev., 28
(3), 123
–127
(2000). ESSRB8 0091-6331 Google Scholar
V. QuaresimaR. LepantoM. Ferrari,
“The use of near infrared spectroscopy in sports medicine,”
J. Sport Med. Phys. Fitness, 43
(1), 1
–13
(2003). 0022-4707 Google Scholar
D. Wallaceet al.,
“Summary of the results of a 95 subject human clinical trial for the diagnosis of peripheral vascular disease using a near infrared frequency domain hemoglobin spectrometer,”
in SPIE Conference on Optical Tomography and Spectroscopy of Tissue III,
300
–316
(1999). Google Scholar
T. R. Cheatleet al.,
“Near-infrared spectroscopy in peripheral vascular-disease,”
Br. J. Surg., 78
(4), 405
–408
(1991). http://dx.doi.org/10.1002/(ISSN)1365-2168 BJSUAM 0007-1323 Google Scholar
U. Wolfet al.,
“Localized irregularities in hemoglobin flow and oxygenation in calf muscle in patients with peripheral vascular disease detected with near-infrared spectrophotometry,”
J. Vasc. Surg., 37
(5), 1017
–1026
(2003). http://dx.doi.org/10.1067/mva.2003.214 0741-5214 Google Scholar
A. Elvinet al.,
“Decreased muscle blood flow in fibromyalgia patients during standardised muscle exercise: a contrast media enhanced colour doppler study,”
Eur. J. Pain, 10
(2), 137
–144
(2006). http://dx.doi.org/10.1016/j.ejpain.2005.02.001 1090-3801 Google Scholar
R. Zeliset al.,
“A comparison of regional blood flow and oxygen utilization during dynamic forearm exercise in normal subjects and patients with congestive heart failure,”
Circulation, 50
(1), 137
–143
(1974). http://dx.doi.org/10.1161/01.CIR.50.1.137 CIRCAZ 0009-7322 Google Scholar
J. M. ArnoldJ. P. RibeiroW. S. Colucci,
“Muscle blood flow during forearm exercise in patients with severe heart failure,”
Circulation, 82
(2), 465
–472
(1990). http://dx.doi.org/10.1161/01.CIR.82.2.465 CIRCAZ 0009-7322 Google Scholar
K. K. McCullyC. HalberJ. D. Posner,
“Exercise-induced changes in oxygen-saturation in the calf muscles of elderly subjects with peripheral vascular-disease,”
J. Gerontol., 49
(3), B128
–B134
(1994). JOGEA3 0022-1422 Google Scholar
G. Yuet al.,
“Time-dependent blood flow and oxygenation in human skeletal muscles measured with noninvasive near-infrared diffuse optical spectroscopies,”
J. Biomed. Opt., 10
(2), 024027
(2005). http://dx.doi.org/10.1117/1.1884603 JBOPFO 1083-3668 Google Scholar
M. C. Van Beekveltet al.,
“Blood flow and muscle oxygen uptake at the onset and end of moderate and heavy dynamic forearm exercise,”
Am. J. Physiol. Regul. Integr. Comp. Physiol., 280
(6), R1741
–R1747
(2001). 0363-6119 Google Scholar
C. M. Sehgalet al.,
“Quantitative vascularity of breast masses by Doppler imaging: regional variations and diagnostic implications,”
J. Ultrasound Med., 19
(7), 427
–440
(2000). 0278-4297 Google Scholar
E. Wahlberget al.,
“Level of arterial-obstruction in patients with peripheral arterial occlusive disease (PAOD) determined by laser-Doppler fluxmetry,”
Eur. J. Vasc. Surg., 7
(6), 684
–689
(1993). http://dx.doi.org/10.1016/S0950-821X(05)80717-0 1078-5884 Google Scholar
P. Schmittet al.,
“Quantitative tissue perfusion measurements in head and neck carcinoma patients before and during radiation therapy with a non-invasive MR imaging spin-labeling technique,”
Radiother. Oncol., 67
(1), 27
–34
(2003). http://dx.doi.org/10.1016/S0167-8140(03)00024-0 RAONDT 0167-8140 Google Scholar
J. C. Baron,
“Mapping the ischaemic penumbra with PET: implications for acute stroke treatment,”
Cerebrovasc. Dis., 9
(4), 193
–201
(1999). http://dx.doi.org/10.1159/000015955 CERDDD 1015-9770 Google Scholar
G. Radegran,
“Limb and skeletal muscle blood flow measurements at rest and during exercise in human subjects,”
P. Nutr. Soc., 58
(4), 887
–898
(1999). http://dx.doi.org/10.1017/S0029665199001196 0029-6651 Google Scholar
M. N. Smithieset al.,
“Comparison of oxygen-consumption measurements: indirect calorimetry versus the reversed Fick method,”
Crit. Care Med., 19
(11), 1401
–1406
(1991). http://dx.doi.org/10.1097/00003246-199111000-00017 CCMDC7 0090-3493 Google Scholar
M. C. van Beekveltet al.,
“Performance of near-infrared spectroscopy in measuring local O2 consumption and blood flow in skeletal muscle,”
J. Appl. Physiol., 90
(2), 511
–519
(2001). JAPYAA 0021-8987 Google Scholar
R. F. Mottram,
“The oxygen consumption of human skeletal muscle invivo,”
J. Physiol., 128
(2), 268
–276
(1955). 0022-3751 Google Scholar
T. Sakoet al.,
“Validity of NIR spectroscopy for quantitatively measuring muscle oxidative metabolic rate in exercise,”
J. Appl. Physiol., 90
(1), 338
–344
(2001). JAPYAA 0021-8987 Google Scholar
W. M. Kuebler,
“How NIR is the future in blood flow monitoring?,”
J. Appl. Physiol., 104
(4), 905
–906
(2008). http://dx.doi.org/10.1152/japplphysiol.00106.2008 JAPYAA 0021-8987 Google Scholar
H. Habazettlet al.,
“Near-infrared spectroscopy and indocyanine green derived blood flow index for noninvasive measurement of muscle perfusion during exercise,”
J. Appl. Physiol., 108
(4), 962
–967
(2010). http://dx.doi.org/10.1152/japplphysiol.01269.2009 JAPYAA 0021-8987 Google Scholar
R. A. De Blasiet al.,
“Noninvasive measurement of forearm blood-flow and oxygen-consumption by near-infrared spectroscopy,”
J. Appl. Physiol., 76
(3), 1388
–1393
(1994). JAPYAA 0021-8987 Google Scholar
F. Harelet al.,
“Near-infrared spectroscopy to monitor peripheral blood flow perfusion,”
J. Clin. Monitor. Comput., 22
(1), 37
–43
(2008). http://dx.doi.org/10.1007/s10877-007-9105-9 1387-1307 Google Scholar
R. A. Deblasiet al.,
“Noninvasive measurement of human forearm oxygen-consumption by near-infrared spectroscopy,”
Eur. J. Appl. Physiol., 67
(1), 20
–25
(1993). http://dx.doi.org/10.1007/BF00377698 EJAPFN 1439-6319 Google Scholar
M. FerrariT. BinzoniV. Quaresima,
“Oxidative metabolism in muscle,”
Philos. Trans. Roy. Soc. London Ser. B Biol. Sci., 352
(1354), 677
–683
(1997). http://dx.doi.org/10.1098/rstb.1997.0049 0080-4622 Google Scholar
T. Durduran,
“Non-invasive measurements of tissue hemodynamics with hybrid diffuse optical methods,”
xxi University of Pennsylvania,
(2004). Google Scholar
Y. Shanget al.,
“Portable optical tissue flow oximeter based on diffuse correlation spectroscopy,”
Opt. Lett., 34
(22), 3556
–3558
(2009). http://dx.doi.org/10.1364/OL.34.003556 OPLEDP 0146-9592 Google Scholar
C. Cheunget al.,
“In vivo cerebrovascular measurement combining diffuse near-infrared absorption and correlation spectroscopies,”
Phys. Med. Biol., 46
(8), 2053
–2065
(2001). http://dx.doi.org/10.1088/0031-9155/46/8/302 PHMBA7 0031-9155 Google Scholar
G. Yuet al.,
“Validation of diffuse correlation spectroscopy for muscle blood flow with concurrent arterial spin labeled perfusion MRI,”
Opt. Express, 15
(3), 1064
–1075
(2007). http://dx.doi.org/10.1364/OE.15.001064 OPEXFF 1094-4087 Google Scholar
Y. Shanget al.,
“Effects of muscle fiber motion on diffuse correlation spectroscopy blood flow measurements during exercise,”
Biomed. Opt. Express, 1
(2), 500
–511
(2010). http://dx.doi.org/10.1364/BOE.1.000500 BOEICL 2156-7085 Google Scholar
N. Munket al.,
“Noninvasively measuring the hemodynamic effects of massage on skeletal muscle: a novel hybrid near-infrared diffuse optical instrument,”
J. Bodyw. Mov. Ther., 16
(1), 22
–28
(2012). Google Scholar
M. Belauet al.,
“Noninvasive observation of skeletal muscle contraction using near-infrared time-resolved reflectance and diffusing-wave spectroscopy,”
J. Biomed. Opt., 15
(5), 057007
(2010). http://dx.doi.org/10.1117/1.3503398 JBOPFO 1083-3668 Google Scholar
M. N. Kimet al.,
“Noninvasive measurement of cerebral blood flow and blood oxygenation using near-infrared and diffuse correlation spectroscopies in critically brain-injured adults,”
Neurocrit. Care, 12
(2), 173
–180
(2010). http://dx.doi.org/10.1007/s12028-009-9305-x 1541-6933 Google Scholar
T. Durduranet al.,
“Diffuse optical measurement of blood flow, blood oxygenation, and metabolism in a human brain during sensorimotor cortex activation,”
Opt. Lett., 29
(15), 1766
–1768
(2004). http://dx.doi.org/10.1364/OL.29.001766 OPLEDP 0146-9592 Google Scholar
S. Fantiniet al.,
“Frequency-domain multichannel optical-detector for noninvasive tissue spectroscopy and oximetry,”
Opt. Eng., 34
(1), 32
–42
(1995). http://dx.doi.org/10.1117/12.183988 OPENEI 0892-354X Google Scholar
S. Fantiniet al.,
“Non-invasive optical monitoring of the newborn piglet brain using continuous-wave and frequency-domain spectroscopy,”
Phys. Med. Biol., 44
(6), 1543
–1563
(1999). http://dx.doi.org/10.1088/0031-9155/44/6/308 PHMBA7 0031-9155 Google Scholar
J. P. Culveret al.,
“Diffuse optical tomography of cerebral blood flow, oxygenation, and metabolism in rat during focal ischemia,”
J. Cerebr. Blood F. Met., 23
(8), 911
–924
(2003). http://dx.doi.org/10.1097/01.WCB.0000076703.71231.BB 0271-678X Google Scholar
D. A. BoasL. E. CampbellA. G. Yodh,
“Scattering and imaging with diffusing temporal field correlations,”
Phys. Rev. Lett., 75
(9), 1855
–1858
(1995). http://dx.doi.org/10.1103/PhysRevLett.75.1855 PRLTAO 0031-9007 Google Scholar
D. A. BoasA. G. Yodh,
“Spatially varying dynamical properties of turbid media probed with diffusing temporal light correlation,”
J. Opt. Soc. Am. A, 14
(1), 192
–215
(1997). http://dx.doi.org/10.1364/JOSAA.14.000192 JOAOD6 0740-3232 Google Scholar
I. B. WilkinsonD. J. Webb,
“Venous occlusion plethysmography in cardiovascular research: methodology and clinical applications,”
Br. J. Clin. Pharmacol., 52
(6), 631
–646
(2001). http://dx.doi.org/10.1046/j.0306-5251.2001.01495.x BCPHBM 0306-5251 Google Scholar
M. C. Van Beekveltet al.,
“Quantitative measurement of oxygen consumption and forearm blood flow in patients with mitochondrial myopathies,”
Adv. Exp. Med. Biol., 471 313
–319
(1999). http://dx.doi.org/10.1007/978-1-4615-4717-4 AEMBAP 0065-2598 Google Scholar
A. H. van Stratenet al.,
“Preoperative hemoglobin level as a predictor of survival after coronary artery bypass grafting: a comparison with the matched general population,”
Circulation, 120
(2), 118
–125
(2009). http://dx.doi.org/10.1161/CIRCULATIONAHA.109.854216 CIRCAZ 0009-7322 Google Scholar
H. H. Billett,
“Hemoglobin and hematocrit,”
Clinical Methods: The History, Physical, and Laboratory Examinations, Butterworth Publishers, Boston
(1990). Google Scholar
S. Hommaet al.,
“Near-infrared estimation of O2 supply and consumption in forearm muscles working at varying intensity,”
J. Appl. Physiol., 80
(4), 1279
–1284
(1996). JAPYAA 0021-8987 Google Scholar
C. Casavolaet al.,
“Blood flow and oxygen consumption with near-infrared spectroscopy and venous occlusion: spatial maps and the effect of time and pressure of inflation,”
J. Biomed. Opt., 5
(3), 269
–276
(2000). http://dx.doi.org/10.1117/1.429995 JBOPFO 1083-3668 Google Scholar
A. KagayaF. Ogita,
“Blood flow during muscle contraction and relaxation in rhythmic exercise at different intensities,”
Ann. Physiol. Anthropol., 11
(3), 251
–256
(1992). Google Scholar
B. Saltinet al.,
“Skeletal muscle blood flow in humans and its regulation during exercise,”
Acta. Physiol. Scand., 162
(3), 421
–436
(1998). Google Scholar
T. Hamaokaet al.,
“Noninvasive measures of oxidative metabolism on working human muscles by near-infrared spectroscopy,”
J. Appl. Physiol., 81
(3), 1410
–1417
(1996). JAPYAA 0021-8987 Google Scholar
N. B. HampsonC. A. Piantadosi,
“Near-infrared monitoring of human skeletal-muscle oxygenation during forearm ischemia,”
J. Appl. Physiol., 64
(6), 2449
–2457
(1988). JAPYAA 0021-8987 Google Scholar
A. D. Edwardset al.,
“Measurement of hemoglobin flow and blood flow by near-infrared spectroscopy,”
J. Appl. Physiol., 75
(4), 1884
–1889
(1993). JAPYAA 0021-8987 Google Scholar
C. A. KindigT. E. RichardsonD. C. Poole,
“Skeletal muscle capillary hemodynamics from rest to contractions: implications for oxygen transfer,”
J. Appl. Physiol., 92
(6), 2513
–2520
(2002). JAPYAA 0021-8987 Google Scholar
M. E. TschakovskyR. L. Hughson,
“Ischemic muscle chemoreflex response elevates blood flow in nonischemic exercising human forearm muscle,”
Am. J. Physiol., 277
(2 Pt 2), H635
–H642
(1999). AJPHAP 0002-9513 Google Scholar
M. C. P. van Beekveltet al.,
“Quantitative near-infrared spectroscopy discriminates between mitochondrial myopathies and normal muscle,”
Ann. Neurol., 46
(4), 667
–670
(1999). http://dx.doi.org/10.1002/(ISSN)1531-8249 ANNED3 0364-5134 Google Scholar
M. Niwayamaet al.,
“Quantitative measurement of muscle hemoglobin oxygenation using near-infrared spectroscopy with correction for the influence of a subcutaneous fat layer,”
Rev. Sci. Instrum., 71
(12), 4571
–4575
(2000). http://dx.doi.org/10.1063/1.1322578 RSINAK 0034-6748 Google Scholar
R. Boushelet al.,
“Monitoring tissue oxygen availability with near infrared spectroscopy (NIRS) in health and disease,”
Scand. J. Med. Sci. Sports, 11
(4), 213
–222
(2001). SMSSEO Google Scholar
D. Dawsonet al.,
“Vascular recruitment in skeletal muscle during exercise and hyperinsulinemia assessed by contrast ultrasound,”
Am. J. Physiol. Endocrinol. Metab., 282
(3), E714
–E720
(2002). 0193-1849 Google Scholar
N. Laiet al.,
“Modeling oxygenation in venous blood and skeletal muscle in response to exercise using near-infrared spectroscopy,”
J. Appl. Physiol., 106
(6), 1858
–1874
(2009). http://dx.doi.org/10.1152/japplphysiol.91102.2008 JAPYAA 0021-8987 Google Scholar
|


