|
|
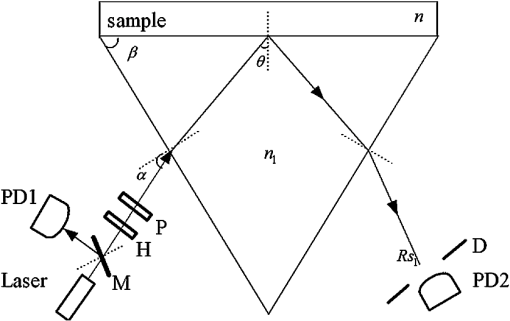
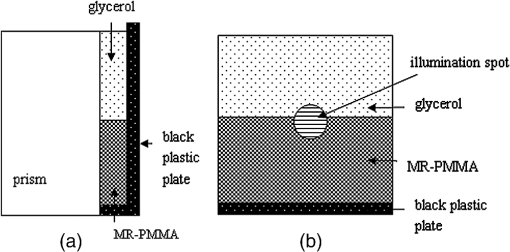
1.IntroductionThe complex refractive index (RI) can be defined in terms of a real part and an imaginary part as , where means the extinction coefficient. In the field of near-infrared tomography, fluorescence diagnosis, laser surgery, and photodynamic therapy (PDT), it is vital to know the precise value of RI.1–3 It has been proven that the RI value affects average diffuse intensity solved by the radiative transfer equation and the calculation of other optical parameters of biotissue, namely the absorption coefficient , the scattering coefficient , and the anisotropy factor g.4–6 The total internal reflection (TIR) method is recommended to have the highest precision for RI measurements of animal tissue and has been investigated by different groups worldwide.7–11 The excellent work of Ding et al. first introduced the dual-parameter fitting method to obtain and of skin tissue by nonlinear fitting simultaneously.12 The modified version of the TIR method, named the extended derivative total reflection method (EDTRM),13 has recently been applied to the measurement of biotissue and a series of tissue-mimicking phantoms. Using EDTRM, is directly determined by the derivative of the reflectance curve and is obtained from nonlinear fitting. In the former research, RI is usually treated as the ‘average value’ of tissue fluid and muscle tissue. Bolin et al. resorted to homogenization by a blender and believed that the liquid expressed from homogenate has a similar RI with the overall tissue.7 Most of the other researchers applied pressures on the tissue sample to eliminate the air gap and tissue fluid between the prism and the tissue,9–13 while neglecting the role of tissue fluid. Actually, a close relationship between the increase of tissue fluid and the reduction of the local chromophore concentration as well as the scattering coefficient has been proven by a prior study.14 Is there any method to obtain more accurate RI of muscle tissue in the presence of tissue fluid. In this paper, we discover that the existence of the tissue fluid at the prism-sample interface is unavoidable in the measurement and has an important effect on the determination of RI of animal muscle tissue. The contacting area of the tissue sample consists of tissue fluid and muscle tissue. A new model based on EDTRM is proposed to explain the significant information revealed by the measured results. In order to verify the new model, a simulation sample made of glycerol and methyl-red-doped poly(methyl methacrylate) (MR-PMMA) is measured. Then we applied the new model for the measurement of fresh porcine, chicken breast, and ovine muscle tissues. During the laborious preparation and measurement of tissue samples, we find that a compromised pressure that is between eliminating partial tissue fluid and avoiding damage to the intrinsic properties of the tissue sample is needed in sample preparation. We also find that with a change of the proportion parameter of the tissue fluid, the RI of muscle tissue can still be measured using the new model. 2.Material and MethodThe experimental setup for reflectance measuring is schematically shown in Fig. 1, which is similar to that of Ref. 13. A He-Ne laser (632.8 nm) is used. M is a beam splitter. H is a half-wave plate. P is the polarizer. PD1 and PD2 are the two detectors of a dual-channel power meter (PM320E, Thorlabs, New Jersey). The aperture size of the photodiode sensor (S130C, Thorlabs, New Jersey) is 9.5 mm, so we used an aperture diaphragm D with diameter of about 5 mm to eliminate the scattering light and parasitic light. An equilateral triangular prism is fixed on a rotation stage (M-038, Physik Instrumente, Karlsruhe, Germany). According to the schematic diagram in Fig. 1, can be solved by where is the critical incident angle when TIR occurs at the prism-sample interface. According to the Fresnel formula,15 the reflectance at the prism-sample interface for a transverse electric (TE) wave can be expressed as and where parameters and are the intermediate variables. The reflectance at the air-prism interface can be expressed as When emergent light leaves the prism and enters into air, the reflection loss is approximately equal to the loss at the incident air-prism interface. The final measured reflectance detected by PD2 should include the loss between the two interfaces mentioned above, which isBy measuring the reflectance curves of the sample, is obtained at the angular position of the derivative maximum of reflectance curve.13 is calculated by Eq. (1). There are similar equations for a transverse magnetic (TM) wave. Using Eq. (6), we found a large distortion between experimental data of animal tissues and theoretical fitting. Taking into account of the tissue fluid, Eq. (6) is modified by a new model as where and are the reflectance from tissue fluid and muscle tissue surface, respectively; and are the proportion parameters of the tissue fluid and the muscle tissue at the illuminated areas, . of the muscle tissue is determined by the second angular position of the derivative maximum of the reflectance curve. Using Eq. (7) and a nonlinear fitting program based on the Nelder-Mead simplex algorithm, , , and can be resolved by minimizing the sum where is the ’th measured reflectance. is the ’th calculated reflectance obtained by Eq. (7).The reliability of fitting are described by , defined as where is the mean value of the measured reflectance over N values of incident angle. The value of ranges from 0 to 1 and it’s closer to 1 when we obtain a reliable fitting.According to the normal sample preparation procedure of animal tissue for RI measurement, fresh porcine tissue was frozen for 30 min first and then sliced to a thin section of about 5 mm thickness. After 15 min, the surface of tissue was cleaned with alcohol to reduce the influence of condensation. The sample was pressed on the surface of the prism to make sure no air gap exists and some tissue fluid exudates at the interface. Fresh chicken breast and ovine muscle tissue were prepared the same way as the porcine sample. Each sample was continuously measured five times to calculate the standard deviation. In order to get the RI of pure tissue fluid, we picked up some tissue fluid by pressing heavily on the fresh porcine tissue and measured it. Since the proportions of tissue fluid and muscle tissue at the prism-sample interface are variable for different types of tissues and conditions, we made a simulation sample to simulate the reflection of tissue and verify the new model. The simulation sample is made of two materials with known and : the glycerol () and MR-PMMA (). The choice of these two materials is according to the difference between their RIs, which is close to the difference between the tissue fluid and the muscle tissue. The front and right side views of the cross section of the simulation sample are schematically shown in Fig. 2(a) and 2(b). For the simulation sample fabrication, methyl-red and PMMA (with a weight ratio of about 3%) were first dissolved in cyclohexanone separately and then mixed together. After stirring for 30 min, the mixture was poured carefully on the one surface of the prism. After 24 h for the volatilization of cyclohexanone and the hardening of the mixture, deposited thick MR-PMMA film was obtained with a thickness of about 5 mm. Then a small groove made of a black plastic plate is fixed on the prism. Glycerol was added into the groove. The interface of the glycerol and MR-PMMA is almost parallel to the horizontal plane. As seen in Fig. 2(b), the illuminated area inside a circle of radius about 3 mm was divided into two parts by the interface, while the upper white area is the glycerol and the lower shadow area is the MR-PMMA. The proportions of glycerol in the illuminated area can be adjusted by moving the prism vertically. Here, the subscript ‘1’ and ‘2’ in Eq. (7) denote the glycerol and the MR-PMMA, respectively. and of the MR-PMMA, and and can be resolved using the method depicted above. 3.Results and DiscussionMeasurements for three proportions of glycerol in the illuminated area were taken, with equal to 38.83%, 14.39%, and 10.48%, respectively. Figure 3 shows the measured reflectance data, fitting curves, and the derivative of reflectance curves for the simulation samples. The calculated of glycerol is about 1.4698 and has a shift of 0.0011 compared with the pure glycerol sample. of MR-PMMA are 1.5205, 1.5217, and 1.5218, respectively, which have shifts of less than 0.002. of MR-PMMA are 0.00030, 0.00040, and 0.00032, respectively. The values of are larger than 0.9920. The results have proved the reliability of the new model described by Eq. (7). In Fig. 4, it’s distinct that the amplitude of the first peak increases with the proportion of glycerol , while the positions of two derivative maxima are not sensitive to . The result implies that the proportion of glycerol has no impact on the measured RI of glycerol and MR-PMMA. Fig. 3(a) Measured reflectance data and fitting curves of the simulation sample with three different proportions of glycerol (TE wave). (b) The derivative of the reflectance curves. 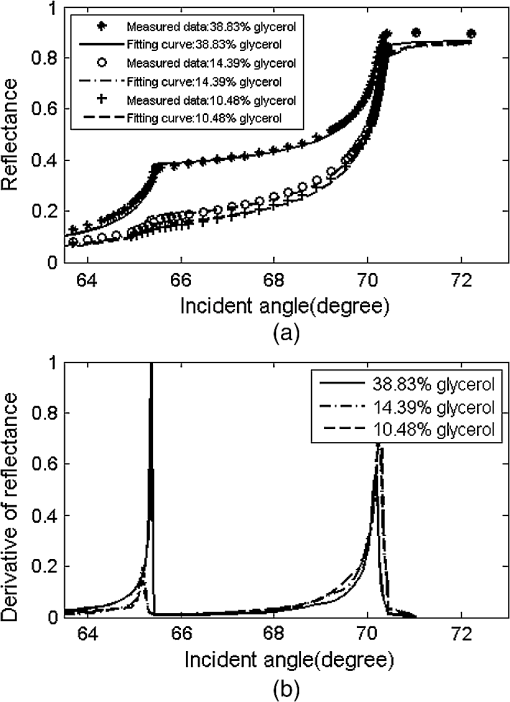 Fig. 4Measured reflectance curve of porcine tissue and the derivative of the reflectance curve (TM wave). 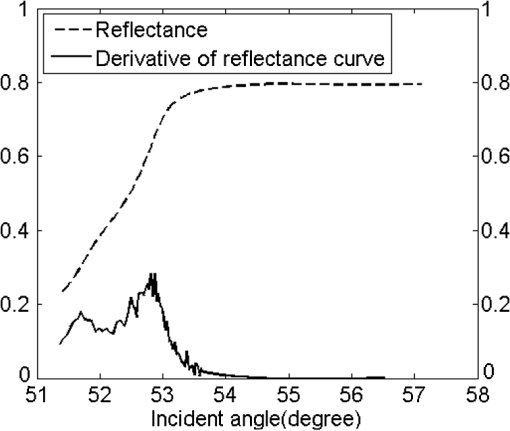 We compared the values of and of MR-PMMA determined using the new model, the dual-parameter fitting method,12 and EDTRM.13 Results are listed in Table 1. Clearly we can see that using EDTRM, only the right can be obtained and is much smaller compared with the real values. The dual-parameter fitting method achieves a better fitting than EDTRM while both and have a large shift from the real value, for example, the shift of is about 0.05 when equals to 38.83%. has an obvious impact on the misleading results and a smaller will lead to a much smaller error. Results have indicated that when the sample has two components, a new model is required to achieve accurate RI of each component. Glycerol in the liquid state has close contact with the MR-PMMA. There is no air gap between the two materials, so the effect of diffraction is subtle and was not observed in the experiment. Though the interface in the illumination spot has variable proportion, it is almost an ideal line and parallel to the horizontal plane, which occupies a rather small part and the effect of the interface can be neglected. Table 1Comparison of nr and κ of MR-PMMA using three methods (TE wave).
Measured reflectance and the derivative of the reflectance curves for porcine chicken breast and ovine muscle tissues are shown in Figs. 4 and 5. In Fig. 4, equals 31.29%. We found that double peaks appear on the derivative curves. From the first peak position of the derivative curve, the calculated is 1.3565, which is similar to the measured value of pure tissue fluid (). The result has proved that the first smaller ‘hump’ on the reflectance curve should originate from the tissue fluid. From the second peak, the calculated of 1.3861 is similar to the reported values of porcine tissue.9,12,16 Significant information is revealed that the contacting area of the sample consists of the tissue fluid and muscle tissue. Fig. 5(a) Measured reflectance data and fitting curves of chicken breast and ovine tissue (TM wave). (b) The derivative of the reflectance curves. 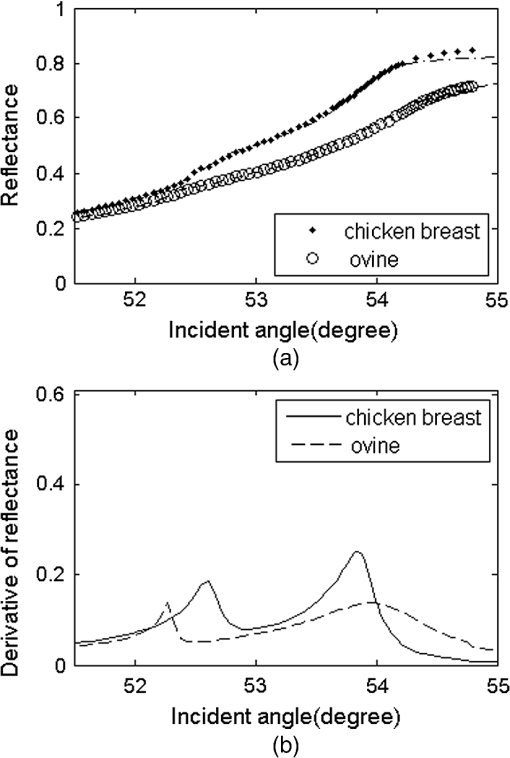 In Fig. 5, the proportion parameters of tissue fluid equals 20.79% for chicken breast and 12.17% for ovine tissue. The of chicken breast tissue is about 1.3907, which is almost equal to the result of 1.399 measured using low-coherence interferometry.17 For ovine tissue, , which is similar to the reported results of 1.402 and 1.389 (Refs. 12 and 16, respectively). The standard deviation of is smaller than 0.001 for tissue samples. Fitting reflectance curves of ovine tissue obtained using EDTRM, dual-parameter fitting, and the new model are shown in Fig. 6. Comparisons of the three methods are listed in Table 2. The new model reveals a more superior fitting than the other two methods. Take ovine muscle tissue, for example. Similar to the analysis of the simulation sample, both the dual-parameter fitting method and EDTRM have caused errors to and . is 0.9905 for dual-parameter fitting method and 0.9680 for EDTRM, which was usually thought to get a satisfactory fitting. The new model obtains the best fitting with larger than 0.9960. The subtle hump on the measured reflectance curve was enlarged in the inset of Fig. 6. Table 2RIs of porcine, chicken breast, and ovine tissue (TM wave).
Fig. 6Measured reflectance data and fitting curves of ovine tissue using EDTRM, dual-parameter fitting, and the new model (TM wave). An enlargement of the rectangular area on the reflectance curves is shown in the inset. 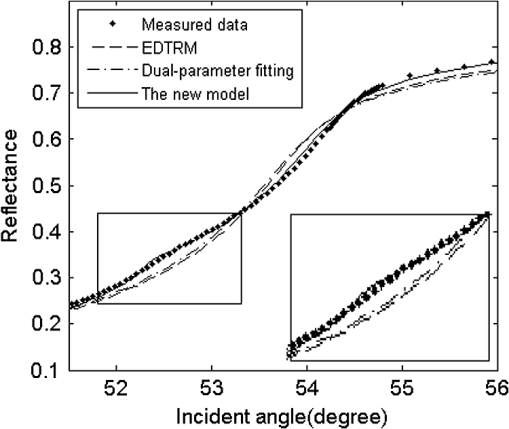 Actually, the similar small ‘hump’ was also recorded by Fig. 2 of Ref. 10 and Fig. 7 of Ref. 12 in the RI measurement of porcine kidney and epidermis, but it was not discussed. As seen in Fig. 2, the incident light at the surface of the sample has a beam diameter of about 3 mm. There is a random distribution of tissue fluid and muscle tissue at the prism-tissue interface. Either the fluid or the muscle tissue part can be simplified as homogenous and shows an average RI value. The first peak on the derivative curves of Figs. 4 and 5(a) originates from the reflectance of the tissue fluid, while the real of the muscle tissue should be calculated from the second peak. The measured reflectance curve is the summation of the reflectance from the two kinds of contacting areas. It was commonly believed that the main differences among published results should be ascribed to sample-to-sample variance and sample preparation conditions, so the existence of tissue fluid didn’t receive much attention. A strong positive relationship was shown between the value of and the difference using the three methods. For porcine and chicken breast tissues, the values of vary a lot using the three methods because a larger amount of tissue fluid exists. For ovine tissue, the difference is much smaller with equal to 12.17%. The knowledge of the optical properties of biological tissue is of fundamental importance for RI measurement. Tissue fluid usually consists of extracellular fluid () and intracellular fluid ().18 In our experiment, most of the capillaries of the tissue samples run predominantly parallel with the muscle fibers. The main component of the tissue fluid should be the intracellular fluid, because the incisions were made perpendicular to the long axis of muscle fibers. From the optical point of view at the cells, structures with different RIs in the surroundings and in the interior of the cells contribute to the average RI of tissue. The aqueous solution of salts and proteins consisted in the cells lead to a mean RI of approximately 1.38. In membrane structures, there are about 5% of lipids having a higher RI of about 1.48.19 The measured of tissue fluid or muscle tissue should be the average RI in the illumination spot. According to the electromagnetic theory, when TIR occurs, the energy of the incident light decays rapidly and some light penetrates into the less dense medium over relatively short distances. The penetration depth is usually on the order of wavelength or smaller.20 If large amounts of tissue fluid or water exists and forms a thin layer between the prism and the muscle tissue, the RI of muscle tissue cannot be measured because the total reflection will only occur at the fluid-prism surface. The RI value depends much on the conditions of sample preparation and storage; fresh or frozen tissue samples are needed. For frozen samples, the water brought by surface condensation should be removed by surface cleaning. Pressure is often added on the surface of the sample for the measurement. In the former research, damage to the samples and the significant change of values were observed when the pressure was higher than 0.4 Mpa,12 so high pressure is forbidden. Similar to the tissue-machine interface concerns brought up by Chaiken et al. in their in vivo apparatus setup,21 pressure registration on the surface of these in vitro tissues is of essential importance in this study. They provided an appropriate apparatus for applying and maintaining pressure on the tissue surface and discussed the effects of pressure in detail. The applied pressure needs to be maintained in a reasonable range that should avoid a discernible change of the intrinsic properties of the tissue, while also guaranteeing no air gap exists at the sample-prism interface. Cancer progression obviously alters the tissue organization, as exhibited by consistently higher RI variance in tumors versus normal regions.22 For other types of tissue, the composition of protein, lipid, and polysaccharide may lead to RI change. Studies have shown that membrane RI values can be estimated from composition studies.23 Further studies of RI are needed for more types of tissues carried with pathological indication and composition information, which may enable more accurate diagnosis and earlier disease detection. 4.ConclusionIn conclusion, we proposed a new model based on EDTRM for accurately extracting the RI of animal tissue samples. In the simulation sample study, the theoretical results calculated by the new model show good agreement with the measured reflectance data. This work also aims to emphasize the unavoidable influence of tissue fluid on the RI measurement of animal tissue. At the prism-tissue interface, part of the contacting area is filled with tissue fluid and part is muscle tissue. Misleading results calculated using the dual-parameter fitting method and EDTRM can be attributable to neglecting the tissue fluid. The amount of tissue fluid leads to the amplitude change of the first peak of the derivative curve and the RI of animal tissue can still be measured. The new model also provides a means for novel biological sensing in the biomedical field and identification of the constituents of mixture in the industry. AcknowledgmentsThis research is supported by the Chinese National Key Basic Research Special Fund (Grant No. 2011CB922003), Fundamental Research Funds for the Central Universities (Grant No. 65010931), Science and Technology Program of Tianjin (Grant Nos. 11ZCKFSY00500 and 10ZCGHHZ01100), Basic Research and Advanced Technology Program of Tianjin (Grant No. 11JCZDJC16800), and the Natural Science Foundation of Zhejiang (Grant No. Y1100088). ReferencesH. Dehghaniet al.,
“The effects of internal refractive index variation in near-infrared optical tomography: a finite element modelling approach,”
Phys. Med. Biol., 48
(16), 2713
–2727
(2003). http://dx.doi.org/10.1088/0031-9155/48/16/310 PHMBA7 0031-9155 Google Scholar
D. Y. ChurmakovI. V. MeglinskiD. A. Greenhalgh,
“Amending of fluorescence sensor signal localization in human skin by matching of the refractive index,”
J. Biomed. Opt., 9
(2), 339
–346
(2004). http://dx.doi.org/10.1117/1.1645796 JBOPFO 1083-3668 Google Scholar
W. M. StarJ. P. A. Marijnissen,
“Calculating the response of isotropic light dosimetry probes as a function of the tissue refractive index,”
Appl. Opt., 28
(12), 2288
–2291
(1989). http://dx.doi.org/10.1364/AO.28.002288 APOPAI 0003-6935 Google Scholar
Y. Domankevitzet al.,
“Selective delivery of laser energy to biological tissue based on refractive-index differences,”
Opt. Lett., 25
(15), 1104
–1106
(2000). http://dx.doi.org/10.1364/OL.25.001104 OPLEDP 0146-9592 Google Scholar
M. A. BartlettH. Jiang,
“Effect of refractive index on the measurement of optical properties in turbid media,”
Appl. Opt., 40
(10), 1735
–1741
(2001). http://dx.doi.org/10.1364/AO.40.001735 APOPAI 0003-6935 Google Scholar
J. TualleE. Tinet,
“Derivation of the radiative transfer equation for scattering media with a spatially varying refractive index,”
Opt. Commun., 228 33
–38
(2003). http://dx.doi.org/10.1016/j.optcom.2003.09.076 OPCOB8 0030-4018 Google Scholar
F. Bolinet al.,
“Refractive index of some mammalian tissues using a fiber optic cladding method,”
Appl. Opt., 28
(12), 2297
–2303
(1989). http://dx.doi.org/10.1364/AO.28.002297 APOPAI 0003-6935 Google Scholar
Q. W. Songet al.,
“Modified critical angle method for measuring the refractive index of bio-optical materials and its application to bacteriorhodopsin,”
J. Opt. Soc. Am. B, 12
(5), 797
–803
(1995). http://dx.doi.org/10.1364/JOSAB.12.000797 JOBPDE 0740-3224 Google Scholar
H. LiS. S. Xie,
“Measurement method of the refractive index of biotissue by total internal reflection,”
Appl. Opt., 35
(10), 1793
–1795
(1996). http://dx.doi.org/10.1364/AO.35.001793 APOPAI 0003-6935 Google Scholar
J. Laiet al.,
“Experimental measurement of the refractive index of biological tissues by total internal reflection,”
Appl. Opt., 44
(10), 1845
–1849
(2005). http://dx.doi.org/10.1364/AO.44.001845 APOPAI 0003-6935 Google Scholar
P. SunY. Wang,
“Measurements of optical parameters of phantom solution and bulk animal tissues in vitro at 650 nm,”
Opt. Laser Technol., 42
(1), 1
–7
(2010). http://dx.doi.org/10.1016/j.optlastec.2009.06.001 OLTCAS 0030-3992 Google Scholar
H. F. Dinget al.,
“Refractive indices of human skin tissues at eight wavelengths and estimated dispersion relations between 300 and 1600 nm,”
Phys. Med. Biol., 51
(6), 1479
–1489
(2006). http://dx.doi.org/10.1088/0031-9155/51/6/008 PHMBA7 0031-9155 Google Scholar
Q. Yeet al.,
“Measurement of the complex refractive index of tissue-mimicking phantoms and biotissue by extended differential total reflection method,”
J. Biomed. Opt., 16
(9), 097001
(2011). http://dx.doi.org/10.1117/1.3615657 JBOPFO 1083-3668 Google Scholar
E. K. Chanet al.,
“Effects of compression on soft tissue optical properties,”
IEEE J. Sel. Topics Quantum Electron., 2
(4), 943
–950
(1996). http://dx.doi.org/10.1109/2944.577320 1077-260X Google Scholar
M. BornE. Wolf, Principles of Optics, Pergamon, New York
(1959). Google Scholar
S. Chenget al.,
“Measurement of the refractive index of biotissue at four laser wavelengths,”
Proc. SPIE, 4916 172
–176
(2002). http://dx.doi.org/10.1117/12.482969 PSISDG 0277-786X Google Scholar
A. M. Zysket al.,
“Needle-based refractive index measurement using low-coherence interferometry,”
Opt. Lett., 32
(4), 385
–387
(2007). http://dx.doi.org/10.1364/OL.32.000385 OPLEDP 0146-9592 Google Scholar
M. Kohlet al.,
“Influence of glucose concentration on light scattering in tissue-simulating phantoms,”
Opt. Lett., 19
(24), 2170
–2172
(1994). http://dx.doi.org/10.1364/OL.19.002170 OPLEDP 0146-9592 Google Scholar
J. Beuthanet al.,
“The spatial variation of the refractive index in biological cells,”
Phys. Med. Biol., 41
(3), 369
–382
(1996). http://dx.doi.org/10.1088/0031-9155/41/3/002 PHMBA7 0031-9155 Google Scholar
D. Axelrod,
“Cell substrate contacts illuminated by total internal reflection fluorescence,”
J. Cell. Biol., 89
(1), 141
–145
(1981). http://dx.doi.org/10.1083/jcb.89.1.141 JCLBA3 0021-9525 Google Scholar
J. Chaikenet al.,
“Instrument for near infrared emission spectroscopic probing of human fingertips in vivo,”
Rev. Sci. Instrum., 81
(3), 034301
(2010). http://dx.doi.org/10.1063/1.3314290 RSINAK 0034-6748 Google Scholar
Z. Wanget al.,
“Tissue refractive index as marker of disease,”
J. Biomed. Opt., 16
(11), 116017
(2011). http://dx.doi.org/10.1117/1.3656732 JBOPFO 1083-3668 Google Scholar
R. A. Meyer,
“Light scattering from biological cells: dependence of backscatter radiation on membrane thickness and refractive index,”
Appl. Opt., 18
(5), 585
–588
(1979). http://dx.doi.org/10.1364/AO.18.000585 APOPAI 0003-6935 Google Scholar
|
||||||||||||||||||||||||||||||||||||||||||||||||||||||||||||||||||||||||||||||||||||||||||||||||||||

