
|
|
1.IntroductionDental erosion is defined as the loss of dental tissue due to chemical dissolution by acids typically originating from acid beverages or gastric acid and is steadily on the rise with highest prevalence in young children.1 In pediatric dentistry, 6% to 50% of children aged 2 to 5 years exhibit enamel erosion.2 The initial stages of erosion are characterized by surface enamel dissolution leading to softening of the enamel. At this early stage, natural repair of enamel by minerals in the saliva is possible. However, if left untreated, the demineralization of the enamel from the acid leads to complete removal of the enamel eventually exposing the underlying dentin. Current clinical detection of erosion is based on visual inspection, such as broad concavities within smooth surfaces of enamel, cupping of occlusal surfaces with dentin exposure, raised dentin restorations, and loss of surface characteristics of enamel, particularly in young children.3 By the time many of these features are clinically evident, such as dentin exposure, natural repair is no longer possible and requires surgical intervention. To address this serious pediatric health issue, various other methods have been proposed to evaluate the loss of dental enamel tissue by erosion.4 Current techniques are generally based on observation of mineral content or surface analysis.4,5 Microradiography can be used to detect later stage erosion, but it is not well suited to clinical use due its ionizing nature and long exposure times.6,7 Optical coherence tomography (OCT) has been investigated and has potential for clinical quantification of erosion.8 However, the cost for such devices and clinician’s difficulty in interpretation of the images prevents wide-scale integration of OCT technologies into the clinic. Quantitative light fluorescence (QLF) is an imaging technique to assess differences in intensities of endogenous fluorescence between demineralized and healthy enamel.9 Although this technique has been investigated extensively in caries detection, its usefulness in detecting early stage erosions has not been established.10 Near-infrared (NIR) imaging offers deep penetration into the dental tissue due to low enamel scattering and absorption coefficients.11–13 Although still in the research stage, this technology has potential to supplement -ray microradiography due to its deep penetration depth.14 A new laser-based ultrathin scanning fiber endoscope (SFE) technology15 developed for cancer diagnosis16 was used in this study for acquiring dental images. The thin and flexible endoscope offers advantages in its multi-modal capabilities. These include RGB color, near-UV, and laser-induced fluorescence (LIF) imaging. In addition, the SFE offers a threadlike form-factor that is ideal for pediatric clinical applications. The rugged mechanical construction includes a tough plastic sheath covering the Kevlar-reinforced tether. In this in vitro study, we demonstrate that a short-wavelength 405-nm illumination laser using the SFE is optimal for imaging the intricate surface topography of occlusal surfaces. We also found that the 405-nm illumination laser produced good contrast images of artificial shallow erosions of less than 80 µm in depth located near the enamel surface. Four different laser illumination wavelengths (405, 444, 532, and 635 nm) were evaluated in the present study. Reflected light images were also compared with 405-nm laser induced autofluorescence (AF) of dental enamel. Erosions of varying severity were created and erosion surface and depth were characterized by polarized transmission light microscopy, scanning electron microscopy (SEM) and dye-enhanced optical microscopy. 2.Materials/MethodsFigure 1 is a flow chart of the experimental study. Extracted teeth were cleaned and occlusal surfaces imaged with the SFE. From the extracted teeth, one group of smooth surface erosions and one group of occlusal surface erosions were created. The erosions were then imaged using the SFE with various laser wavelengths. The contrast was then computed between the eroded and sound enamel. Additionally, SEM and light microscopy were performed to characterize the artificial lesions. Further detail on each step is described below. Fig. 1Flow chart of the experiment. 40 extracted teeth were used. Out of the 40 teeth, 20 teeth were used to make smooth surface erosions of varying severity, and the remaining 20 were used to make occlusal surface erosions. The SFE was used to image all teeth with four different laser wavelengths. Contrast between sound and eroded enamel was then measured from the images. The artificially induced erosions were also characterized via SEM and optical microscopy. 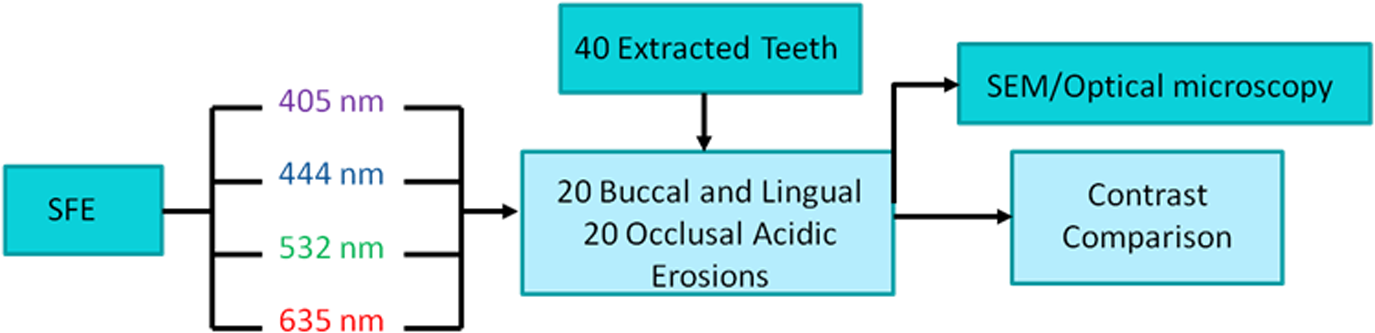 2.1.Specimen PreparationThe Institutional Review Board approved study used human extracted premolars and molars (). Absence of natural lesions was confirmed by using visual inspection as well as the QLF dental diagnostic tool (Inspektor Research Systems, Netherlands).17 After the surfaces were gently cleaned by toothbrush and fixed using formalin (10% neutral pH formalin, Sigma-Aldrich, St. Louis, MO), the specimens were then stored in a 0.1% thymol (Sigma-Aldrich, St. Louis, MO) solution at room temperature. In preparation for inducing artificial erosions, each fixed tooth was removed from the 0.1% thymol solution and rinsed with deionized water and lightly dried with absorbing paper towelettes (Kimberly-Clark Corp., Irving, TX). Then acid resistant varnish (Revlon Inc., New York, NY) was applied over each tooth while leaving a small window (approximately ) of exposed enamel on the lingual, buccal, or occlusal side. The prepared specimens were then placed in a custom made circulating acid bath container. Twenty smooth surface and twenty occlusal surface windows were created. Prepared specimens were placed in a plastic container and submerged in an acetic acid solution of pH 3. A rotating stir bar (600 rotations per min) was used to minimize areas of stagnant solution around the exposed enamel. Submersion times of 1, 2, 4, and 6 h were used to create erosions of varying severity. After the specimens were removed from the acid solution, deionized water was used to remove the remaining acid. Then acetone was applied onto a cotton swab, which was then used to remove the varnish. Table 1 lists the details of the specimen samples used in the study. Table 1Study sample size.
2.2.SFE Imaging PlatformThe SFE developed in our laboratory was used to capture live video, high-quality images with wide field-of-view (FOV) by actively scanning laser light instead of the conventional passive imaging from diffuse light illumination.15 Red (635 nm), green (532 nm), blue (444 nm), or violet (405 nm) laser light can be selectively launched at the proximal end of the SFE and transmitted to the distal end using a single-mode optical fiber. The laser delivery fiber is scanned in an expanding circular pattern (up to 100-deg FOV) at the distal tip of the probe by a piezoelectric actuator, which is sealed with a lens assembly. Diffuse reflected light from the target area is collected by a concentric ring of stationary multimode fibers around the central scanning fiber. The light from the collection fibers is focused onto two color-separating (dichroic) beam splitters and directed at three photomultiplier tubes (PMT). Specialized software maps the synchronized PMT signals and the instantaneous location of the spiral scanning fiber to produce a two-dimensional (2-D) image. Specular reflections in the image are evidenced by bright spots; however, by virtue of the configuration of the single, narrow beam illumination fiber and ring of collecting fibers there are relatively few spatial points meeting the specular criteria of equal angles of incidence and reflection. Hence the SFE operates without the need for crossed polarizers that reduce light collection efficiency. By utilizing this coaxial design of a single moving optical fiber with a ring of stationary collection fibers to produce 2-D images, an ultrathin endoscope can be fabricated. For this study, a 1.2-mm diameter SFE probe was used. Table 2 summarizes the key characteristics of the SFE system. Table 2List of key features of the SFE.
Violet and blue wavelengths were isolated by a short wavelength (460 nm) dichroic beamsplitter. The green channel consisted of light transmitted through the blue channel filter and reflected by a green (550 nm) dichroic beamsplitter. Finally, the red channel consisted of light transmitted through the green beamsplitter.16 Reflected light from the 405 and 444 nm illuminating lasers were collected in the blue channel and reflected 532-nm light and 405 nm AF light were collected in the green channel. The peak of 405-nm AF is centered around 480 nm.18 Finally, 635-nm backscattered light was collected in the red channel. 2.3.Imaging of Surface ErosionsWavelength dependent imaging was performed on each specimen using the SFE. The specimens were securely mounted in dental wax, and the SFE probe held in a stable position using a mounting fixture so that the field of view and sample position remained constant for all images taken (Fig. 2). This procedure removed any complications from mechanical movement. Specimens were air dried for 5 min prior to imaging to emulate clinical conditions. 2.4.Beam Spot Size Compensation/Post ProcessingTo rule out differences between the SFE images due to focused laser beam size, the beam diameter for 405, 444, 532, and 635 nm illumination were measured using a scanning slit optical beam profiler (BP10x-VIS Beam Quality Analysis System, Thorlabs, Newton, NJ). The beam diameter for each laser wavelength was recorded at a distance of 5 mm from the probe tip, which was the working distance used in this study. For each wavelength, five measurements were recorded and averaged to improve the signal-to-noise ratio. After determining the beam diameters with the profiler, the SFE system resolution was measured with a resolution test target (Chrome-on-glass 1951 United States Air Force, Edmund Optics, Barrington, NJ). The SFE was placed 5 mm from the target in all cases. After acquiring the resolution chart images, the modulation transfer function was calculated according to . Intensity is the 8-bit pixel value of a slice through the test target image. To eliminate visual color bias in evaluating image resolution, all images were converted to 8-bit grayscale. Contrast and MTF were computed from these converted grayscale images. No image sharpening algorithms were used. 2.5.Analysis of Erosion ContrastAnalysis of erosion contrast was performed by taking a cross-section on the intensity of the image. Since images for a specimen at each wavelength were recorded at the same orientation, the cross-section through each image represents the same physical location. To reduce noise, 11-pixel averaging was performed on the width dimension of the cross-section line. The SFE image contrast was computed from the sound enamel and enamel containing the surface erosion according to the Weber metric: where is the reflected intensity of the erosion, is the reflected intensity of the sound enamel, and is the contrast.19 The Weber contrast metric is often used when the image background is relatively homogenous, such as the reflections from sound enamel, and is used throughout this study.2.6.Enamel Erosion Light ScatteringLight reflected from the tooth is a result of both surface and volume scattering. A rough surface will produce strong scattering from the front surface while a porous subsurface that contains enamel crystal fragments will result in a large contribution from scattering within the bulk.20,21 Isotropic (Rayleigh) backscattering will result if the pores or the crystal fragments have dimensions smaller than the illumination wavelength. To distinguish between surface and volume scattering, an enamel index matched fluid (Series B , Cargille Laboratories, NJ), glycerol (UltraPure Glycerol, Invitrogen, NY, USA), optical gel (, Nye Lubricants, MA), as well as a transparent viscoelastic pressure sensitive adhesive (Scotch Gloss Finish Transparent Tape, 3M, MN) was applied to the front surface of the enamel to minimize diffuse reflection contributions from the erosion front surface roughness. 2.7.Characterizing ErosionsHealthy tooth enamel has a surface layer of aprismatic hydroxyl apatite, which is commonly referred to as the protective amorphous surface layer. During initial acid challenge, the protective surface layer is not completely removed. Rather, micro-sized pores are formed that allow acid to penetrate below the surface layer and attack the subsurface enamel, while also increasing the outer surface roughness. Additionally, the subsurface prisms are demineralized into soluble chemical species and insoluble nanoscale fragments leaving a honeycombed pattern, with areas devoid of mineral in the core of each prism.20–23 Therefore, the acid attacks both the surface layer as well as the structured hydroxyl apatite located below the surface.23 To confirm that etched specimens follow this expected pattern of demineralization, surfaces of erosions were imaged using a SEM operating in secondary electron mode. For every exposure time, one tooth was selected at random to be SEM imaged. Some of the specimens were also critical-point dried (SPI # 13200-AB Manual CPD, Structure Probe Inc., PA) prior to SEM imaging. The enamel surfaces were sputter coated with gold/lead to improve electrical conductance. Examinations were carried out at 5 kV on a FEI Sirion SEM (FEI, Hillsboro, Oregon). To determine erosion depth, one specimen chosen randomly for each exposure time (1, 2, 4, and 6 h) was longitudinally fractured through the demineralized region. The fractured specimens were then submersed in a black absorbent dye (Phoenix Brands, LLC, CT) overnight. Demineralized enamel become porous and thus allowed infiltration of the dye while sound enamel blocked dye penetration. After removing the specimen from the dye solution, it was then placed in epoxy (EpoxySet, Allied High Tech Products Inc., CA). The fractured surface was polished starting with a 400-grit polishing disc moving up to a 1-µm diamond slurry until the surface was mostly free of scratches when viewed under a microscope. Light microscopy and erosion depth were measured on an Olympus BX51 optical microscope (Olympus Corp., PA). Additionally, one specimen chosen randomly for each exposure time was used to cut 250-μm sections with a microtome saw (Leica SP1600, Leica Microsystems Inc., IL). The sectioned erosion samples were then imaged with a polarized transmission microscope (Olympus BX51, Olympus Corp., PA) to confirm the dye depth measurements.17,24 2.8.Monte Carlo SimulationsIn addition to the experimental portion of the study, a Monte Carlo (MC) model of photon transport in multi-layered tissues (MCML)25,26 has been adapted to light scattering in dental tissue and used in this study.27,28 The model describes the local rules of light propagation expressed as stochastic functions of the deflection in a photon’s trajectory when a scattering event occurs. A modified Henyey-Greenstein phase function was applied to describe a photon’s angle of deflection after each scattering event: where is the fraction of isotropic scatterers, is the scattering anisotropy, and is the scattering angle. When the angle of deflection is small (), scattering is mainly determined by , while larger angles are primarily governed by .27,28 Following Fried et al.27 and Darling et al.28, was set to 0.35 (for 635 nm) or 0.6 (for 532 and 405 nm) for sound enamel and 0.1 (for 532 and 405 nm) for artificially demineralized enamel and was set constant to 0.5. The input parameters for the MC simulations are listed in Table 3.Table 3Input parameters used in the MCML simulations.
When enamel becomes demineralized, it has been reported that the scattering coefficient increases by at least a factor of 10.29,30 In our two-layer simulation, the outermost layer is immersed in air and represents demineralized enamel and thus is assigned a large scattering coefficient (). The layer below the demineralized zone is the sound enamel and is assigned a much smaller value of the scattering coefficient . The values for sound enamel at 532 and 635 nm were taken directly from Fried et al.27 immersed thin enamel sections in an index matching fluid (carbon disulfide) and measured the angular dependence of light scattering. The for sound enamel at 405 nm was taken from experimental measurements of scattering coefficients at 405 nm by Spitzer and Ten Bosh.31 In demineralized enamel, Spitzer and Ten Bosch32 computed experimentally the scattering coefficient changes by a factor of nearly 10 from sound enamel at 340 nm, although they report standard errors of 40%. It is likely that the range for increased demineralized enamel scattering at 405 nm is 5 to 10 times that of normal enamel scattering. The scattering coefficients used in the present simulations were for sound enamel and both 2640 and for demineralized enamel at 405 nm. The MC simulations were performed with photons directed perpendicular to the surface of the top layer. The refractive indices in the demineralized and sound tissue were taken to be 1.6.33 3.Results3.1.Image ResolutionThe measured focused laser beam diameters are shown in Table 4. In agreement with the Rayleigh criterion, the focused beam size decreased as the laser wavelength decreased. However, in the case of the 405-nm laser the beam size was slightly larger than the 444-nm laser, and we believe that there was some multimoding of the laser in the single-mode optical fiber, (420-nm cutoff wavelength, StockerYale, Salem, NH). Table 4Laser beam diameters measured 5 mm from the probe tip.
In order to compare the image quality between the violet and the red laser wavelengths, the 405-nm image was intentionally blurred using a Gaussian smoothing filter of 7 by 7 pixels, corresponding to 66 by 66 µm in MATLAB (The Mathworks, Inc., MA), so that the effective spot size became nearly equal between the two images. In this way, it was possible to rule out the effect of illumination spot size on the image resolution. Therefore, any differences observed between red and violet images are attributed to the wavelength-dependent interaction between the laser and the tooth specimen. Displayed images below are spot size compensated. Shown in Fig. 3 is a comparison of grayscale images taken of the occlusal surface of two extracted teeth with red (635 nm) and violet (405 nm) laser illumination. Feature details such as pitting of the walls and fissure are clearly evident in the violet illuminated image, whereas the red illuminated image is relatively blurry and such features are difficult to discern. More degrees of hypomineralization or demineralization can be seen in the 405-nm image, whereas only the gross presence of demineralization can be seen in the 635-nm image [3(a) and 3(c)]. The intricate and convoluted topography of the occlusal surface is clearly evident in the violet images [3(b) and 3(d)]. Fig. 3SFE images of the occlusal surface of a tooth illuminated with (a) 635-nm and (b) 405-nm lasers. SFE images of the occlusal surface of another tooth illuminated with (c) 635-nm and (d) 405-nm lasers. Enhanced topography details are evident in the 405-nm images. Pitting can be also seen in the violet illuminated images. 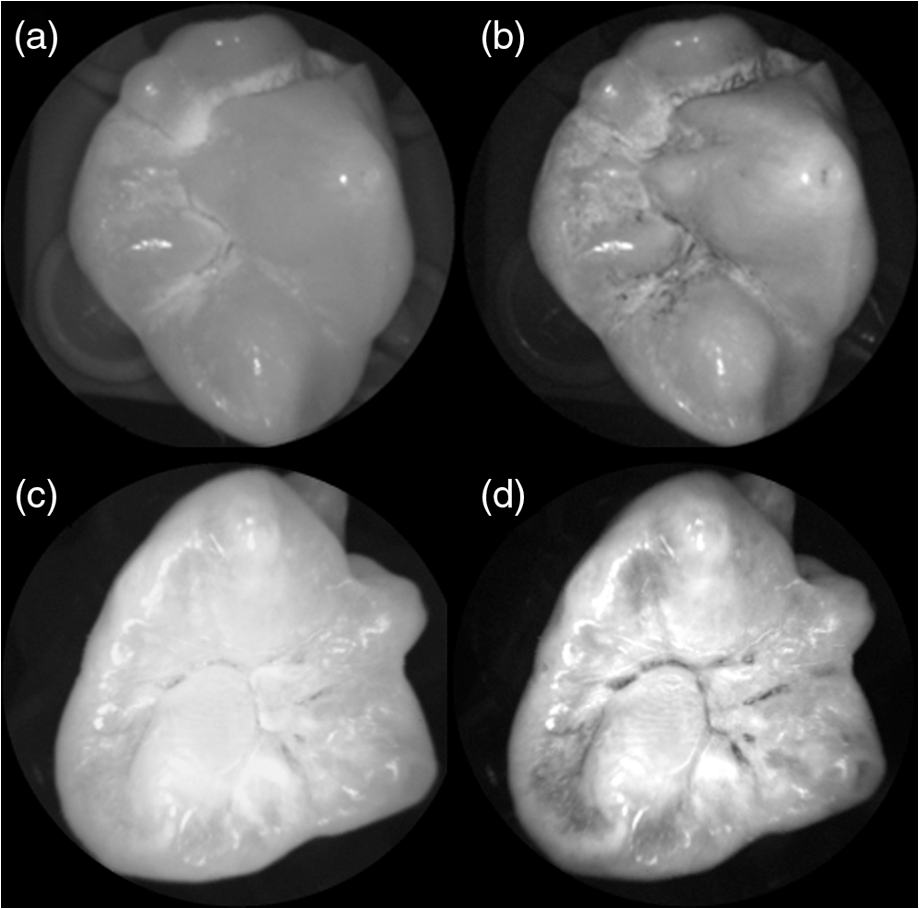 3.2.Artificial Enamel ErosionsShown in Fig. 4 is a comparison of 405-nm illumination images taken of four different occlusal specimens each submerged for a different amount of time in the acid solution. Since sound enamel is a low scattering material while demineralized enamel is highly scattering, the erosion appears brighter than sound enamel in the images due to its strong backscattering.34 It is important to note that not all teeth originated from the same patient and thus there is a possibility of inter-specimen variability in acid resistance. However, it is evident that the artificial erosion is visible for all exposure times, with overall increasing erosion/sound enamel contrast for longer submersion times. Fig. 4405-nm reflected images of occlusal erosions produced by submersion in acetic acid solution of pH 3 for (a) 6 h, (b) 4 h, (c) 2 h, and (d) 1 h. Black arrows indicates sound enamel, while white solid arrows indicates eroded enamel. 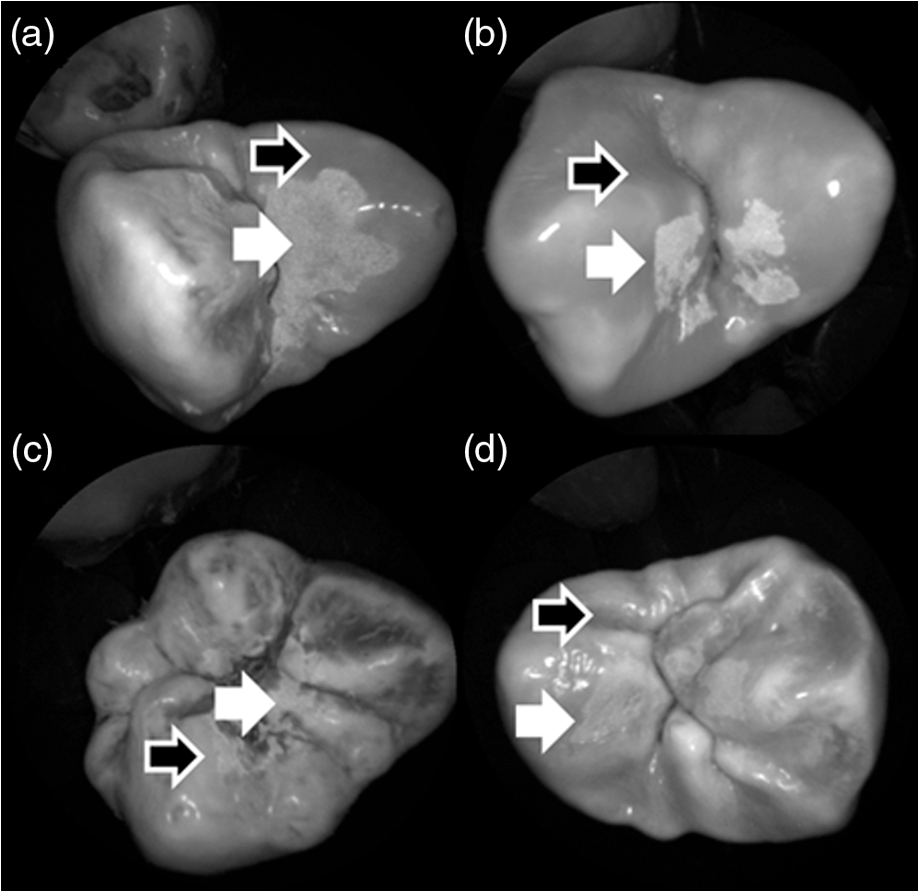 Figure 5 shows that the 405-nm reflected images of smooth surface erosions exhibited the highest contrast compared to 405 AF, red, green, and blue (635, 532, and 444 nm) reflected images for all exposure times. At 1 h exposure, the contrast value for the violet image was 0.3 while red, green, and blue were all below 0.1 and AF was less than 0.01. Once the exposure time was increased to 4 or 6 h, AF images provided the higher contrast than reg, green, and blue, although violet-reflected images still performed the best with a contrast value of 0.59 at 6 h of acid exposure. Among the RGB colors, blue exhibited the highest contrast and red exhibited the lowest for all exposure times. Fig. 5Contrast between smooth surface erosion and sound enamel for various illuminating wavelengths and acid exposure times. Top left: 6 h, pH 3 exposure. Top right: 4 h, pH 3 exposure. Bottom left: 2 h, pH 3. Bottom right: 1 h, pH 3. For all four panes: (a) 405-nm reflected image; (b) 444-nm reflected image; (c) 532-nm reflected image; (d) 635-nm reflected image, and (e) 405-nm illuminated AF image. Mean and standard deviation of measured contrast for each imaging modality are shown in the plots. Blue line in each image indicates location where contrast was measured.  3.3.Enamel Erosion ScatteringFigure 6 shows that the 405-nm reflected images with index matched fluid and glycerol applied to the entire tooth enamel surface exhibited much lower contrast between erosion and sound enamel. In some cases, after application of the fluid, the reflected light from the erosion became lower than that of the sound enamel. This effect is seen prominently in 6(b) and 6(d). This reversal was seen with the index-matched fluid, glycerol as well as the optical gel. Fig. 6405-nm backscattered image of four hour eroded specimens (a) before and (b) after application of index matching fluid (top) and glycerol (bottom). After application, a reversal in contrast is seen between the eroded and sound enamel.  The time dependency for this reversal is shown in Fig. 7 in the case of the optical gel. The reflected-light image of the eroded enamel is brighter than the surrounding sound enamel prior to application of optical gel. After application, the low-viscosity gel filled up the voids in the eroded subsurface enamel over the course of 2 min. Eventually, the optical scattering of the index matched eroded enamel becomes less than that of the index matched sound enamel. However, application of a transparent viscoelastic pressure sensitive adhesive did not show this reversal of intensities, as seen in Fig. 8. A small decrease in contrast was measured after application of the adhesive. The contrast value decreased from 0.6 to 0.45 for the images shown in Fig. 8(a) and 8(b), and a reduction in contrast value from 0.42 to 0.32 was observed in Fig. 8(c) and 8(d). Figure 9 further demonstrates the effectiveness of the viscoelastic adhesive in removing optical scattering from a roughened surface. The viscoelastic adhesive wetted out the surface irregularities of the sandblasted glass, thus minimizing surface scattering. Fig. 7Time sequence of a 6 h eroded specimen with application of optical gel taken at (a) 0 s, (b) 5 s, (c) 15 s, (d) 30 s, (e) 1 min, and (f) 2 min using 405-nm illumination. A reversal of intensity between the eroded region and sound enamel occurs over this time span as the optical gel penetrates into the porous subsurface enamel within the erosion.  Fig. 8405-nm images of (top) a 6 h specimen (a) prior to application of transparent viscoelastic pressure sensitive adhesive, and (b) after application of adhesive. The measured contrast for this specimen is 0.6 prior and 0.45 after application of adhesive. 405-nm images of (bottom) a 4 h occlusal specimen (c) prior to application of sensitive adhesive, and (d) after application of adhesive. The measured contrast for this specimen is 0.42 prior and 0.32 after application of adhesive. The white boxes in (b) and (d) represent the region where the adhesive was applied. No reversal in contrast between eroded and sound enamel is seen, indicating that the adhesive did not fill subsurface voids.  Fig. 9405-nm image taken of sandblasted glass placed over a test target. The roughened surface scatters the 405-nm light, and thus the target is not visible through the sandblasted glass. However, the textured surface was wetted out after application of the transparent viscoelastic pressure sensitive adhesive, and thus the target became visible through the glass.  3.4.Enamel Erosion CharacterizationSurface SEM of the artificial enamel erosions show an increase in porosity in the exposed enamel as the acid exposure time was increased. The structureless surface layer in Fig. 10 conceals the underlying structured enamel prisms and crystallites. However, after removal of the surface layer using critical point drying, as shown in Fig. 11, demineralization of the prism cores is evident. This shows that the etched specimens used in this study follow the expected pattern of demineralization.22,23 Fig. 10SEM of a specimen after acetic acid demineralization at pH 3 for 2 h. (a) Zoomed-out view of erosion (center of image) and sound enamel above and below. Scale bar is 500 μm.(b) Zoomed-in view of center of erosion. Porous structure of the erosion is clearly evident. Scale bar is 1 μm. (c) Zoomed-in view of the sound enamel. Compared to the demineralized region, the sound enamel is less rough and lacks pores. Scale bar is 1 μm. 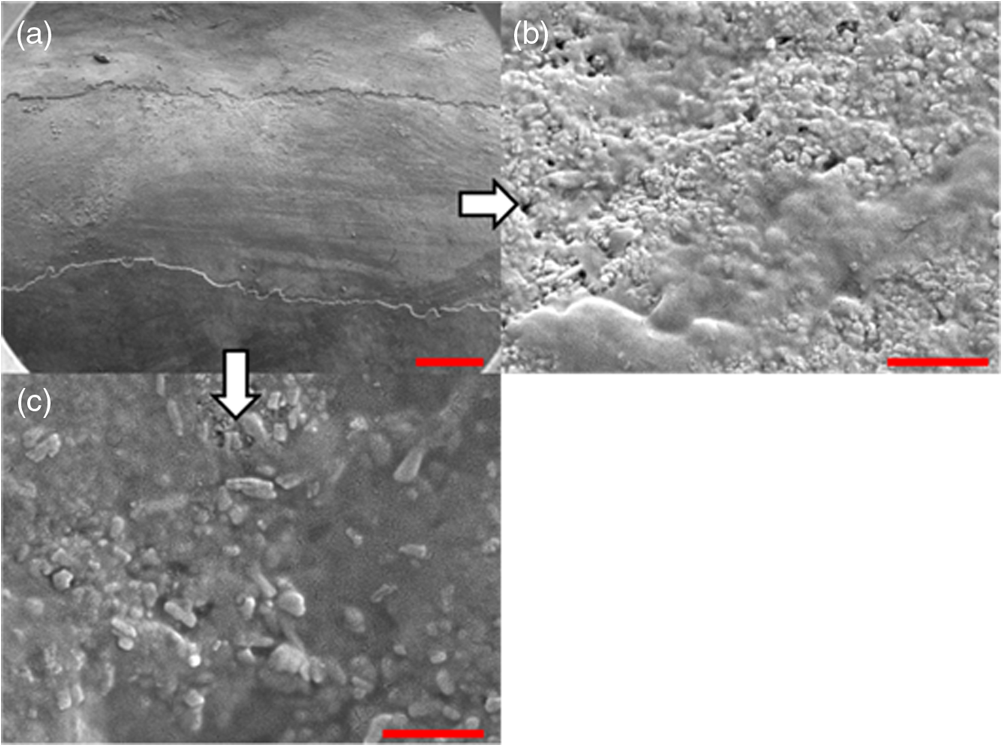 Fig. 11SEM of a tooth after acetic acid demineralization at pH 3 for 4 h. A critical point drying technique was used to remove the surface layer without mechanical abrasion. (a) Enamel prisms are seen after removal of enamel surface layer. The lower right corner of (a) shows a portion of intact surface layer still present, while the central portion of the image shows the subsurface enamel. Scale bar is 50 μm. (b) Zoomed-in view of exposed enamel subsurface. Scale bar is 5 μm. Demineralization of the subsurface enamel is evidenced by the voids in the enamel prism cores.  Dye-enhanced microscopy yielded results similar to those of polarized transmission microscopy. Thus, the black dye staining technique allows for a relatively rapid and simple method to determine depths of artificial erosions (Fig. 12). As dye penetrated into the demineralized channels, the erosion became clearly evident. The mean depth for each erosion is shown in Table 5. As exposure times increased, erosion depth also increased. In this way, it was possible to create erosions of varying severity. Fig. 12(a) Cross section of a 4 h eroded tooth viewed from the fractured and polished side using dye stained microscopy. Dye penetration into the demineralized channels allows for visualization of the erosion depth. The dark region to right of the arrow is a void between the epoxy and enamel. An erosion of approximately 39 μm is shown. (b) Polarized transmission microscopy of a 6 h eroded tooth from a 250-μm-thickness slice. An erosion of approximately 53 μm is shown. The outer surfaces of the teeth are indicated by the arrows.  Table 5Mean depth of erosions for various demineralization times as measured using dye enhanced microscopy and polarized microscopy.
3.5.Monte Carlo ModelingMC simulations were performed to model the interaction of the illuminating wavelengths with translucent enamel tissue. As stated earlier, the values of and were taken from angular resolved scattering measurements where the enamel specimens were immersed in carbon disulfide.27 The present work used air-dried samples and therefore some differences in scattering behavior are expected. Briefly, the simulations showed that the large scattering coefficient at 405 nm yields a very shallow optical penetration depth, whereas 635 nm exhibited much deeper optical penetration. In sound enamel, Fig. 13 shows that the photon flux drops by a factor of 30 at a depth of 500 μm for 405-nm illumination, while a comparable attenuation for 635-nm illumination occurs at nearly the depth (1200 μm). Fig. 13Flux of illuminating light into enamel tissue. (a) 405-nm photons are strongly scattered and thus do not penetrate deeply into enamel ( axis). At 500 μm, flux drops by a factor of 30. (b) 635-nm photons are not strongly scattered and therefore exhibits a highly ballistic trajectory. Only after 1200 μm does the 635-nm flux drop by a factor of 30.  Artificial lesions exhibit approximately a larger scattering coefficient at 1300 nm compared with healthy enamel.28 Therefore, it is anticipated that 405-nm illumination will penetrate less in demineralized enamel than in sound enamel. Figure 14 shows a comparison of light transport in sound and demineralized enamel. In sound enamel, the photon flux drops by a factor of 30 at a depth of 500 μm for 405 nm illumination, while a comparable attenuation for 405-nm illumination in demineralized enamel occurs at 200 μm. Fig. 14Photon flux for 405-nm wavelength in (a) sound enamel and (b) demineralized enamel. Scattering coefficient used in (a) was and in (b) was .  Using the MC two-layer model, the image contrast for demineralized enamel of increasing depths were calculated for violet and green illumination. The scattering coefficients () and isotropic fractions () used in the simulations are given in Table 2. The values for both wavelengths were taken from Fried et al.27 for sound enamel () at 543 nm. Since the only measured value (0.1) of for artificially demineralized enamel was determined at 1310 nm, the same value was used in the model.28 Figure 15 shows that the contrast between sound and demineralized enamel is higher for violet at both 10 and increased scattering from sound to demineralized enamel to green illumination for lesions shallower than 50 μm in depth.As lesion depth continues to increase, 405-nm contrast plateaus. A crossover of contrast is seen between 532 and 405 nm at around 70 µm. However, this crossover in the contrast between violet and green illumination was not observed experimentally and may occur at larger depths. Fig. 15Demineralized enamel contrast of varying depths. MC simulations showed that illumination using 405 nm with as well as increased scattering from sound to demineralized enamel provided higher contrast than 532 nm for shallow lesions. As demineralized enamel depth increased, the 405-nm curve flattened out more rapidly than the 532-nm curve. Additionally, a crossing in contrast was seen between 532 and 405 nm ( increased scattering) at approximately 70 μm.  4.DiscussionBecause the SFE projects a beam of focused laser light and collects returned light without a focusing lens, its imaging characteristic differs from that of a conventional imaging camera. The main factors that determine the clarity of SFE enamel surface images are the penetration depth of the illumination laser into the enamel and the scattering properties within the enamel. The improved image quality observed at 405 nm compared with longer wavelengths is attributed to the relatively shallow penetration depth of the light source and concomitant reduced contribution to the collected radiation from backscattered light originating at greater depths in the enamel. The shallow penetration depth at shorter wavelength is the result of the strong wavelength dependence () of the scattering coefficient.28,35 Hence the reflected light collected from a short wavelength laser is not contaminated by the backscatter of light emanating from enamel tissue at greater depths. The backscattering from larger depths at longer visible wavelengths, e.g., 635 nm, is integrated and produces a composite image that diminishes the resolution of surface details. Tooth stains have been an issue with many of the reported optical imaging techniques, although it is a lesser concern using NIR techniques.13 Since visible light absorption is larger in the stain than in healthy enamel, interference from stains can confound AF and visible light-imaging results. However, this is typically not an issue in a pediatric patient since little staining is found in children’s teeth.36 As such, the 405-nm reflected light modality applied to pediatric dentistry provides high resolution images with minor impact from stain interference in the pediatric population. As observed experimentally and confirmed by MC simulations, violet illumination exhibited the greatest contrast between sound and demineralized enamel (Fig. 15). However, the MC calculations predicted that, as lesion depth increases beyond 70 µm, 405-nm contrast will plateau earlier than 532-nm illumination. This is due to the inherently large scattering coefficient and thus shallow penetration depth of 405-nm radiation. Therefore, image contrast for violet illumination plateaus when erosion depth increases beyond the effective penetration depth of the violet light, and thus the scattering contribution from deep within the demineralized enamel is minimal. This plateau may be an issue in longitudinal studies of lesion progression, and therefore a dual-wavelength contrast measurement may be necessary. On the other hand, 405-nm illumination may be ideal for early stage detection of shallow erosions, white spots, and early stage caries. The shallow penetrating 405-nm light strongly scatters in the presence of nano-sized pores and fractured demineralized enamel in the shallow subsurface, thereby increasing contrast between sound and early stage eroded enamel. As exposure time to acid increases, surface roughness as well as demineralization depth increases.23,37,38 One or both of these factors could be contributing to the increased contrast seen in the 405-nm reflection images. This problem of discriminating between surface and volume scattering cannot generally be solved by submerging samples in an index-matched bath. Low- to medium-viscosity index matching fluids and gels are not suitable for discriminating against the contribution from surface scattering. Due to the porosity of the demineralized enamel, the index-matching agent will often imbibe into the eroded enamel and thus affect both the surface and volume scattering.28 This was observed when index-matching fluid, glycerol, and optical gel were used. After application onto the tooth, the intensity of the reflection from the eroded region changed from brighter than the sound enamel region to darker than the sound enamel region over the time frame of approximately 2 min. The inversion of the contrast between the eroded and sound enamel as well as the time dependency for the inversion to occur strongly suggests that, over time, the fluids eventually fill in the voids of the more porous surface enamel and also imbibe into the subsurface enamel, thus leading to lower optical scattering and therefore lower reflection intensity in the image. Thus we were unable to separate surface from volume scattering using the liquids and gel. However, a transparent viscoelastic pressure sensitive adhesive was used successfully to separate the two optical scattering modes. The adhesive consists of a layer of weakly cross-linked polymers with a thickness of 20 to 100 µm.39 The low-frequency elastic modulus of the adhesive compound, allows for deformation and can make near perfect contact with rough surfaces under low squeezing pressures.40 The nearly complete wetting by the adhesive of the roughened outer enamel minimized surface scattering while retaining the volume scattering. Figure 16 depicts pictorially the results of acid exposure and the effectiveness of the adhesive in minimizing scattering from the surface of the roughened tooth. Fig. 16Cross-sectional depiction of a tooth (a) prior to acid challenge and (b) after acid challenge. After acid exposure, the amorphous surface layer is weakened, creating a porous and roughened outer surface. The pores allow acid to attack the underlying enamel, leading to demineralized enamel prism cores. Therefore, both scattering from the surface (from the roughened amorphous layer) and subsurface volume scattering (from the porous demineralized enamel) is present. However, after the application of a viscoelastic pressure-sensitive adhesive to the surface of the tooth, the adhesive fills the majority of the roughened surface, thus minimizing surface scattering without affecting volume scattering. 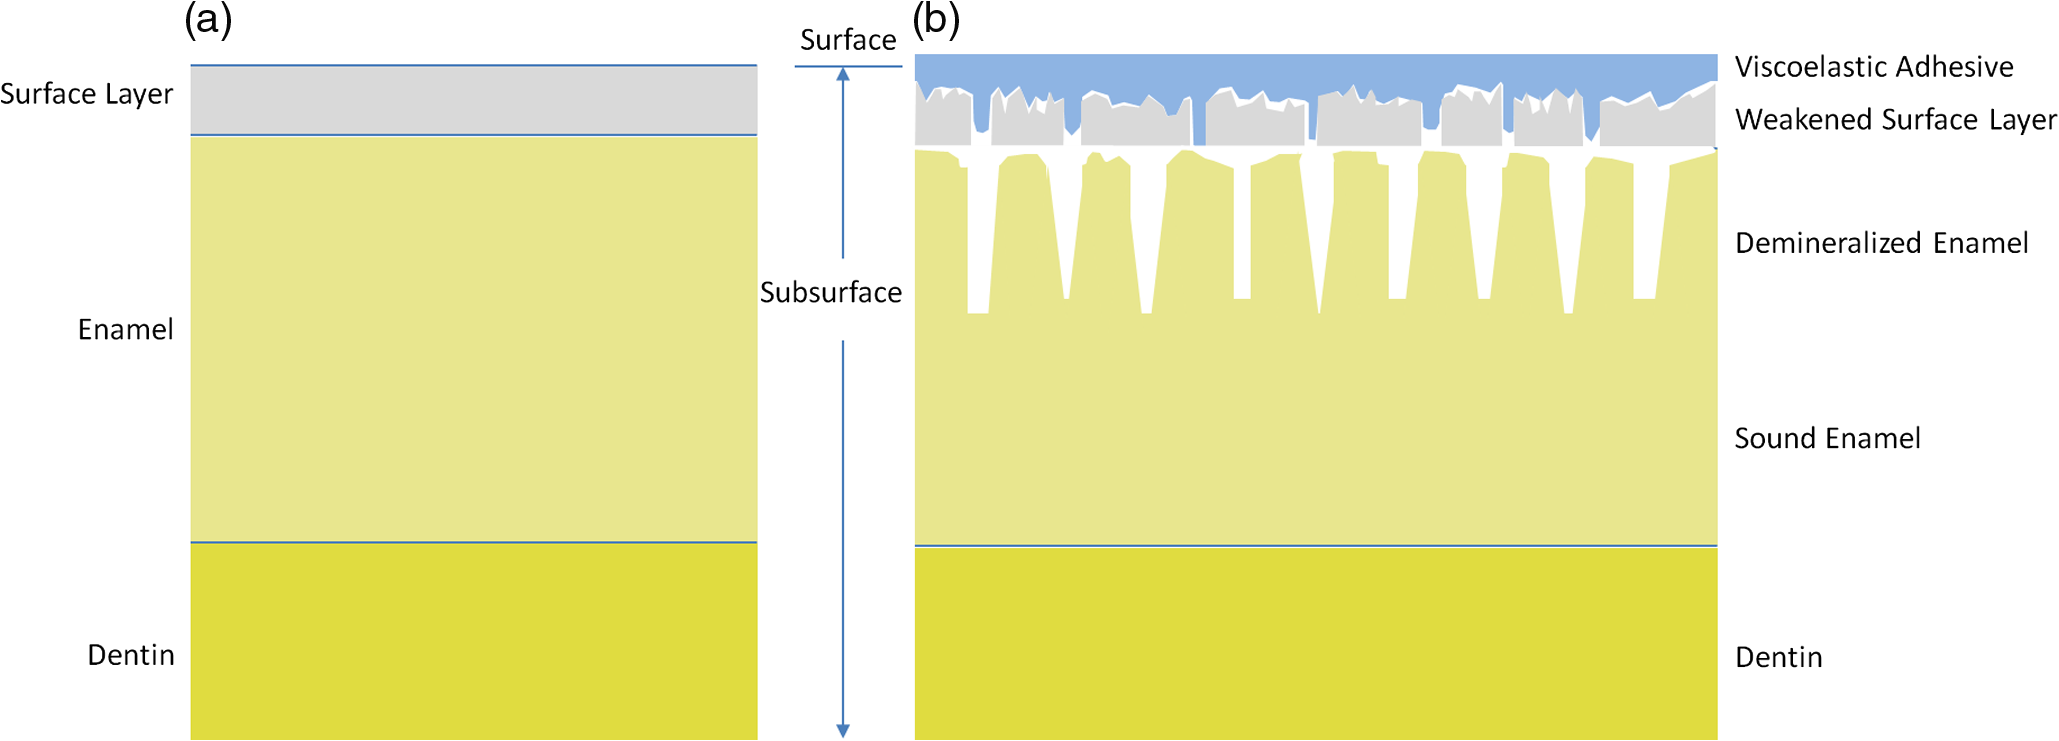 This study was done in a controlled environment to eliminate unnecessary variables and to ensure fairness of comparison; however, the challenges involved in the translation into a clinical setting should not be underestimated. On the other hand, the fast video (30 Hz) frame rates and the nature of the SFE optics provide excellent image quality even under clinical conditions. Furthermore, the SFE has been approved for clinical investigations in the esophagus, biliary and pancreatic ducts, fallopian tubes, and bladder. In conclusion, we have demonstrated that short wavelength 405-nm illumination in conjunction with the SFE yields higher-resolution images with enhanced surface detail compared with longer visible wavelength illumination. In addition, the reflected violet light contrast of shallow artificial erosion/sound enamel is considerably higher than for longer wavelengths. Monte Carlo simulations also confirmed the aforementioned experimental results. AcknowledgmentsThe study was partially funded by the University of Washington’s Center for Commercialization, Washington Research Foundation, NIH RO1 (EB008119, PI Seibel) for image-guided laser-induced fluorescence diagnosis, and the Washington state Life Sciences Discovery Fund. We would like to thank the reviewers for their constructive comments and suggestions. The authors appreciate helpful suggestions provided by Dr. Amy S. Kim and Dr. Joel H. Berg (Pediatric Dentistry, University of Washington). We would like to thank Dr. Jim Wefel and Jeffrey Harless (University of Iowa) for preparation of the extracted teeth specimens and would like to thank Lindsey Maier (NanoTech User Facility at the University of Washington) for her help in critical point drying and SEM training. We appreciate the Materials Science and Engineering User Facility and Tuesday Kuykendall for providing access to the Olympus microscope and Dr. Sue Herring for use of the microtome saw. The MC code was modified from the original source at http://omlc.ogi.edu/software/mc/. Finally, we would like to thank Jeremy Ridge and Stephanie Tran for their assistance with experiments and SEM imaging. ReferencesM. S. Nahás Pires Corrêaet al.,
“Prevalence and associated factors of dental erosion in children and adolescents of a private dental practice,”
Int. J. Paediatr. Dent., 21
(6), 451
–458
(2011). Google Scholar
T. JaeggiA. Lussi,
“Prevalence, incidence and distribution of erosion,”
Monogr. Oral. Sci., 20 44
–65
(2006). MGUSCU Google Scholar
B. K. GandaraE. L. Truelove,
“Diagnosis and management of dental erosion,”
J. Contemp. Dent. Practice, 1
(1), 1
–17
(1999). Google Scholar
T. Attin,
“Methods for assessment of dental erosion,”
Monogr. Oral. Sci., 20 152
–172
(2006). MGUSCU Google Scholar
J. J. ten BoschH. C. van der MeiP. C. F. Borsboom,
“Optical monitor of in vitro caries,”
Caries Res., 18
(6), 540
–547
(1984). http://dx.doi.org/10.1159/000260818 CAREBK 0008-6568 Google Scholar
J. ArendsJ. L. RubenD. Inaba,
“Major topics in quantitative microradiography of enamel and dentin: R parameter, mineral distribution visualization, and hyper-remineralization,”
Adv. Dent. Res., 11
(4), 403
–414
(1997). http://dx.doi.org/10.1177/08959374970110040501 0895-9374 Google Scholar
C. GanssA. LussiJ. Klimek,
“Comparison of calcium/phosphorus analysis, longitudinal microradiography and profilometry for the quantitative assessment of erosive demineralization,”
Caries Res., 39
(3), 178
–184
(2005). http://dx.doi.org/10.1159/000084795 CAREBK 0008-6568 Google Scholar
C. H. Wilder-Smithet al.,
“Quantification of dental erosion in patients with GERD using optical coherence tomography before and after double-blind, randomized treatment with esomeprazole or placebo,”
Am. J. Gastroenterol., 104 2788
–2795
(2009). http://dx.doi.org/10.1038/ajg.2009.441 AJGAAR 0002-9270 Google Scholar
M. H. van der VeenE. de Josselin de Jong,
“Application of quantitative light-induced fluorescence for assessing early caries lesions,”
Monogr. Oral. Sci., 17 144
–162
(2000). http://dx.doi.org/10.1159/000061639 MGUSCU Google Scholar
M. E. BarbourJ. S. Rees,
“The laboratory assessment of enamel erosion: a review,”
Jden., 32
(8), 591
–602
(2004). http://dx.doi.org/10.1016/j.jdent.2004.05.001 JDENAB 0300-5712 Google Scholar
C. M. BühlerP. NgaotheppitakD. Fried,
“Imaging of occlusal dental caries (decay) with near-IR light at 1310-nm,”
OSA Optics Express, 13
(2), 573
–582
(2005). http://dx.doi.org/10.1364/OPEX.13.000573 OPEXFF 1094-4087 Google Scholar
J. WuD. Fried,
“High contrast near-infrared polarized reflectance images of demineralization on tooth buccal and occlusal surfaces at ,”
Lasers Surg. Med., 41
(3), 208
–213
(2009). http://dx.doi.org/10.1002/lsm.v41:3 LSMEDI 0196-8092 Google Scholar
C. ZakianI. PrettyR. Ellwood,
“Near-infrared hyperspectral imaging of teeth for dental caries detection,”
J. Biomed. Opt., 14
(6), 064047
(2009). http://dx.doi.org/10.1117/1.3275480 JBOPFO 1083-3668 Google Scholar
D. Friedet al.,
“In vivo near-IR imaging of occlusal lesions at 1310-nm,”
Proc. SPIE, 7884 78840B
(2011). http://dx.doi.org/10.1117/12.878888 PSISDG 0277-786X Google Scholar
C. M. Leeet al.,
“Scanning fiber endoscopy with highly flexible, 1 mm catheterscopes for wide-field, full-color imaging,”
J. Biophoton., 3
(5–6), 385
–407
(2010). http://dx.doi.org/10.1002/jbio.v3:5/6 JBOIBX 1864-063X Google Scholar
S. J. Milleret al.,
“Targeted detection of murine colonic dysplasia in vivo with flexible multi-spectral scanning fiber endoscopy,”
J. Biomed. Opt., 17
(2), 021103
(2012). http://dx.doi.org/10.1117/1.JBO.17.2.021103 JBOPFO 1083-3668 Google Scholar
J. Wefel,
(2010). Google Scholar
L. ZhangL. Y. NelsonE. J. Seibel,
“Red-shifted fluorescence of sound dental hard tissue,”
J. Biomed. Opt., 16
(7), 071411
(2011). http://dx.doi.org/10.1117/1.3606572 JBOPFO 1083-3668 Google Scholar
R. C. GonzalezR. E. Woods, Digital Image Processing, Prentice Hall, Upper Saddle River, NJ
(2002). Google Scholar
L. J. Wanget al.,
“A new model for nanoscale enamel dissolution,”
J. Phys. Chem., 109
(2), 999
–1005
(2005). http://dx.doi.org/10.1021/jp046451d JPCHAX 0022-3654 Google Scholar
L. J. Wanget al.,
“Enamel demineralization in primary and permanent teeth,”
J. Dent. Res., 85
(4), 359
–363
(2006). http://dx.doi.org/10.1177/154405910608500415 JDREAF 0022-0345 Google Scholar
M. F. Orellanaet al.,
“Surface analysis of etched molar enamel by gas adsorption,”
J. Dent. Res., 87
(6), 532
–536
(2008). http://dx.doi.org/10.1177/154405910808700607 JDREAF 0022-0345 Google Scholar
E. Rakhmatullinaet al.,
“Application of the specular and diffuse reflection analysis for in vitro diagnostics of dental erosion: correlation with enamel softening, roughness, and calcium release,”
J. Biomed. Opt., 16
(10), 107002
(2011). http://dx.doi.org/10.1117/1.3631791 JBOPFO 1083-3668 Google Scholar
J. S. WefelJ. D. Harless,
“Comparison of artificial white spots by microradiography and polarized light microscopy,”
J. Dent. Res., 63
(11), 1271
–1275
(1984). http://dx.doi.org/10.1177/00220345840630110301 JDREAF 0022-0345 Google Scholar
S. A. Prahlet al.,
“A Monte Carlo model of light propagation in tissue,”
SPIE Proc. Dosimetry Las. Rad. Med. Bio., 5 102
–111
(1989). Google Scholar
L. H. WangS. L. JacquesL. Q. Zheng,
“MCMLMonte Carlo modeling of photon transport in multi-layered tissues,”
Comp. Meth. Prog. Biomed., 47
(2), 131
–146
(1995). http://dx.doi.org/10.1016/0169-2607(95)01640-F CMPBEK 0169-2607 Google Scholar
D. Friedet al.,
“Nature of light scattering in dental enamel and dentin at visible and near-infrared wavelengths,”
Appl. Opt., 34
(7), 1278
–1285
(1995). http://dx.doi.org/10.1364/AO.34.001278 APOPAI 0003-6935 Google Scholar
C. L. DarlingG. D. HuynhD. Fried,
“Light scattering properties of natural and artificially demineralized dental enamel at 1310 nm,”
JBO, 11
(3), 034023
(2006). http://dx.doi.org/10.1117/1.2204603 JBOPFO 1083-3668 Google Scholar
J. J. ten Bosch,
“Light scattering and related methods in caries diagnosis,”
in Proc. of the 1st Annual Indiana Conf.,
81
–90
(1996). Google Scholar
M. H. van der Veenet al.,
“A Monte Carlo simulation of the influence of sound enamel scattering coefficient on lesion visibility in light-induced fluorescence,”
Caries Res., 36
(1), 10
–18
(2002). http://dx.doi.org/10.1159/000057584 CAREBK 0008-6568 Google Scholar
D. SpitzerJ. J. Ten Bosch,
“The absorption and scattering of light in bovine and human dental enamel,”
Calcif. Tiss. Res., 17 129
–137
(1975). http://dx.doi.org/10.1007/BF02547285 CATRBZ 0008-0594 Google Scholar
D. SpitzerJ. J. Ten Bosch,
“Luminescence quantum yields of sound and carious dental enamel,”
Calcif. Tiss. Res., 24 249
–251
(1977). http://dx.doi.org/10.1007/BF02223324 CATRBZ 0008-0594 Google Scholar
Z. MengX. S. Yao,
“Measurement of the refractive index of human teeth by optical coherence tomography,”
J. Biomed. Opt., 14
(3), 034010
(2009). http://dx.doi.org/10.1117/1.3130322 JBOPFO 1083-3668 Google Scholar
B. Angmar -MånssonJ. J. Ten Bosch,
“Optical methods for the detection and quantification of caries,”
ADR, 1
(1), 14
–20
(1986). http://dx.doi.org/10.1177/08959374870010010601 0895-9374 Google Scholar
J. R. ZijpJ. J. Ten BoschR. A. J. Groenhuis,
“HeNe-laser scattering by human enamel,”
J. Dent. Res., 74
(12), 1891
–1898
(1995). http://dx.doi.org/10.1177/00220345950740121301 JDREAF 0022-0345 Google Scholar
J. H. Berg,
(2011). Google Scholar
P. AndersonJ. C. Elliott,
“Rates of mineral loss in human enamel during in vitro demineralization perpendicular and parallel to the natural surface,”
Caries Res., 34
(1), 33
–40
(2000). http://dx.doi.org/10.1159/000016567 CAREBK 0008-6568 Google Scholar
J. Zhenget al.,
“Erosion behavior of human tooth enamel in citric acid solution,”
J. Triboint., 42
(11–12), 1558
–1564
(2009). http://dx.doi.org/10.1016/j.triboint.2008.12.008 TRBIBK 0301-679X Google Scholar
B. N. J. Perssonet al.,
“Contact area between a viscoelastic solid and a hard, randomly rough, substrate,”
J. Chem. Phys., 120
(18), 8779
–8793
(2004). http://dx.doi.org/10.1063/1.1697376 JCPSA6 0021-9606 Google Scholar
A. G. PeressadkoN. HosodaB. N. J. Persson,
“Influence of surface roughness on adhesion between elastic bodies,”
Phys. Rev. Lett., 95
(12), 124301
(2005). http://dx.doi.org/10.1103/PhysRevLett.95.124301 PRLTAO 0031-9007 Google Scholar
|


