

|
|
1.IntroductionThe premise of optical tomography is that different tissues or different pathological states of tissue can be discriminated by quantifying the optical properties of the tissue.1,2 Some of these properties, in particular the attenuation coefficient , can be quantified by optical coherence tomography (OCT).3–7 The large contrast and granular appearance of speckle is a major challenge in such analyses. Speckle is an inherent random signal modulation occurring in coherent imaging modalities, arising from the summation at the detector of the random phasors of subresolution scatterers.8,9 It can be viewed as unresolved spatial information and cannot be separated from the signal modulation that carries the resolved image of the object.9 As such, speckle cannot be strictly characterized as noise, but rather as an artifact that compromises the image. The magnitude of the speckle fluctuation in an OCT image, measured by the standard deviation divided by the mean signal in a homogeneous part of the image, is .10,11 If we consider the speckle as multiplicative noise on a signal, this corresponds to an effective contrast-to-noise ratio (CNR), the inverse of the speckle fluctuation, of . Methods for quantitative data analysis often use models to estimate some property of the signal from which physiological parameters can be deduced. Such estimates are more accurate if the CNR is increased relative to this minimal value. Speckle reduction techniques generally fall into two groups: physical compounding and digital filtering. The former reduces speckle by incoherently summing different realizations of the same OCT image, each consisting of a different realization of the speckle pattern. It requires, however, that multiple realizations of the same scene or object can be sampled while one parameter (angle, wavelength, position) is varied in a controlled manner.12–16 Compounding strategies generally achieve a CNR improvement proportional to the square root of the number of realizations. Digital filtering aims to reduce speckle by post-processing, while preserving image resolution, contrast, and edge fidelity.17–20 CNR improvements up to a factor 2 have been realized based on a single acquisition of a scene.18 Compounding is impractical for catheter-based OCT implementations. Intravascular (and some other forms of endoscopic OCT21) use a rotating catheter with a side-viewing fiber probe scanning over the tissue. The catheter rotation is continuous, its position cannot be conveniently controlled during the scan, and heart motion during imaging is significant. As a result, it is very difficult to apply conventional compounding strategies that require the acquisition of multiple axial scans (A-lines) at the same spatial location. Straightforward averaging of adjacent A-lines has been applied but is affected by tissue heterogeneity and accompanied by loss of transverse resolution.22,23 We have recently demonstrated intravascular imaging of the optical attenuation coefficient of the arterial wall using a commercial OCT system.5,24,25 Plaque components that are associated with lesion instability, such as necrotic core and dense macrophage infiltrations, were shown to exhibit a higher attenuation coefficient than tissue types occurring in stable plaques. Speckle compensation relied on angular alignment and compounding of a series of frames acquired at a single location in the coronary artery under investigation. Due to small changes in imaging beam position and angle, as well as in catheter optical path length, multiple speckle realizations could be sampled. This strategy permitted imaging of tissue optical properties with full transverse resolution. The requirement of multiframe averaging precluded the analysis of full pullbacks, which is the routine acquisition mode in clinical intravascular imaging. In addition, follow-up imaging is exceedingly difficult with this method, as the catheter would have to be positioned accurately at the original imaging site, impairing the value of optical attenuation imaging as a study tool. In this technical note, we present a new method for speckle reduction in OCT data that allows single-frame processing of the optical properties of the imaged tissue. It emulates wavelength compounding on a single A-scan, relying on multiple Fourier transforms of the acquired frequency-domain data. For each Fourier transform, a narrow window is applied to the data with a shifted center frequency. In this manner, we construct a set of lower-resolution images from a single A-line, each with an independent realization of speckle. These images are then compounded to create a speckle-reduced image for analysis. We propose to call this technique, frequency domain multiplexing (FDM). We demonstrate the applicability of FDM for speckle filtering on clinically acquired data from intracoronary optical frequency-domain imaging (OFDI).26 From the data, we generate optical attenuation coefficient maps for tissue type imaging. We show that the resulting attenuation coefficient maps are quantitatively and qualitatively equivalent to those acquired by multiframe averaging. 2.Methods2.1.Clinical Imaging Protocol and Data AnalysisPatients scheduled for elective percutaneous coronary intervention (PCI) at the Erasmus University Medical Center (Erasmus MC) in Rotterdam, The Netherlands, were included in this study. After successful PCI, two pullbacks with the OFDI system and one intravascular ultrasound (IVUS) pullback were performed. In a subset of patients, stationary (i.e., no pullback) movies by OFDI were acquired at selected locations in the pullback. Such sites were identified on the previously acquired pullbacks and x-ray angiograms. Synchronous electrocardiogram (ECG) signal was recorded. The participants gave written informed consent to the study, which was sanctioned by the Medical Ethics Review Committee of the Erasmus MC. OFDI data were acquired at a frame rate of 105 frames per second (fps) using a rotating catheter, with a pullback speed of . The line rate was 54 kHz from a wavelength-swept laser source,27 and every frame consisted of 512 A-lines. Optical clearing of the artery under investigation was achieved by flushing with Iodixanol 370 (Visipaque™, GE Healthcare, Cork, Ireland) at 3 to , using injector pump (Mark-V Pro Vis, Medrad Inc., Indianola, PA). 2.2.Speckle Reduction TechniqueAll analyses were implemented in Matlab R2011b, and performed on an Intel Core2 Duo (2.50 GHz) PC laptop. The OFDI system acquired data in two orthogonal polarization channels , each consisting of samples. For sidelobe suppression in the full-resolution image, we apply an apodization window of length , centered at , , where is the middle of the frequency sweep. Application of the inverse Fourier transform and envelope filtering yields the time-domain A-scan: where is the inverse Fourier transform. The OFDI image formation procedure is illustrated in Fig. 1. As the input polarization state may be modified by the rotating catheter, the OCT image line is constructed as the norm of the two-channel data:Fig. 1The FD-OCT image formation process. (a) Received interferogram in the frequency domain; (b) the interferogram multiplied by a window (broken line) to reduce sidelobes; (c) the A-line resulting from Fourier transforming the windowed spectrum and taking the envelope.  The resulting image exhibits fully developed speckle, as can be verified by comparing the speckle contrast to the theoretical value of . The speckle-reduction method we apply here operates on a single OCT A-scan; see Fig. 2. By subdividing the frequency domain interferogram in a number of distinct narrower windows, each with a different center frequency, several independent speckle realizations can be generated. We compound the frequency domain multiplexed speckles to obtain an image with strongly reduced speckle. The resulting images have degraded axial resolution because of the limited frequency range used for their generation; for parametric imaging it can be argued that some loss of resolution is acceptable. is acquired directly in Fourier-domain OCT (FD-OCT), but can also be obtained by Fourier transformation in time-domain OCT (TD-OCT). Fig. 2Frequency domain speckle reduction, showing (7 windows) as an example. (a) The original -space interferogram; (b) a series of narrow apodization windows (broken lines) is applied to the data, each shifted in center frequency. These windowed spectra are now statistically independent. (c) The individual spectra are Fourier transformed and envelope filtered to generate a set of independent speckle realizations. (d) These are averaged to produce a frequency compounded version of the OCT A-line (solid), which has reduced speckle compared to the full-spectrum A-line (dotted line).  For wavelength compounding, we apply a series of narrower apodization windows , each with a length of , and center frequency , where is the frequency discretization interval and . The parameter can be chosen to manage the tradeoff between image resolution and speckle reduction; larger means narrower windows, resulting in degraded resolution but more effective speckle reduction. The windows are positioned across the spectrum in a way that their center frequencies are equally spaced, and intersect neighboring windows at 50% of the maximum if a Hamming window is chosen for apodization. Each window covers a different part of the frequency sweep, its peak coinciding with the wings of its neighbors. The partial A-lines resulting from inverse Fourier transforming are then averaged to produce a speckle-reduced version of the original A-line: The sum is normalized to the window weight and the two channels are implicit. Compounding of amplitudes (rather than magnitudes; ) to facilitate comparison with earlier studies on OCT speckle compounding.9,12–16 We show results in this study for , using a Hamming window for apodization. We quantify the effect of the filter by two measures:
2.3.Attenuation AnalysisThe algorithm we applied for processing the speckle-filtered data for analysis of the attenuation coefficient has previously been described.5,24 We compared the effect of FDM speckle reduction by comparing it to multiframe averaging. From a stationary (nonpullback) intracoronary OFDI recording with ECG, frames corresponding to the diastolic filling phase were selected, residual motion artifacts were eliminated,28 and averaged for speckle reduction. One single frame of the same series was processed using FDM. Both speckle-reduced frames were then analyzed for the attenuation coefficient. 3.Results and Discussion3.1.Properties of Frequency Domain Multiplexing Speckle ReductionThe effect of FDM speckle reduction is demonstrated for in Fig. 3. The magnifications clearly show the speckle suppression, but also the trade-off in resolution. Nevertheless, image definition remains sufficient to identify structures like the intimal tear at 2 o’clock. The image resolution and CNR as a function of the filter parameter were measured in a series OFDI frames. The results are shown in Figs 4 and 5. Ten homogeneous regions in five frames were sampled for the CNR measurement. The image definition, or axial PSF width, is found to be inversely proportional to the filter window width (proportional to ). The CNR is seen to scale with the square root of , i.e., the square root of the number of windows. A fit of yields , close to the theoretical prediction of 1.91 for compounding statistically independent speckle realizations. Fig. 3Result of FDM speckle compounding on an intravascular OFDI image (left) and magnifications (right). (a) Original image; (b) ; and (c) .  Fig. 4Definition of the filtered OFDI data as a function of filter parameter . The line is a linear fit through the origin.  Fig. 5Contrast-to-noise ratio (CNR) as a function of filter parameter ; error bars were computed from CNR measurements on 10 homogeneous areas in 5 frames. Line is a fit of to the data; .  As an additional check of the statistical independence of the partial speckles, we verified that the covariance matrix of the ensemble members had off-diagonal elements close to zero. The mean value of the subdiagonal elements of the covariance matrix was typically six to eight times smaller than the mean of the diagonal elements. The choice of apodization window influences the filter performance. Besides window width, which we investigated in this work, window spacing may also play a role. We used 50% overlap in frequency between adjacent windows in the present study, but larger or smaller overlaps may produce different results. Disjoint windows produce artifacts in the image because the compounded image is created from a discontinuous frequency spectrum. Detailed analysis of the mathematical behavior of the filter is needed to systematically optimize speckle reduction performance without excessive degradation of resolution. 3.2.Comparison with Other Speckle Reduction TechniquesFDM has a distinct advantage over the other compounding techniques of requiring only one measurement at every location, which is a requirement for analysis of routinely acquired pullbacks. It can improve the CNR to values with filter parameters that retain sufficient image fidelity to identify salient features. We argue that the observed degradation in image resolution is an acceptable penalty for quantitative analysis and parametric imaging; the full-spectrum image remains available for visual interpretation of tissue structure in high resolution. In this section, we compare the technique with two others in terms of performance and computational cost. Imaging results are summarized in Fig. 6. Fig. 6Comparison of several speckle reduction techniques for intravascular OCT imaging. (a) Raw OCT frame, inset shows magnification of the boxed area; (b) Compounding of 20 frames from a stationary recording after alignment; (c) Frequency domain multiplexing, ; (d) Convolution with a Gaussian kernel of . 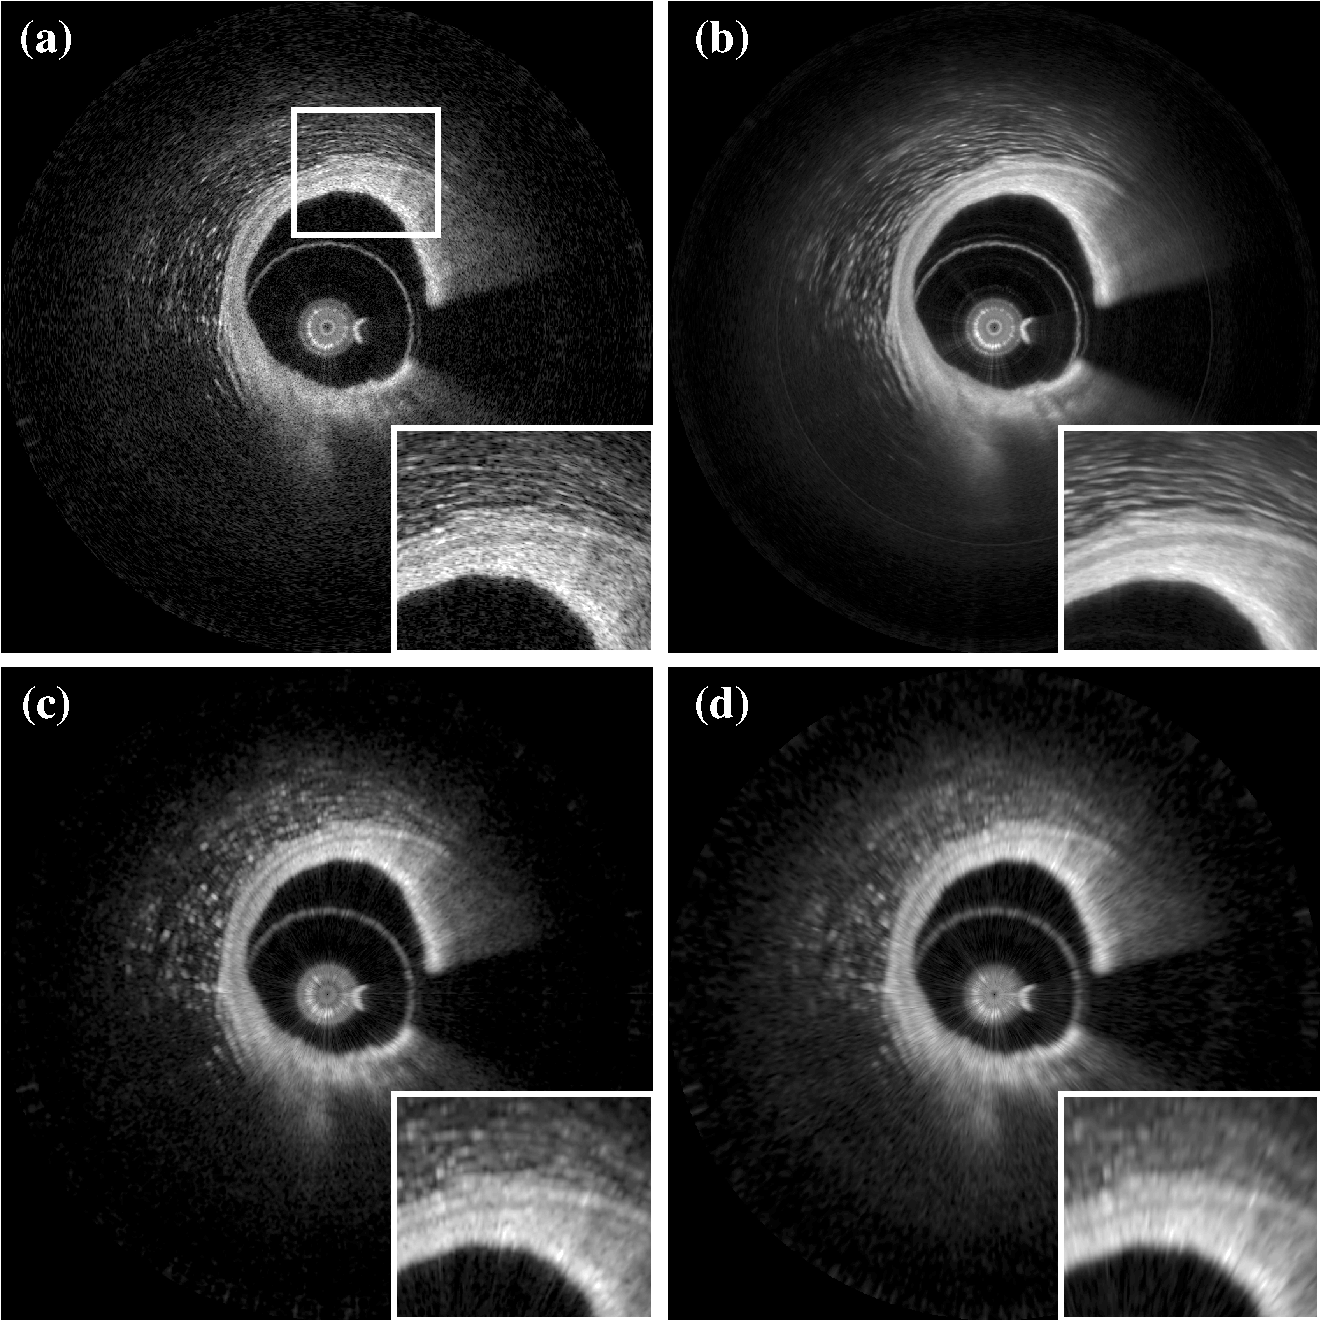 Multiframe averaging can only be applied if a stationary recording is performed, followed by correction of residual motion artifacts. In a data set that was acquired in this manner, we compounded a series of 20 frames acquired at one site. Speckle reduction was seen to be very effective, see Fig. 6(b). In an ROI with homogeneous signal intensity, we measured a . This value is larger than the one that is achieved with the other techniques, though smaller than the expected . Given that only one appropriate ROI was available in the data set, we will not speculate about the cause for this difference. As discussed in the introduction, routine acquisition of multiframe compounding data is unlikely. Axial low-pass filtering of the image data is another technique to reduce speckle in post-processing that also works on a single A-scan. It has the additional advantages of not requiring access to the frequency domain interferogram, and availability of highly optimized computational tools. Figure 6(d) shows the effect of convolution with a Gaussian kernel with , resulting in the same image resolution as achieved with displayed in Fig. 6(c). Comparison shows a somewhat reduced image contrast using the low-pass time-domain filter. We convolved our data in the time domain with a Gaussian kernel of varying width and compared the performance in terms of CNR gain versus resolution loss. Figure 7 demonstrates that for light filtering, the performance of FDM and Gaussian smoothing is quite comparable, while for more aggressive smoothing, the CNR gain by frequency compounding is slightly larger at a given image resolution. We now estimate the computational cost of FDM compared to low-pass filtering. Straightforward low-pass filtering is a standard tool that benefits from optimized implementations. Forgoing those, for a spectrum of samples, and an apodization window of the same length, low-pass filtering requires three Fourier transformations of length . FDM applies two Fourier transforms per window, but the vectors can be shorter because the support of the window is only . If we assume that an FFT implementation has complexity , then the operation count of low-pass filtering can be estimated to scale as , while FDM scales as , which is slightly less than the number for low-pass filtering. The latter estimate may actually be slightly low because the complexity of common FFT implementations is higher for , where is an integer. will often be chosen to be a power of two, while is not in general. Such details notwithstanding, the above estimates demonstrate that the operation count for both filtering methods may be comparable. 3.3.ApplicationsThe speckle reduction scheme discussed in this study was developed to assist estimation of OCT signal amplitude for analysis of tissue optical attenuation. Scattering is generally the dominant attenuation mechanism in the relevant spectral range, which allows us to treat the attenuation as slowly varying with wavelength. We demonstrate the efficacy of FDM by analyzing a cross section from a stationary OFDI recording for the attenuation coefficient, and comparing with multiframe averaging. The result is shown in Fig. 8; the results from both speckle averaging approaches are seen to be qualitatively, with similar values for the attenuation coefficient seen across different regions of the frame. Both techniques find a highly attenuating region in the sector between 2 and 4 o’clock (indicated by the arrows), as well as a local area of elevated at 6 o’clock (*). The attenuation analysis includes a check on fit quality, which is more effective in suppressing the artifact coinciding with the adventitial border (dashed line) for the multiframe-averaged data, which has higher CNR. These data illustrate that single-frame speckle reduction by FDM is a feasible approach for quantitative analysis of the OCT signal. Fig. 8Attenuation analysis of one cross section from an intracoronary OFDI recording. (a): (9 window) FDM applied to one frame; (b): average of 20 frames after motion correction. Arrows and *: high attenuation regions; dashed line: artifact associated with adventitial border.  FDM is a versatile technique for quantitative analysis of speckle data. It has the potential to be expanded to a wide range of signal parameters beyond amplitude estimation, such as polarization state. An exciting possible application is in elastography, where displacement tracking is sensitive to speckle decorrelation and peak hopping. Frequency multiplexing may create multiple displacement estimates from a single A-scan, each with reduced sensitivity to speckle decorrelation, creating a more robust estimator for OCT elastography. Further exploration of these applications is the subject of future work. 4.ConclusionWe presented a new method for speckle reduction in FD-OCT images, using a set of windows to process the frequency domain data to replicate the well-established technique of wavelength compounding based on a single A-scan. One parameter governs the width of the windows and their number. The speckle reduction, measured by the CNR improvement, is proportional to the square root of the number of windows; the axial definition scales with the inverse of the window width. This technique is effective for preprocessing FDOCT or OFDI data prior to quantitative signal analysis. AcknowledgmentsDr. Bouma and Dr. Tearney received nonclinical sponsored research from Terumo Corporation and Ninepoint Medical. Massachusetts General Hospital has patent licensing arrangements with Terumo Corporation and Ninepoint Medical. They have the right to receive royalty income from these licensing agreements. They also receive royalty income through MIT. Dr. Tearney receives consulting income from Samsung Advanced Institute of Technology and Merck. ReferencesW. F. CheongS. A. PrahlA. J. Welch,
“A review of the optical properties of biological tissues,”
IEEE J. Quant. Electr., 26
(12), 2166
–2185
(1990). http://dx.doi.org/10.1109/3.64354 IEJQA7 0018-9197 Google Scholar
B. C. WilsonS. L. Jacques,
“Optical reflectance and transmittance of tissues—principles and applications,”
IEEE J. Quant. Electr., 26
(12), 2186
–2199
(1990). http://dx.doi.org/10.1109/3.64355 IEJQA7 0018-9197 Google Scholar
D. J. Faberet al.,
“Quantitative measurement of attenuation coefficients of weakly scattering media using optical coherence tomography,”
Opt. Express, 12
(19), 4353
–4365
(2004). http://dx.doi.org/10.1364/OPEX.12.004353 OPEXFF 1094-4087 Google Scholar
C. Xuet al.,
“Characterization of atherosclerosis plaques by measuring both backscattering and attenuation coefficients in optical coherence tomography,”
J. Biomed. Opt., 13
(3), 034003
(2008). http://dx.doi.org/10.1117/1.2927464 JBOPFO 1083-3668 Google Scholar
G. van Soestet al.,
“Atherosclerotic tissue characterization in vivo by optical coherence tomography attenuation imaging,”
J. Biomed. Opt., 15
(1), 011105
(2010). http://dx.doi.org/10.1117/1.3280271 JBOPFO 1083-3668 Google Scholar
E. C. C. Cauberget al.,
“Quantitative measurement of attenuation coefficients of bladder biopsies using optical coherence tomography for grading urothelial carcinoma of the bladder,”
J. Biomed. Opt., 15
(6), 066013
(2010). http://dx.doi.org/10.1117/1.3512206 JBOPFO 1083-3668 Google Scholar
J. M. SchmittA. KnuttelR. F. Bonner,
“Measurement of optical properties of biological tissues by low-coherence reflectometry,”
Appl. Opt., 32
(30), 6032
–6042
(1993). http://dx.doi.org/10.1364/AO.32.006032 APOPAI 0003-6935 Google Scholar
J. W. Goodman,
“Statistical properties of laser speckle patterns,”
Laser speckle and related phenomena, Springer-Verlag, Berlin
(1984). Google Scholar
J. M. SchmittS. H. XiangK. M. Yung,
“Speckle in optical coherence tomography,”
J. Biomed. Opt., 4
(1), 95
–105
(1999). http://dx.doi.org/10.1117/1.429925 JBOPFO 1083-3668 Google Scholar
J. W. Goodman, Statistical Optics, Wiley, New York
(1985). Google Scholar
B. Karamataet al.,
“Speckle statistics in optical coherence tomography,”
J. Opt. Soc. Am. A., 22
(4), 593
–596
(2005). http://dx.doi.org/10.1364/JOSAA.22.000593 JOAOD6 1084-7529 Google Scholar
A. E. Desjardinset al.,
“Estimation of the scattering coefficients of turbid media using angle-resolved optical frequency-domain imaging,”
Opt. Lett., 32
(11), 1560
–1562
(2007). http://dx.doi.org/10.1364/OL.32.001560 OPLEDP 0146-9592 Google Scholar
D. P. PopescuM. D. HewkoM. G. Sowa,
“Speckle noise attenuation in optical coherence tomography by compounding images acquired at different positions of the sample,”
Opt. Commun., 269
(1), 247
–251
(2007). http://dx.doi.org/10.1016/j.optcom.2006.07.063 OPCOB8 0030-4018 Google Scholar
M. Pircheret al.,
“Speckle reduction in optical coherence tomography by frequency compounding,”
J. Biomed. Opt., 8
(3), 565
–569
(2003). http://dx.doi.org/10.1117/1.1578087 JBOPFO 1083-3668 Google Scholar
J. Kimet al.,
“Optical coherence tomography speckle reduction by a partially spatially coherent source,”
J. Biomed. Opt., 10
(6), 064034
(2005). http://dx.doi.org/10.1117/1.2138031 JBOPFO 1083-3668 Google Scholar
N. IftimiaB. E. BoumaG. J. Tearney,
“Speckle reduction in optical coherence tomography by “path length encoded” angular compounding,”
J. Biomed. Opt., 8
(2), 260
–263
(2003). http://dx.doi.org/10.1117/1.1559060 JBOPFO 1083-3668 Google Scholar
D. L. MarksT. S. RalstonS. A. Boppart,
“Speckle reduction by I-divergence regularization in optical coherence tomography,”
J. Opt. Soc. Am. A, 22
(11), 2366
–2371
(2005). http://dx.doi.org/10.1364/JOSAA.22.002366 JOAOD6 0740-3232 Google Scholar
A. Ozcanet al.,
“Speckle reduction in optical coherence tomography images using digital filtering,”
J. Opt. Soc. Am. A., 24
(7), 1901
–1910
(2007). http://dx.doi.org/10.1364/JOSAA.24.001901 JOAOD6 1084-7529 Google Scholar
D. C. AdlerT. H. KoJ. G. Fujimoto,
“Speckle reduction in optical coherence tomography images by use of a spatially adaptive wavelet filter,”
Opt. Lett., 29
(24), 2878
–2880
(2004). http://dx.doi.org/10.1364/OL.29.002878 OPLEDP 0146-9592 Google Scholar
J. M. Schmitt,
“Restoration of optical coherence images of living tissue using the CLEAN algorithm,”
J. Biomed. Opt., 3
(1), 66
–75
(1998). http://dx.doi.org/10.1117/1.429863 JBOPFO 1083-3668 Google Scholar
M. J. Suteret al.,
“Comprehensive microscopy of the esophagus in human patients with optical frequency domain imaging,”
Gastrointest. Endosc., 68
(4), 745
–753
(2008). http://dx.doi.org/10.1016/j.gie.2008.05.014 GAENBQ 0016-5107 Google Scholar
A. I. Kholodnykhet al.,
“Precision of measurement of tissue optical properties with optical coherence tomography,”
Appl. Opt., 42
(16), 3027
–3037
(2003). http://dx.doi.org/10.1364/AO.42.003027 APOPAI 0003-6935 Google Scholar
F. J. van der Meeret al.,
“Localized measurement of optical attenuation coefficients of atherosclerotic plaque constituents by quantitative optical coherence tomography,”
IEEE Trans. Med. Imaging, 24
(10), 1369
–1376
(2005). http://dx.doi.org/10.1109/TMI.2005.854297 ITMID4 0278-0062 Google Scholar
G. van Soestet al.,
“Imaging atherosclerotic plaque composition with intracoronary optical coherence tomography,”
Neth. Heart J., 17
(11), 448
–450
(2009). http://dx.doi.org/10.1007/BF03086301 1568-5888 Google Scholar
G. van Soestet al.,
“Algorithm optimization for quantitative analysis of intravascular optical coherence tomography data,”
Photonic Therapeutics and Diagnostics V, SPIE, San Jose, CA
(2009). Google Scholar
G. J. Tearneyet al.,
“Three-dimensional coronary artery microscopy by intracoronary optical frequency domain imaging,”
J. Am. Coll. Cardiol. Img., 1
(6), 752
–761
(2008). Google Scholar
S. H. Yunet al.,
“High-speed optical frequency-domain imaging,”
Opt. Express, 11
(22), 2953
–2963
(2003). http://dx.doi.org/10.1364/OE.11.002953 OPEXFF 1094-4087 Google Scholar
G. van SoestJ. G. BoschA. F. W. van der Steen,
“Azimuthal registration of image sequences affected by nonuniform rotation distortion,”
IEEE Trans. Inf. Technol. Biomed., 12
(3), 348
–355
(2008). http://dx.doi.org/10.1109/TITB.2007.908000 1089-7771 Google Scholar
|


