
|
|
|
Photoacoustic tomography (PAT) is a novel, hybrid, nonionizing imaging modality that images the distribution of the optical energy deposition in biological tissues based on the photoacoustic effect. 1, 2, 3, 4 PAT combines the merits of pure optical imaging and ultrasound imaging methods, and is sensitive to optical absorption of biological tissue, especially blood in vessels. Compared to other high-resolution pure optical imaging modalities, PAT has a deeper penetration depth because the pure optical imaging methods are limited by the extinction coefficient of light in tissue , whereas PAT is limited only by the much smaller effective attenuation coefficient of light . Therefore, PAT provides both high optical contrast and good ultrasonic resolution while maintaining a relatively deep penetration depth, and has been successfully applied on visualizing the structures of a number of different biological tissues with satisfactory sensitivity and spatial resolution.5, 6 In general, the spatial resolution of PAT is limited by the laser pulse width, the bandwidth of the photoacoustic (PA) detection system, and the aperture size of the detector. 7, 8, 9, 10, 11, 12, 13, 14 In practice, the first parameter is usually sufficiently short, whereas the second parameter can be easily varied to reach a desired resolution at the expense of penetration. The third parameter can also be reduced to yield high spatial resolution, but only at the cost of signal-to-noise ratio (SNR). A circular scanning PAT system usually involves the scanning of a relatively large single element ultrasonic detector. The advantage of using a single element ultrasonic detector is that it provides good SNR, but the spatial resolution is limited by the aperture effect.7 We have proposed a ring-based virtual point detector and demonstrated its application with phantom experiments in PAT previously.15 In principle, the center point of a ring-shaped ultrasonic detector can be treated as a virtual point detector. This virtual point detector can be used to detect photoacoustic signals in the same way as a real point detector. The virtual point detector provides PAT with the advantages of a real point detector, i.e., high spatial resolution that is uniform throughout the field of view. At the same time, it produces much lower thermal noise than a real point detector because of its larger actual size. The images obtained by the virtual point detector also have better SNRs than those obtained by a finite aperture detector in the periphery of the images by avoiding the aperture effect. In this work, we apply the virtual point detector to PAT of a rat cerebral cortex and show its advantages over a finite-aperture detector. We built a 60-mm-diam, ring-based, ultrasonic, virtual point detector with polyvinylidene fluoride (PVDF) film. The PVDF film had a thickness of , and the detector had a center frequency around . To compare the virtual point detector with a finite-aperture detector, we further constructed a 4-mm-wide finite-aperture detector with the same material. The heights of both detectors were . The experimental setup for this study is shown in Fig. 1 . A Q-switched laser (LS-2137/2, Symphotic TII Company, Camarillo, California), operating at with a pulse repetition rate of , was employed as the irradiation source. The laser pulse duration was and was much shorter than the ultrasound duration detected by the ring transducer ( at ). Samples were irradiated from the top and scans were performed on a horizontal plane. The photoacoustic signal was detected by the ultrasound detectors and then amplified by a 50-dB amplifier (5072 PR, Panametrics, Waltham, Massachusetts). Next, the signal was directed to a digital oscilloscope (TDS5054, Tektronix, Beaverton, Oregon) and collected by a PC controlled by a LabVIEW program. The transducer was driven by a computer-controlled step motor to scan around the cortex of a rat brain in the plane with an angular step size of . During a scan, distance between the center of the virtual point detector and the scanning center was . This distance was chosen simply because it was enough to encircle the sample. The total data acquisition time for one image was . The cerebral cortex of a Sprague Dawley rat ( , Harlan Sprague Dawley Incorporated, Indianapolis, Indiana) was imaged in situ by PAT. Before the experiment, the hair on the head of the animal was depilated gently with hair removal lotion. The rat head, fixed steadily by a homemade animal holder, protruded up into a water tank through a hole in the bottom of the tank. A piece of clear membrane between the water and the rat head sealed the hole. After imaging with PAT, the rat skull was opened to expose the brain cortex. PAT images were compared with the photograph of the exposed brain. During the experiment, we treated the center of the ring as a point detector and used the center as if it were a real point detector to scan the animal head circularly. After scanning, the following process was followed for data processing, which we have also shown in Ref. 15.
For comparison, PAT imaging was also obtained using the finite-aperture PVDF detector, but with a 70-mm scan radius. The 70-mm scan radius was chosen for the finite-aperture detector to generate an image with SNR and resolution comparable to those produced by the ring transducer. If the scan radius is too small, the periphery of the image will be severely blurred, owing to poor resolution. If the scan radius is too large, the periphery of the image will be invisible, owing to poor SNR. Figure 2 shows the results of the PAT imaging of a rat cerebral cortex in situ. Figure 2a is the image obtained with the virtual point detector, whereas Fig. 2b is the image obtained with the finite-aperture detector. In Fig. 2b, the resolution and SNR are the best inside the circled region. Outside the circled region, i.e., toward the edge region of the image, the image resolution in Fig. 2b becomes blurred and the SNR is also reduced. By contrast, in Fig. 2a, the image obtained by the virtual point detector shows a uniformly distributed resolution and SNR. We have labeled four blood vessels near the edge of the image. These four blood vessels in Fig. 2b are barely identifiable, owing to poor SNR and resolution, but they are clearly shown in Fig. 2a. For example, for the blood vessel labeled as “1,” the SNR is in Fig. 2a but only in Fig. 2b. The measured width from the image is in Fig. 2a and in Fig. 2b. The improvement of the image quality at the periphery made the image obtained by the virtual point detector look “bigger.” Although the effective scanning distance for the ring detector is much smaller than that of the finite-aperture detector, the resolution in Fig. 2a does not show any aperture effect. At the same time, Fig. 2a displays reasonable SNR. To quantify the improvement of the image acquired with the ring detector, we used the photograph of the rat cerebral cortex as a reference and calculated the L2 norm error.17 The L2 norm errors of the images acquired with the ring detector and the finite-aperture detector yield 3029.5 and 4977.2, respectively. Therefore, using the ring detector improved the L2 norm error by 39%. All results here are consistent with our previous results acquired on tissue phantoms.15 Fig. 2(a) A rat cerebral cortex image obtained by using the virtual point detector with a scan radius of . (b) The same rat cerebral cortex image obtained by using the finite-aperture detector with a scan radius of . (c) The same rat cerebral cortex image obtained by using the virtual point detector with a smaller scan radius of . (d) A photograph of the rat cerebral cortex. The circled region in (a) corresponds to the imaged area in (c). The circled region in (b) indicates an area with best resolution and SNR. Four blood vessels are labeled 1 through 4 in (a) and (b), where the same number indicates the same blood vessel. 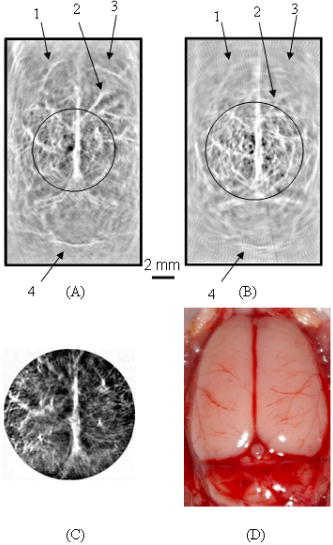 Another advantage of the virtual point detector is that the ring center can be placed inside a sample and used to scan a small area. As the scan geometry shrinks, the ring center approaches the targets. Therefore, this kind of internal scan is expected to improve SNR further. Figure 2c shows the result for an internal scan, which shows a contrast higher than that of Fig. 2a. The scan radius for this internal scan is , and the scan center is at the position (0, 0) in Fig. 2a. Figure 2d shows the photograph of the exposed rat brain cortex for comparison with PAT imaging. To further demonstrate the advantage of local scans on improving SNR, we applied the virtual point detector to scan a phantom target containing a cross made of two human hairs. The cross was located in the middle of the scanning region and was scanned using the virtual point detector with different scan radii. Figure 3 shows the signal strength of a point in the image near the scanning center as a function of the scanning radius for the virtual point detector. As the scanning radius decreases, the signal strength increases. We also have simulated the images for the local scan,15 and the simulated signal strength of the same point is plotted as a solid line. The simulated data fit the measured data well. Fig. 3The signal strength of a point on a line target as a function of the distance between the scan center and the center of the virtual point detector. The solid line represents the simulated data, and the asterisks represent the measured data.  In summary, we propose a novel virtual point detector constructed by a ring detector, and apply it to small animal imaging in PAT. The virtual point detector provides detection that is free of any aperture effect. Therefore, the virtual point detector can provide a uniformly distributed resolution throughout the image area. It also can improve the SNR of an image at the periphery while maintaining relatively strong SNR in the central region. Being the center of a physical ring, the virtual point detector can be scanned along a track inside a physically inaccessible medium to improve the SNR of a local region. AcknowledgmentsThis project was sponsored in part by the National Institutes of Health grant numbers R01 NS46214 and R01 EB000712. ReferencesC. G. A. Hoelen,
F. F. M. de Mul,
R. Pongers, and
A. Dekker,
“Three dimensional photoacoustic imaging of blood vessels in tissue,”
Opt. Lett., 23 648
–650
(1998). 0146-9592 Google Scholar
R. A. Kruger,
D. R. Reinecke, and
G. A. Kruger,
“Thermoacoustic computed tomography–technical considerations,”
Med. Phys., 26 1832
–1837
(1999). https://doi.org/10.1118/1.598688 0094-2405 Google Scholar
R. O. Esenaliev,
A. A. Karabutov, and
A. A. Oraevsky,
“Sensitivity of laser opto-acoustic imaging in detection of small deeply embedded tumors,”
IEEE J. Sel. Top. Quantum Electron., 5 981
–988
(1999). https://doi.org/10.1109/2944.796320 1077-260X Google Scholar
K. P. Köstli,
D. Frauchiger,
J. J. Niederhauser,
G. Paltauf,
H. P. Weber, and
M. Frenz,
“Optoacoustic imaging using a three-dimensional reconstruction algorithm,”
IEEE J. Sel. Top. Quantum Electron., 7 918
–923
(2001). https://doi.org/10.1109/2944.983294 1077-260X Google Scholar
X. Wang,
Y. Pang,
G. Ku,
X. Xie,
G. Stoica, and
L. V. Wang,
“Non-invasive laser-induced photoacoustic tomography for structural and functional imaging of the brain in vivo,”
Nat. Biotechnol., 21 803
–806
(2003). https://doi.org/10.1038/nbt839 1087-0156 Google Scholar
M. Xu and
L. V. Wang,
“Biomedical photoacoustics,”
Rev. Sci. Instrum., 77 041101
(2006). https://doi.org/10.1063/1.2195024 0034-6748 Google Scholar
M. Xu and
L. V. Wang,
“Analytic explanation of spatial resolution related to bandwidth and detector aperture size in thermoacoustic or photoacoustic reconstruction,”
Phys. Rev. E, 67 056605
(2003). https://doi.org/10.1103/PhysRevE.67.056605 1063-651X Google Scholar
A. A. Oraevsky and
A. Karabutov,
“Ultimate sensitivity of time resolved opto-acoustic detection,”
Proc. SPIE, 3619 228
–239
(2000). https://doi.org/10.1117/12.386326 0277-786X Google Scholar
A. A. Oraevsky,
R. O. Esenaliev,
S. L. Jacques,
S. Thomsen, and
F. K. Tittel,
“Lateral and z-axial resolution in laser optoacoustic imaging with ultrasonic transducers,”
Proc. SPIE, 2389 198
–208
(1995). https://doi.org/10.1117/12.209986 0277-786X Google Scholar
A. A. Oraevsky,
R. O. Esenaliev,
S. L. Jacques, and
F. K. Tittel,
“Laser optic-acoustic tomography for medical diagnostics: principles,”
Proc. SPIE, 2676 22
–31
(1996). https://doi.org/10.1117/12.238786 0277-786X Google Scholar
G. Ku and
L. V. Wang,
“Scanning microwave-induced thermoacoustic tomography: signal, resolution, and contrast,”
Med. Phys., 28 4
–10
(2001). https://doi.org/10.1118/1.1333409 0094-2405 Google Scholar
M. Xu,
G. Ku, and
L. V. Wang,
“Microwave-induced thermacoustic tomography using multi-sector scanning,”
Med. Phys., 28 1958
–1963
(2001). https://doi.org/10.1118/1.1395037 0094-2405 Google Scholar
R. G. M. Kolkman,
E. Hondebrink,
W. Steenbergen, and
F. F. M. de Mul,
“In vivo photoacoustic imaging of blood vessels using an extreme-narrow aperture sensor,”
IEEE J. Sel. Top. Quantum Electron., 9 343
–346
(2003). https://doi.org/10.1109/JSTQE.2003.813302 1077-260X Google Scholar
R. G. M. Kolkman,
E. Hondebrink,
W. Steenbergen,
T. G. van Leeuwen, and
F. F. M. de Mul,
“Photoacoustic imaging of blood vessels with a double-ring sensor featuring a narrow angular aperture,”
J. Biomed. Opt., 9 1327
–1335
(2004). https://doi.org/10.1117/1.1805556 1083-3668 Google Scholar
X. Yang,
M. L. Li, and
L. V. Wang,
“Ring-based ultrasonic virtual point detector with applications to photoacoustic tomography,”
Appl. Phys. Lett., 90 251103
(2007). https://doi.org/10.1063/1.2749856 0003-6951 Google Scholar
M. Xu,
Y. Xu, and
L. V. Wang,
“Time-domain reconstruction algorithms and numerical simulations for thermoacoustic tomography in various geometries,”
IEEE Trans. Biomed. Eng., 50 1086
–1099
(2003). https://doi.org/10.1109/TBME.2003.816081 0018-9294 Google Scholar
K. R. Castleman, Digital Image Processing, Prentice-Hall, Upper Saddle River, NJ (1996). Google Scholar
|


