
|
|
1.IntroductionFunctional near-infrared spectroscopy (fNIRS) is an effective technique for measuring brain activation. It has several advantages, such as portability, fewer physical restrictions, and greater practicality, compared with other imaging techniques. The concentrations of oxygenated and deoxygenated hemoglobin ([oxy-Hb] and [deoxy-Hb]) in tissues can be obtained by fNIRS based on changes in light absorption at multiple wavelengths.1, 2 In the late 1970s, Jöbsis first used near-infrared light to noninvasively measure oxygenation levels of the brain.3 In the early 1990s, fNIRS was developed to investigate human brain functions. 4, 5, 6, 7, 8 Since then, fNIRS has been widely used in the field of cognitive neuroscience, e.g., to study visual processing, 9, 10, 11, 12 auditory processing,13 somatosensory stimulation,12, 14 motor system functioning, 15, 16, 17, 18, 19 stroke rehabilitation, 20, 21, 22, 23, 24 Alzheimer’s disease,25, 26, 27 and schizophrenia.7, 28 Recently, it has been pointed out that in addition to reflecting the cerebral blood flow coupled with brain activation, fNIRS signals include the effects of cardiac pulsation, respiration, and blood pressure variation, as well as Mayer waves with a period of approximately , and other slower variations.29, 30 However, it has not been determined whether fNIRS signals include a signal representing changes in skin blood flow. This possibility needs to be investigated, because the scalp is involved in the high probability area in banana-shaped photon flux paths.31 The skin blood flow is changed by activation of the autonomic nervous system in response to thermal skin stimulation and mechanical skin irritation.32, 33, 34 If the time variation of the skin blood flow signal depends on a certain task, then time series analysis methods such as Fourier transform and wavelet transform would not be usable to separate the component related to skin blood flow from the fNIRS signals. However, independent component analysis (ICA) uses spatial patterns as well as temporal patterns for the analysis. The ICA algorithm transforms our experimental coordinate system into a new coordinate system that includes a nonorthogonal basis to find statistically independent components, though principal component analysis (PCA) always uses an orthogonal basis. Therefore, if the skin blood flow signal and the brain activity signals are statistically independent, it should be possible to use ICA to separate them from fNIRS signals by using spatial information about the fNIRS signals. ICA is a method for solving the blind source separation problem to find a linear coordinate system, such that the resulting signals are as statistically independent from each other as possible. 35, 36, 37, 38, 39, 40, 41, 42, 43, 44 Since the pioneering work of Makeig, Bell, and Sejnowski,45 ICA has been used as a good tool for analyzing temporal spatial data of functional magnetic resonance imaging (fMRI),46 magnetoencephalography (MEG),47, 48 EEG,49, 50 and fNIRS.51 In this study, we evaluated the following two questions. 1. Does the skin blood flow signal change depending on the task being performed? 2. Can ICA be used to separate the skin blood flow artifact from the fNIRS signals? 2.Materials and Methods2.1.Basis of the Modified Beer-Lambert Law of Functional Near-Infrared SpectroscopyFrom the modified Beer-Lambert law, the following equation is derived: where is the change in optical density measured at a given wavelength , is the corresponding extinction coefficient of the absorber, is the change in the absorber concentration, and is the optical path length in the activation region. When changes in absorption are related to changes in the chromophore concentrations of oxygenated and deoxygenated hemoglobin ( and ), Eq. 1 is rewritten aswhere and are the extinction coefficients of oxygenated and deoxygenated hemoglobin, respectively.For multiple measurements at three wavelengths (780, 805, and ), the following equation is derived from Eq. 2: Here, we assume that the path length is the same for every wavelength, because accurate estimation of is almost impossible with this technique. Although the wavelength dependence of can be predicted, the cross talk effect caused by the path-length difference among wavelengths is negligible when changes to be measured occur only in oxygenated and deoxygenated hemoglobin.52Then, with the extinction coefficients reported by Matcher, 2 the following equation is derived using the least-squares method: where the relative concentration changes ( oxy and deoxy) are expressed as the concentration changes ( and ) multiplied by the path length .2.2.Functional Near-Infrared Spectroscopic Imaging SystemWe used a 36-channel fNIRS imaging system with 12 source and 12 detector optodes (OMM-2001, Shimadzu Company, Kyoto, Japan).18, 19 The illuminator bundle quartz fiber (diameter ) of the fNIRS imaging system was connected to three laser diodes (780, 805, and ). After of dark signal acquisition, each laser diode sequentially emitted a 5-ms pulse of light, and the light emission then traveled to a source optode. The sequence of light emission from the 12 source optodes (T1 to T12) was programmable. 2.3.Flexible Adjustable Surface HolderHolder caps made from thermoplastic resin are typically used to hold the optodes of an fNIRS imaging system, because the distance between the source and detector optodes must be constant. However, not all of our subjects could properly fit a cap onto their heads because of size differences among the individuals. This caused deterioration in the signal-to-noise ratio (SNR) and lowered the data reliability. We therefore developed a flexible adjustable surface holder (FLASH) to solve these problems [Fig. 1a ]. Fig. 1Arrangement of fNIRS optodes and locomotor tasks. (a) Arrangement of source and detector optodes with the flexible adjustable surface holder (FLASH). (b) Locomotor tasks on the treadmill. Changes in hemodynamic response in the front-parietal area of healthy subjects were simultaneously recorded using an fNIRS imaging system (OMM-2001) and a laser Doppler tissue blood flow meter (FLO-C1). (c) Configuration of source and detector optodes in this study. (d) 24 optodes (12 source and 12 detector optodes) that enabled 36-channel recording were applied to the scalp of the front-parietal area. 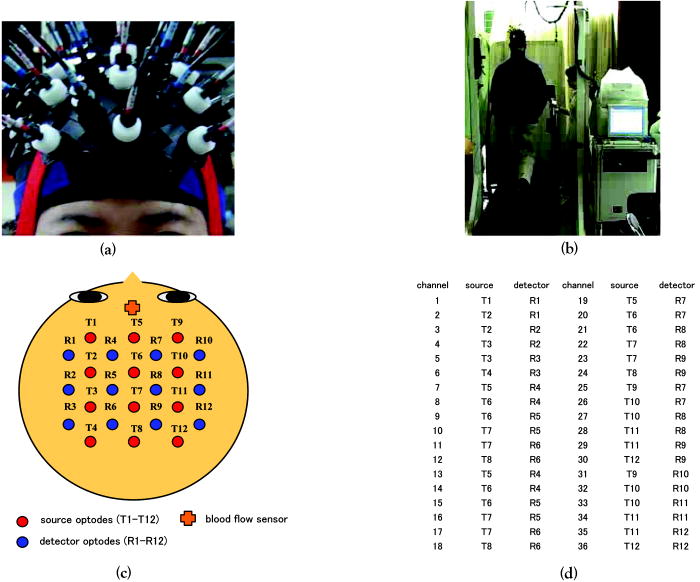 The basic structure of the FLASH consists of sides and nodes making up triangles or quadrangles. Optode sockets are located on the nodes. The material of the sides is flexible, but not stretchable. The sum of the interior angles can be changed by allowing deflection of the sides and their rotation at the socket positions. Therefore, the FLASH shape can be defined by setting the interior angles at the sockets based on the Gauss-Bonnet theorem. We could thus change the FLASH shape and size to fit the various head shapes of our subjects without changing the distance between the source and detector. 2.4.Theory of the Laser Doppler Tissue Blood Flow MeterA laser Doppler tissue blood flow meter (FLO-C1 Omegawave Incorporated, Tokyo, Japan) measures tissue blood flow continuously and noninvasively at a detection depth of approximately from the tissue surface. The tissue is irradiated by laser light delivered through an optical fiber, and the light is scattered many times in the tissue. Some of the photons are scattered by erythrocytes in the tissue, and the light frequency shifts depending on the velocity of the erythrocyte movement. In addition, the amplitude of the scattered light is proportional to the volume of erythrocytes in the tissue. Blood flow signals are obtained from the frequency shift and its amplitude. 2.5.MeasurementsWe chose to use a locomotor task for this study, because skin blood flow is changed by thermal skin stimulation. To answer our first question, we designed a 9-km/h locomotor task on a treadmill [Fig. 1b] that was expected to evoke large changes in the skin blood flow signal. The skin blood flows in the foreheads of healthy human subjects were measured using the laser Doppler tissue blood flow meter. A block design consisting of prerest , task , and postrest with three repetitions was used as the protocol. Six right-handed, healthy males who were 37 to 52 years of age participated in the study. The sensor of the laser tissue blood flow meter was located at the center of the forehead, above the eyebrow line. We set the sampling rate of the laser Doppler tissue blood flow meter to . The 9-km/h speed chosen for the locomotor task was an experimental maneuver to get reproducible results for our first question. Though a paper using a 9-km/h locomotor task has been published,19 little knowledge about the brain signal was obtained compared with the use of a 3-km/h task. In addition, the task was excessive and susceptible to motion artifacts. Therefore, to answer our second question, during a 3-km/h locomotor task on a treadmill, changes in the hemodynamic response in the front-parietal area of two right-handed, healthy males were simultaneously recorded using the fNIRS imaging system and the laser Doppler tissue blood flow meter. ICA was applied to the fNIRS signals. A block design consisting of prerest , task , and postrest with three repetitions was used as the protocol. 24 optodes (12 source and 12 detector optodes), enabling 36-channel recording, were applied to each subject’s scalp [Figs. 1c and 1d]. The source optode (T8) next to the posterior one in the center row was located in the Cz portion based on the international 10 to 20 system for electroencephalogram electrode placement.53 The interoptode distance was set to . The sensor of the laser tissue blood flow meter was located at the center of the forehead, above the eyebrow line. To reveal the influence of white noise, it was input into channels 30 and 36, because they were not located within an area of interest during the locomotor task. We acquired data by sequentially emitting laser light from T1 to T12 in numerical order. Thus, the fNIRS time resolution was (see Sec. 2.2). In addition, we set the sampling rate of the laser Doppler tissue blood flow meter to , because the fNIRS time resolution was . The study protocol was approved by the local ethics committee. Before the experiments, written informed consent was obtained from the subjects after they had received a complete description of the study. 2.6.Independent Component AnalysisICA assumes that the observed data vector is a linear combination of unknown and statistically independent sources . The mixing matrix describing the linear combination of is given by , such that The algorithms must find a separating or demixing matrix , such that which is given by the set of observed values in .The ICA algorithm proposed by Molgedey and Schuster (MS-ICA)40 decomposes -channel data into independent components, each of which corresponds to a recovered putative source that contributes to fNIRS signals. The main advantage of MS-ICA is its noniterative nature, and hence its high speed, but it is not directly guaranteed to minimize the likelihood. MS-ICA exploits the time coherence of the source signals to decompose the mixture of sources. It finds by minimizing the sum-squared cross-correlations between one component at time and another component at time , across a set of time delays.43 For various time delays, MS-ICA has been shown to be robust when the SNR is relatively poor.54 We applied MS-ICA to the 36 channels of fNIRS signals. The ICA algorithm used here was implemented by ourselves. In the present study, the following time delays were tested: , 0.38, 0.57, 0.76, 0.95, 1.04, 1.33, 1.52, 1.71, 1.90, 2.19, 2.38, 2.57, 2.76, 2.95, 3.04, 3.33, 3.52, 3.71, and 3.80. They were chosen to cover a reasonably wide interval without extending beyond the support of the autocorrelation function. 3.Results and Discussion3.1.Skin Blood FlowWhen we measured the skin blood flow in the forehead of six right-handed, healthy males during a 9-km/h locomotor task with a laser Doppler tissue blood flow meter (Fig. 2 ), we clearly observed changes in the skin blood flow signal depending on the task being performed for all subjects ( for all subjects). The statistical evaluation was based on a least-squares estimation using the general linear model. The design matrix was generated with a box-car function convolved with a Gaussian kernel of dispersion with a full width at half maximum of . Fig. 2One representative example of changes in the skin blood flow during a 9-km/h locomotor task on a treadmill. The skin blood flow on the forehead of healthy human subjects was monitored with a laser Doppler tissue blood flow meter. The skin blood signal changes depending on the task performed were observed for all subjects ( for all subjects). 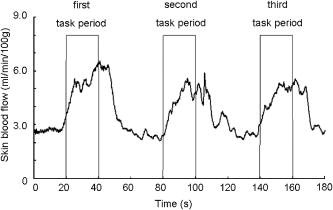 When we measured the skin blood flow in the forehead of two right-handed, healthy males during a 3-km/h locomotor task, we observed changes in skin blood flow signal depending on the task being performed. The skin blood flow signal of one subject showed large increases with almost the same amplitude during all three task periods. However, the skin blood flow signal of another subject showed small increases during the first and second task periods, but a large increase during the third task period (Fig. 3 ). These results suggest that the skin blood flow was not always directly related to the locomotor task, but was indirectly related to the task via the autonomic nerve system. This observation supports the idea that changes in skin blood flow are caused by changes in skin temperature and sweating.32, 33, 34 Fig. 3One example of changes in skin blood flow during a 3-km/h locomotor task. The blood flow on the forehead of a healthy subject was monitored with a laser Doppler tissue blood flow meter. In this example, the skin blood flow signal showed small increases during the first and second task periods, but a large increase during the third task period.  3.2.Independent Component Signals of the Functional Near-Infrared Spectroscopic SignalsDuring brain activation, an increase in the regional cerebral blood flow accompanies an increase in oxygenated hemoglobin. 4, 5, 6, 7, 8 Therefore, we analyzed the time course of calculated from fNIRS data measured simultaneously with the skin blood flow shown in Fig. 3. Figure 4a shows a time course of of a representative channel [channel 23 in Figs. 1c and 1d] corresponding to a foot area within the primary motor cortex. Figure 4b shows the power spectrum in the frequency range from 0 to in Fig. 4a calculated by Fourier transform. Figure 4c shows the power spectrum in the frequency range from 0.2 to in Fig. 4a calculated by Fourier transform. A large peak was found at around , which corresponded to the frequency calculated from our locomotor task period (i.e., ), and would express the changes in skin blood flow as well as brain activation, depending on the task being performed. In addition, some peaks were found at around [low frequency oscillations, (LFO)] and [very low frequency oscillation, (VLFO)].29 The cardiac pulsation frequency in our locomotor task was found to be in the frequency range from 1.5 to , but the respiration frequency was not found to be in the frequency range from 0.2 to . It is reasonable to hypothesize that changes in the skin blood flow and the regional cerebral blood signal are statistically independent, because these innervations are completely different. Hence, if the fNIRS signals included both changes in skin blood flow and cerebral blood signal, the signal changes from the two blood signals should have been separated by ICA. Even if changes in skin blood flow were dependent on the cerebral blood signal in our experimental coordinate system, ICA would have caused their interference to vanish in the new coordinate system generated ICA, because we hypothesize that they are statistically independent. The validity of the hypothesis will be checked by the consistency of the results. To remove various noises in fNIRS signals, it might be effective to use some processing such as filtering before ICA. However, the use of data processing other than ICA would not clarify the logical consequence of ICA. The data processing might distort the fNIRS signals. Therefore, only the MS-ICA algorithm, which is robust against noise, was used without filtering, smoothing, or baseline correction before the ICA. We processed the time courses of of the 36 channels using MS-ICA. The relevant color maps of a mixing matrix and the signal corresponding to independent components separated by the ICA are shown in Figs. 5 and 6 , respectively. Each color map in Fig. 5 represents the activated spatial distribution of the corresponding component, and the distribution corresponds to the arrangement of fNIRS channels shown in Figs. 1c and 1d. Note that they are spatial patterns without temporal information. The activated spatial distributions of components 1 and 3 in Fig. 5 were localized in the areas corresponding to channels 30 and 36, into which white noise was input. The results of spectral analysis for the corresponding components in Fig. 6 did not reveal any peaks. Therefore, we speculate that the components of the white noise were separated by ICA. The activated spatial distributions of components 2, 4, 6, 7, 9, and 11 in Fig. 5 show some characteristic patterns. The results of spectral analysis for the corresponding components in Fig. 6 had one or two peaks around (data not shown). Some of these components seem to be task dependent. They may be interpreted as some independent components by the difference in brain function. However, in the present study, we focused on determining the component related to changes in skin blood flow to remove it as an artifact instead of investigating all the components. Fig. 4Original time course of [defined by Eq. 4] and its power spectrum. (a) Time course of of a representative channel [channel 23 shown in Figs. 1c and 1d] corresponding to a foot area within the primary motor cortex. (b) The power spectrum (0 to ) of Fig. 4a calculated by Fourier transform. A large peak was found at around , which is the frequency calculated from our locomotor task period (i.e., ). This large peak would express the changes in skin blood flow as well as brain activation depending on the task being performed. Some peaks were found at around [low frequency oscillations, (LFO)] and [very low frequency oscillation, (VLFO)]. LFO is probably related to blood pressure variations, heat-rate oscillations, and Mayers waves. (c) Power spectrum (0.2 to ) of Fig. 4a calculated by Fourier transform. The cardiac pulsation frequency in our locomotor task was found to be in the frequency range from 1.5 to , but the respiration frequency was not found to be in the frequency range from 0.2 to .  Fig. 5Relevant color maps of a mixing matrix corresponding to independent components of [defined by Eq. 4] separated by MS-ICA. The component number does not have any special meaning. Each color map represents the activated spatial distribution of the corresponding component, and the distribution corresponds to the arrangement of fNIRS channels shown in Figs. 1c and 1d. The broken lines show sections of each channel. Note that these maps are spatial patterns without temporal information. The activated spatial distributions of components 1 and 3 were localized in the areas corresponding to channels 30 and 36, into which white noise was input. The activated spatial distributions of components 2, 4, 6, 7, 9, and 11 show some characteristic patterns. Interestingly, the activated spatial distribution of component 2 revealed an overall increase in the channels. 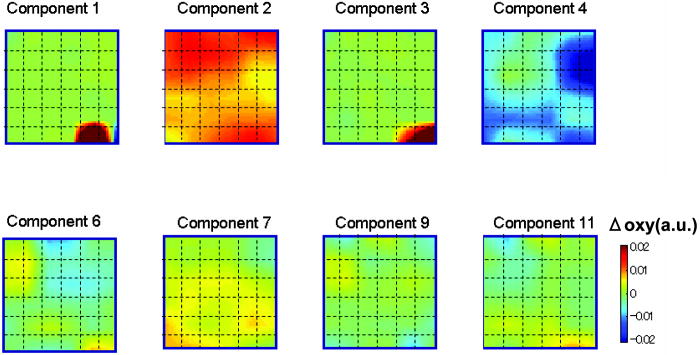 Fig. 6Relevant independent component signal of [defined by Eq. 4] separated by MS-ICA. The component number corresponds to that of Fig. 5. Note that these graphs are temporal patterns without spatial information. The results of spectral analysis for components 1 and 3 did not give any peaks (data not shown). Their components of white noise may have been separated by ICA. The results of spectral analysis for the components 2, 4, 6, 7, 9, and 11 had one or two peaks around (data not shown). Some of these components seem to be task dependent. They may be interpreted as some independent components by the difference in brain function in the cerebral blood signal. 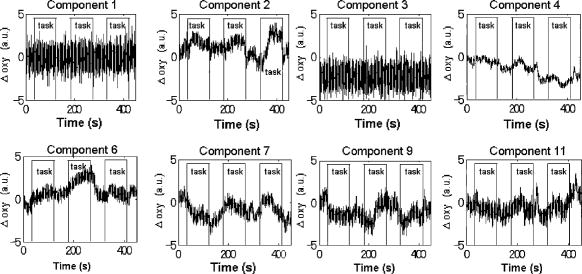 3.3.New Statistical Value to Find Skin Blood FlowInterestingly, the activated spatial distribution of component 2 in Fig. 5 revealed an overall increase in the channels. We speculate that the spatial distribution of the skin blood flow signals is not localized from the viewpoint of the zone of autonomic innervation, in contrast to brain activity signals in the motor area, because the skin blood flow is easily affected by activation of the autonomic nervous system.32, 33, 34 Therefore, it seems that component 2 is related to changes in the skin blood flow. To evaluate the activated spatial distributions of all components, we have defined a new statistical value, the coefficient of spatial uniformity (CSU): where and are, respectively, the arithmetic mean and standard deviation of each column from the mixing matrix and stands for the column number.Figure 7 shows the trend of the CSU values of the activated spatial distributions of all components in Fig. 5 [the column data of mixing matrix was calculated using Eq. 7]. The CSU value corresponding to component 2 was a highly discriminating value (2.82) compared with the values of the other components (the second highest value: 1.41). In another subject, the highest value of the CSU was also a highly discriminating value (2.74) compared with the values of the other components (the second highest value was 1.37). These results suggest that the component related to the skin blood flow can be selected through CSU values using the column data of the mixing matrix obtained by ICA. Fig. 7Bar graph in the coefficient of spatial uniformity (CSU) values of the activated spatial distributions of all components in Fig. 5 [the column data of mixing matrix was calculated using Eq. 7]. The CSU value corresponding to component 2 was a highly discriminating value (2.82) compared with the values of the other components (the second highest value: 1.41).  3.4.Comparison of Skin Blood Flow Signal and Independent Component Analysis ComponentsThe independent component signal of component 2 was compared with changes in the skin blood flow measured with a laser Doppler tissue blood flow meter (Fig. 8 ). Data have been normalized to the maximum change. The wave shape and dip timing of component 2 [Fig. 8b] were very similar to those of the skin blood flow [Fig. 8a]. This was surprising, because component 2 was derived by only ICA (statistical independence), without using any information such as task timing. The time resolution of the skin blood flow signal measured with the laser Doppler tissue blood flow meter and that of the fNIRS signals was 0.20 and , respectively. The coefficient of correlation was 0.724, indicating strong correlation between component 2 and changes in the skin blood flow. For another subject, the coefficient of correlation was 0.789. Fig. 8Comparison of skin blood flow signal and component-2 signal separated by ICA. Data have been normalized to the maximum change. (a) Changes in the skin blood flow measured by a laser Doppler tissue blood flow meter (corresponding to that in Fig. 3). (b) Independent component signal of component 2 separated by MS-ICA (corresponding to component 2 in Fig. 6).  3.5.Removal of the Skin Blood Flow Signal from Functional Near-Infrared Spectroscopic DataTime course changes in the fNIRS signals and the mapping image can be reconstructed with a particular component eliminated from the original fNIRS time course by substituting zero in the corresponding column of in Eq. 5. The original map of the change in oxygenated hemoglobin and its reconstructed map at approximately are compared in Fig. 9. With component 2 eliminated, the activation of the premotor and medial somatosensory areas can be seen more clearly [Fig. 9b]. This suggests that ICA is useful for removing the skin blood flow artifact. Furthermore, eliminating components 1, 2, 3, 5, 8, 10, and 12 to 36 reduced the white noise localized in the areas corresponding to channels 30 and 36 [Fig. 9c]. Thus, ICA seems to be a powerful tool for improving the specificity of fNIRS mapping. However, further studies are needed to establish criteria for removing several signal components other than cerebral blood activity. Fig. 9Comparison of original and reconstructed maps of changes in [defined by Eq. 4] at approximately . (a) Original map of oxygenated hemoglobin. (b) Reconstructed map from which component 2, representing the component related to skin blood flow, was eliminated. The brain activity areas around the premotor and medial somatosensory were more localized after component 2 was removed. (c) Reconstructed map in which components 1, 2, 3, 5, 8, 10, and 12 to 36 were eliminated. The broken lines show sections of each channel.  4.ConclusionThrough this study, we demonstrate that ICA is a useful method for removing the skin blood flow artifact from original fNIRS signals. Furthermore, our statistical parameter using the column data of mixing matrix by ICA should enable the automatic removal of the skin blood flow artifact by fNIRS signals themselves. ReferencesA. Seiyama,
O. Hazeki, and
M. Tamura,
“Noninvasive quantitative analysis of blood oxygenation in rat skeletal muscle,”
J. Biochem. (Tokyo), 102 419
–424
(1988). 0021-924X Google Scholar
S. J. Matcher,
C. E. Elwell,
C. E. Cooper,
M. Cope, and
D. T. Delpy,
“Performance comparison of several published tissue near-infrared spectroscopy algorithms,”
Anal. Biochem., 227 54
–68
(1995). https://doi.org/10.1006/abio.1995.1252 0003-2697 Google Scholar
F. F. Jobsis,
“Noninvasive infrared monitoring of cerebral and myocardial sufficiency and circulatory parameters,”
Science, 198 1264
–1267
(1977). https://doi.org/10.1126/science.929199 0036-8075 Google Scholar
B. Chance,
Z. Zhuang,
C. UnAh,
C. Alter, and
L. Lipton,
“Cognitive activated low frequency modulation of light absorption in human brain,”
Proc. Natl. Acad. Sci. U.S.A., 90 3770
–3774
(1993). https://doi.org/10.1073/pnas.90.8.3770 0027-8424 Google Scholar
Y. Hoshi and
M. Tamura,
“Detection of dynamic changes in cerebral oxygenation coupled to neuronal function during mental work in man,”
Neurosci. Lett., 150 5
–8
(1993). https://doi.org/10.1016/0304-3940(93)90094-2 0304-3940 Google Scholar
T. Kato,
A. Kamei,
S. Takahashi, and
T. Ozaki,
“Human visual cortical function during photonic stimulation monitoring by means of near-infrared spectroscopy,”
J. Cereb. Blood Flow Metab., 13 516
–520
(1933). 0271-678X Google Scholar
F. Okada,
Y. Tokumitsu,
Y. Hoshi, and
M. Tamura,
“Impaired interhemispheric integration in brain oxygenation and hemodynamics in schizophrenia,”
Eur. Arch. Psychiatry Clin. Neurosci., 244 17
–25
(1994). 0940-1334 Google Scholar
A. Villringer,
J. Planck,
C. Hock,
L. Schleinkofer, and
U. Dirnagl,
“Near infrared spectroscopy (NIRS): a new tool to study hemodynamic changes during activation of brain function in human adults,”
Neurosci. Lett., 154 101
–104
(1993). https://doi.org/10.1016/0304-3940(93)90181-J 0304-3940 Google Scholar
H. R. Heekeren,
H. Obrig,
R. Wenzel,
K. Eberle,
J. Ruben,
K. Villringer,
R. Kurth, and
A. Villringer,
“Cerebral haemoglobin oxygenation during sustained visual stimulation—a near-infrared spectroscopy study,”
Philos. Trans. R. Soc. London, Ser. B, 352 743
–750
(1977). https://doi.org/10.1098/rstb.1997.0057 0962-8436 Google Scholar
J. H. Meek,
C. E. Elwell,
M. J. Khan,
J. Romaya,
J. S. Wyatt,
D. T. Delpy, and
S. Zeki,
“Regional changes in cerebral haemodynamics as a result of a visual stimulus measured by near-infrared spectroscopy,”
Proc. R. Soc. London, Ser. B, 261 351
–356
(1995). https://doi.org/10.1098/rspb.1995.0158 0962-8452 Google Scholar
J. Ruben,
R. Wenzel,
H. Obrig,
K. Villringer,
J. Bernarding,
C. Hirth,
H. Heekeren,
U. Dirnagl, and
A. Villringer,
“Haemoglobin oxygenation changes during visual stimulation in the occipital cortex,”
Adv. Exp. Med. Biol., 428 181
–187
(1997). 0065-2598 Google Scholar
A. Seiyama,
J. Seki,
H. C. Tanabe,
I. Sase,
A. Takatsuki,
S. Miyauchi,
H. Eda,
S. Hayashi,
T. Imaruoka,
T. Iwakura, and
T. Yanagida,
“Circulatory basis of fMRI signals: relationship between changes in the hemodynamic parameters and BOLD signal intensity,”
Neuroimage, 21 1204
–1214
(2004). 1053-8119 Google Scholar
K. Sakatani,
S. Chen,
W. Lichty,
H. Zuo, and
Y. P. Wang,
“Cerebral blood oxygenation changes induced by auditory stimulation in newborn infants measured by near infrared spectroscopy,”
Early Hum. Dev., 55 229
–236
(1999). https://doi.org/10.1016/S0378-3782(99)00019-5 0378-3782 Google Scholar
H. Obrig,
C. Hirth,
J. G. Junge-Hulsing,
C. Doge,
T. Wolf,
U. Dirnagl, and
A. Villringer,
“Cerebral oxygenation changes in response to motor stimulation,”
J. Appl. Physiol., 81 1174
–1183
(1996). 8750-7587 Google Scholar
W. N. Colier,
V. Quaresima,
B. Oeseburg, and
M. Ferrari,
“Human motor-cortex oxygenation changes induced by cyclic coupled movements of hand and foot,”
Exp. Brain Res., 129 457
–461
(1999). https://doi.org/10.1007/s002210050913 0014-4819 Google Scholar
C. Hirth,
H. Obrig,
K. Villringer,
A. Thiel,
J. Bernarding,
W. Muhlnickel,
H. Flor,
U. Dirnagl, and
A. Villringer,
“Non-invasive functional mapping of the human motor cortex using near-infrared spectroscopy,”
NeuroReport, 7 1977
–1981
(1996). https://doi.org/10.1097/00001756-199608120-00024 0959-4965 Google Scholar
A. Kleinschmidt,
H. Obrig,
M. Requardt,
K. D. Merboldt,
U. Dirnagl,
A. Villringer, and
J. Frahm,
“Simultaneous recording of cerebral blood oxygenation changes during human brain activation by magnetic resonance imaging and near-infrared spectroscopy,”
J. Cereb. Blood Flow Metab., 16 817
–826
(1996). https://doi.org/10.1097/00004647-199609000-00006 0271-678X Google Scholar
I. Miyai,
H. C. Tanabe,
I. Sase,
H. Eda,
I. Oda,
I. Konishi,
Y. Tsunazawa,
T. Suzuki,
T. Yanagida, and
K. Kubota,
“Cortical mapping of gait in humans: a near-infrared spectroscopic topography study,”
Neuroimage, 14 1186
–1192
(2001). 1053-8119 Google Scholar
M. Suzuki,
I. Miyai,
T. Ono,
I. Oda,
I. Konishi,
T. Kochiyama, and
K. Kubota,
“Prefrontal and premotor cortices are involved in adapting walking and running speed on the treadmill: an optical imaging study,”
Neuroimage, 23 1020
–1026
(2004). 1053-8119 Google Scholar
W. G. Chen,
P. C. Li,
Q. M. Luo,
S. Q. Zeng, and
B. Hu,
“Hemodynamic assessment of ischemic stroke with near-infrared spectroscopy,”
Space Med. Med. Eng. (Beijing), 13 84
–89
(2000). Google Scholar
I. Miyai,
H. Yagura,
I. Oda,
I. Konishi,
H. Eda,
T. Suzuki, and
K. Kubota,
“Premotor cortex is involved in restoration of gait in stroke,”
Ann. Neurol., 52 188
–194
(2002). https://doi.org/10.1002/ana.10274 0364-5134 Google Scholar
E. M. Nemoto,
H. Yonas, and
A. Kassam,
“Clinical experience with cerebral oximetry in stroke and cardiac arrest,”
Crit. Care Med., 28 1052
–1054
(2000). 0090-3493 Google Scholar
H. Saitou,
H. Yanagi,
S. Hara,
S. Tsuchiya, and
S. Tomura,
“Cerebral blood volume and oxygenation among poststroke hemiplegic patients: effects of 13 rehabilitation tasks measured by near-infrared spectroscopy,”
Arch. Phys. Med. Rehabil., 81 1348
–1356
(2000). https://doi.org/10.1053/apmr.2000.9400 0003-9993 Google Scholar
F. Vernieri,
N. Rosato,
F. Pauri,
F. Tibuzzi,
F. Passarelli, and
P. M. Rossini,
“Near infrared spectroscopy and transcranial Doppler in monohemispheric stroke,”
Eur. Neurol., 41 159
–162
(1999). 0014-3022 Google Scholar
A. J. Fallgatter,
M. Roesler,
L. Sitzmann,
A. Heidrich,
T. J. Mueller, and
W. K. Strik,
“Loss of functional hemispheric asymmetry in Alzheimer’s dementia assessed with near-infrared spectroscopy,”
Brain Res. Cognit. Brain Res., 6 67
–72
(1997). https://doi.org/10.1016/S0926-6410(97)00016-5 0926-6410 Google Scholar
E. B. Hanlon,
I. Itzkan,
R. R. Dasari,
M. S. Feld,
R. J. Ferrante,
A. C. McKee,
D. Lathi, and
N. W. Kowall,
“Near-infrared fluorescence spectroscopy detects Alzheimer’s disease in vitro,”
Photochem. Photobiol., 70 236
–242
(1999). https://doi.org/10.1562/0031-8655(1999)070<0236:NIFSDA>2.3.CO;2 0031-8655 Google Scholar
C. Hock,
K. Villringer,
F. Muller-Spahn,
M. Hofmann,
S. Schuh-Hofer,
H. Heekeren,
R. Wenzel,
U. Dirnagl, and
A. Villringer,
“Near-infrared spectroscopy in the diagnosis of Alzheimer’s disease,”
Ann. N.Y. Acad. Sci., 777 22
–29
(1996). https://doi.org/10.1111/j.1749-6632.1996.tb34397.x 0077-8923 Google Scholar
A. J. Fallgatter and
W. K. Strik,
“Reduced frontal functional asymmetry in schizophrenia during a cued continuous performance test assessed with near-infrared spectroscopy,”
Shizophr. Bull., 26 913
–919
(2000). Google Scholar
H. Obrig,
M. Neufang,
R. Wenzel,
M. Kohl,
J. Steinbrink,
K. Einhaupl, and
A. Villringer,
“Spontaneous low frequency oscillations of cerebral hemodynamics and metabolism in human adults,”
Neuroimage, 12 623
–639
(2000). 1053-8119 Google Scholar
D. A. Boas,
A. M. Dale, and
M. A. Franceschini,
“Diffuse optical imaging of brain activation: approaches to optimizing image, sensitivity, resolution, and accuracy,”
Neuroimage, 23 S275
–S288
(2004). 1053-8119 Google Scholar
W. Cui,
C. Kumar, and
B. Chance,
“Experimental study of migration depth for the photons measured at sample surface. Time-resolved spectroscopy and imaging of tissue,”
Proc. SPIE, 1431 180
–191
(1991). https://doi.org/10.1117/12.44189 0277-786X Google Scholar
D. Bauer,
R. Grebe, and
A. Ehrlacher,
“A new method to model change in cutaneous blood flow due to mechanical skin irritation, part I: comparison between experimental and numerical data,”
J. Theor. Biol., 238 575
–587
(2006). 0022-5193 Google Scholar
G. Scremin and
W. Larry Kenney,
“Aging and the skin blood flow response to the unloading of baroreceptors during heat and cold stress,”
J. Appl. Physiol., 96 1019
–1025
(2003). https://doi.org/10.1152/japplphysiol.00928.2003 8750-7587 Google Scholar
S. M. C. Lee,
W. J. Williams, and
S. M. Schneider,
“Role of skin blood flow and sweating rate in exercise thermoregulation after bed rest,”
J. Appl. Physiol., 92 2026
–2034
(2002). 8750-7587 Google Scholar
C. Jutten and
J. Heraut,
“Separation of sources, part I,”
Signal Process., 24
(1), 1
–10
(1991). https://doi.org/10.1016/0165-1684(91)90079-X 0165-1684 Google Scholar
A. J. Bell and
T. J. Sejnowski,
“An information maximization approach to blind separation and blind deconvolution,”
Neural Comput., 7 1129
–1159
(1995). 0899-7667 Google Scholar
S. Amari,
A. Cichocki, and
H. H. Yang,
“A new learning algorithm for blind signal separation,”
Adv. Neural Inf. Process. Syst., 8 757
–763
(1996). 1049-5258 Google Scholar
J. F. Cardoso and
B. Laheld,
“Equivariant adaptive source separation,”
IEEE Trans. Signal Process., 44
(12), 3017
–3030
(1996). https://doi.org/10.1109/78.553476 1053-587X Google Scholar
M. Girolami and
C. Fyfe,
“Negentropy and kurtosis as projection pursuit indices provide generalized ICA algorithms,”
NIPS’96 Workshop, Blind Signal Processing,
(1996) Google Scholar
L. Molgedey and
H. G. Schuster,
“Separation of a mixture of independent signals using time delayed correlations,”
Phys. Rev. Lett., 72
(23), 3634
–3637
(1994). https://doi.org/10.1103/PhysRevLett.72.3634 0031-9007 Google Scholar
A. Hyvarinen and
E. Oja,
“A fast fixed-point algorithm for independent component analysis,”
Neural Comput., 9 1483
–1492
(1997). https://doi.org/10.1162/neco.1997.9.7.1483 0899-7667 Google Scholar
P. Common,
“Independent component analysis a new concept?,”
Signal Process., 36
(3), 287
–314
(1994). https://doi.org/10.1016/0165-1684(94)90029-9 0165-1684 Google Scholar
J. F. Cardoso and
A. Souloumiac,
“Jacobi angles for simultaneous diagonalization,”
JSIAM J. Matrix Anal. Appl., 17
(1), 161
–164
(1996). Google Scholar
K. Matsuoka,
M. Ohya, and
M. Kawamoto,
“A neural net for blind separation of nonstationary signals,”
Neural Networks, 8
(3), 411
–419
(1995). https://doi.org/10.1016/0893-6080(94)00083-X 0893-6080 Google Scholar
S. Makeig,
A. J. Bell, and
T. J. Sejnowski,
“Independent component analysis of electroencephalographic data,”
Adv. Neural Inf. Process. Syst., 8 145
–151
(1996). 1049-5258 Google Scholar
M. J. McKeown,
S. Makeig,
G. G. Brown,
T. P. Jung,
S. S. Kindermann,
A. J. Bell, and
T. J. Sejnowski,
“Analysis of fMRI data by blind separation into independent spatial components,”
Hum. Brain Mapp, 6 160
–188
(1998). 1065-9471 Google Scholar
J. Cao,
N. Murata,
S. Amari,
A. Cichocki,
T. Takeda,
H. Endo, and
N. Harada,
“Single-trial magnetoencephalographic data decomposition and localization based on independent component analysis approach,”
IEICE Trans. Fundam. Electron. Commun. Comput. Sco., 9 1757
–1766
(2000) Google Scholar
A. Ziehe,
G. Nolte,
T. Sander,
K. R. Muller, and
G. Curio,
“Artifact reduction in magnetoneurography based on time-delayed second-order correlations,”
IEEE Trans. Biomed. Eng., 47
(1), 75
–87
(2000). https://doi.org/10.1109/10.817622 0018-9294 Google Scholar
A. Delorme,
S. Makeig, and
T. Sejnowski,
“Automatic artifact rejection for EEG data using high-order statistics and independent component analysis,”
457
–462
(2001). Google Scholar
S. Vorobyov and
A. Cichocki,
“Blind noise reduction for multisensory signals using ICA and subspace filtering, with application to EEG analysis,”
Biol. Cybern., 86 293
–303
(2002). https://doi.org/10.1007/s00422-001-0298-6 0340-1200 Google Scholar
G. Morren,
U. Wolf,
P. Lemmerling,
M. Wolf,
J. H. Choi,
E. Gratton,
L. De Lathauwer, and
S. Van Huffel,
“Detection of fast neuronal signals in the motor cortex from functional near infrared spectroscopy measurements using independent component analysis,”
Med. Biol. Eng. Comput., 42 92
–99
(2004). 0140-0118 Google Scholar
K. Uludag,
M. Kohl,
J. Steinbrink,
H. Obrig, and
A. Villringer,
“Cross talk in the Lambert-Beer calculation for near-infrared wavelengths estimated by Monte Carlo simulations,”
J. Biomed. Opt., 7
(1), 51
–59
(2002). https://doi.org/10.1117/1.1427048 1083-3668 Google Scholar
H. H. Jasper,
“The ten-twenty electrode system of the International Federation,”
Electroencephalogr. Clin. Neurophysiol., 10 367
–380
(1958). 0013-4649 Google Scholar
A. Belouchrani,
K. Abed-Meraim,
J. Cardoso, and
E. Moulines,
“A blind source separation technique using second-order statistics,”
IEEE Trans. Signal Process., 45 434
–444
(1997). https://doi.org/10.1109/78.554307 1053-587X Google Scholar
|


