|
|
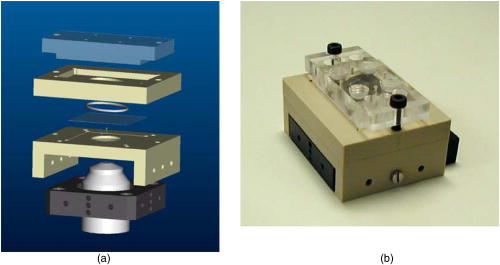
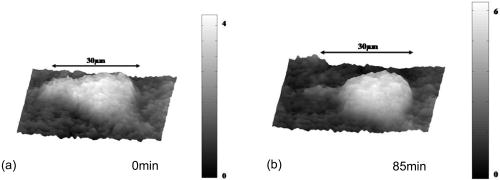
1.IntroductionCell biology research includes the functional analysis of cell growth, cell division, protein biosynthesis, and cell metabolism or investigation of target proteins in signal cascades responsible for severe or widespread diseases. Some of the cell biology processes are accompanied by the variation of the cell volume. Few of the cellular functions are based on volume regulatory processes, e.g., secretory processes of renal cells1 or certain capacities of hormones.2, 3 Transport systems for ions or organic compounds are related to volume regulations.4, 5, 6, 7 Therefore, the parameter cell volume could play an important role for investigations in cell biology. Some approaches exist addressing the measurement of cell volumes. Fluorescence techniques applying dyes accumulating in the cytoplasma or binding to membrane-specific probes allow a quantification the cell volume.7, 8, 9, 10, 11, 12 A dye in the culture medium as negative stain allows a noninvasive and time-dependent determination of thickness and volume of the cell.13 Although dyes like calcein or fluorescein used in experiments for cell swelling or shrinking are classified as in vivo dyes,14 measuring the cell thickness without any dye or marker molecule is preferable. Among other techniques avoiding labels such as interferometry15 or laser scanning reflection microscopy,16 digital holographic microscopy provides a convenient method since it is label-free, contactless, and applicable in vivo. Furthermore, it is rather fast, quantitative, and with a high resolution in the axial direction. Holography is a well-known technique, first proposed by Gabor in 1948.17 The idea of numerical reconstruction of holograms by the computer was formulated by Goodman and Lawrence in 1967.18 A considerable progress for the development of digital holography was the use of CCD cameras for the acquisition of holograms.19 For the investigation of biological specimens like single cells or cell cultures, the approach of digital holographic microscopy (DHM) was an important milestone.20 In recent years, with these techniques, increasing activity in the analysis of biologic samples by DHM can be observed. Recent publications on DHM include, e.g., the real-time observation of cellular samples with fast DHM systems.21 Furthermore, it has been shown that larger biological specimen like heads of Drosophila melanogaster can be imaged by DHM.22 One of the restrictions of the application of DHM to biological samples is the uncertainty of the refractive index, because the refractive index inside the biological objects is usually not exactly known. A method for estimating the influence of the refractive index was reported by Rappaz and co-workers.23 We developed a digital holographic optical arrangement based on temporal phase shifting by an adjustable mirror mounted on a piezo element with an optically transparent fluidic chamber for monitoring the cytometry in exemplary processes like trypsinization, osmotic stress, or apoptosis to demonstrate the high potential of this technique. Contrary to phase-shifting imaging with active phase stabilization,24 our setup can be used in standard transmission cell microscopes without extensive vibration compensation. Although phase-imaging techniques employing common path interferometry report extremely low temporal fluctuations of the measured path lengths25 down to , they are suitable only for interferometric and not for in-line holographic imaging due to the fact that the zeroth diffraction order has to be spatially separated from higher orders. 2.Material and Methods2.1.Phase-Shifting Digital HolographyTo measure both the amplitude and the phase of a light wave after the passage of a semitransparent specimen, the amplitude of the superposition of the object wave with a reference wave (Fig. 1 ) is recorded. A microscope objective projects a laterally magnified image of the object with a sufficiently (in terms of the sensor pixel pitch) high magnification on the sensor plane. In addition to the magnification, the microscope objective introduces a quadratic phase term. In our experimental setup, the sample phase retardation is determined from three interferograms recorded with different, arbitrary random reference wave phases. Fig. 1Experimental setup for phase-shifting digital holography. PBS: polarizing beamsplitter; HWP: half wave plate.  A linearly polarized collimated beam of a diode laser ( , , Laser 2000, Weßling, Germany) passes an aspheric lens and is split into reference (R) and object beam (O) by a polarizing beam splitter (PBS) (Fig. 1). The object wave passes through a retarder plate (HWP), a condenser , the semitransparent object (cells within a medium in a fluidic chamber), and a microscope objective ( , ). The reference wave passes two lenses ( and ) before it is superimposed by means of a nonpolarizing beam splitter, and the interference pattern is recorded by a CCD camera (AVT Marlin, ). To maximize the interference contrast, the HWP transfers the polarization state of the object beam into the state of the reference beam. The path length of the reference beam can be changed by a linear translation piezo actuator. This allows recording digital holograms with varying reference wave phase. This setup has not been changed during all experiments. We recorded three images of the interference pattern with reference waves , . Assuming that the complex amplitude distribution of the object wave in the sensor plane is and the reference wave in this plane at the exposure is , the intensity distribution of the interferogram can be written as and the intensity differences between two subsequent interferograms asAs has been pointed out by Cai, 26 the distribution of can be assumed to be a spatially random distribution in a distance from the object where the Fresnel approximation holds true. In a setup including a microscope objective for object magnification, the quadratic phase term causes the phase distribution to be spread over many multiples of in any plane, and the assumption of a quasi random distribution of can be easily met by choosing a sufficiently large sampling area. The relative phases between the exposures can then be calculated according to Cai: with where ⟨⟩ denotes the average over a specified area and ∣∣ denotes absolute values. It is then feasible to determine the complex valued object amplitude from the set of linear equations obtained by inserting the values of the three relative phases into Eq. 1, an algorithm known as generalized phase shifting interferometry:26As a result of the statistical determination of the relative phases, laser drift or piezo hysteresis do not influence the correct reconstruction of the object phase. Contrary to approaches using spatial phase shifting in off-axis digital holography,27, 28 there is no need to suppress zero-order effects or make additional assumptions on the variation of the phases or amplitudes of object and reference wave that imply a reduction of the lateral resolution. For the following investigations of the biological specimen, only the phase term carries relevant information. Due to the periodicity of the -function, Eq. 5 results in an image of the phase distribution wrapped to the value range of , although the real phase exceeds these boundaries [Fig. 2a ]. To obtain a realistic result for , an unwrapping procedure is needed. For this purpose, the commercial phase unwrapping software “pv̱spua2” (Phasevision, UK) is used.29 The resulting phase distribution is mainly dominated by the quadratic phase term introduced by the microscope objective, while the information about the investigated specimen manifests only in small modulations [Fig. 2b]. After subtraction of a quadratic function determined by least-square fitting, the modulation introduced by the investigated specimen remains [Fig. 2c].2.2.Segmentation of Phase Images and Determination of Thickness and VolumeThe optical thickness of an investigated object correlates with the phase shift introduced by these objects. The phase values are displayed in an image of gray values. For determining a threshold for segmentation, the image is converted into a histogram: occurrence plotted versus gray value. The phase-shift value with the highest occurrence at low gray values is interpreted as the background value, while a second local maximum at higher gray values corresponds to the phase shifts introduced by the specimen in observation. The threshold value applied for the segmentation of the gray value image is set at the middle of the two maxima. Pixels with an intensity value above the threshold are assigned to the object, whereas pixels with a value below the threshold are assigned to the background. From the difference between the calculated phase in each pixel and the background phase value, the thickness can be evaluated according to Ref. 30: where denotes the thickness of the object, the wavelength, and , the refractive index of the object and the matrix, respectively.The total volume of the object is given by: with the phase shift for each pixel of the object, the mean background value, the pixel size of the CCD camera, the number of pixels covered by the object, and the magnification of the microscope objective. For calculation of the phase shift caused by the object, the background is subtracted from the phase value of the pixels covered by this object.2.3.Fluidic ChamberFor time-dependent biological measurements, a fluidic chamber has been designed, because changes of the cell morphology are induced by substances added to the cell medium or complete exchange of the medium. This chamber was constructed to meet the most important optical and biological requirements (Fig. 3 ). The applied microscope objectives are designed to be used with a cover glass with a standard thickness of . Thus, a coverslip has been integrated in the fluidic chamber to achieve best optical conditions. For cultivating and investigating the cells, autoclavable and biocompatible polyethyl ether ketone (PEEK) was chosen for the fluidic chamber. The coverslip was fixed between an o-ring made of biocompatible ethylene propylene diene monomer (EPDM) and the elliptically designed PEEK body. The lid, consisting of transparent polymethyl methacrylate (PMMA) with a elastic and transparent polydimethyl siloxane (PDMS) coating to seal the chamber, was purchased from GeSiM (Großerkmannsdorf, Germany), which is usually part of the commercially available MicCell. Since PDMS is in direct contact with the cell medium, a coverslip served as a lid for the cultivation process in the incubator. The elliptic fluidic chamber contains a volume of fluid and connects two inlets and two outlets of the MicCell channel plate where matching -UNF-28U fittings can be applied for exchanging the fluid by a peristaltic pump using silicone tubes of diam or pipettes for adding small volumes. Complete substitution of a fluid requires . Fetal calf serum (FCS, Biochrom, Berlin, Germany) was used to adhere cells on the coverslips. 2.4.Cell Lines and CultivationOligodendrocytes from rat eyes (American Type Tissue Collection) were cultivated in Dulbecco’s Modified Eagle Medium (DMEM, Invitrogen No. 11960-044) at and 5% . The preparation of the fluidic chamber was as follows: The coverslips of the fluidic chamber were cleaned twice for in boiling distilled water and subsequently rinsed with ethanol. After drying, they were coated with FCS and put into the chamber. The fluidic chamber was preheated to before cell seeding. To transfer the cells from the culture flask ( , Sarstedt, Nümbrecht, Germany) into the fluidic chamber, they were trypsinated using trypsin/ethylene diamine tetraacetate (EDTA). Trypsin was purchased from Difco No. 215240, USA. After , the solution was substituted by DMEM, including 8% FCS. of the cell suspension was seeded out into the fluidic chamber and subsequently filled with culture medium to . Then the fluidic chamber was incubated under culture conditions for to allow cell adhesion. Since temperature control was not integrated into the fluidic chamber, experiments were carried out at room temperature. To ensure that the measured effects are caused by the added substances, control experiments without stimuli have been carried out. The light source continuously illuminated the sample. The apoptosis control experiment was performed using the commercially available In Situ Cell Death Detection Kit, TMR Red, from Roche (No. 2156792) applying the TUNEL (TdT-mediated dUTP Nick End Labeling) principle. The TUNEL technology identifies apoptotic cells in situ by using terminal deoxynucleotidyl transferase (TdT) to label 3’OH ends of cleaved DNA with tetramethylrhodamine-dUTP (TMR-dUTP). The assay was carried out according to the supplier’s instructions. The cells fixed on a coverslip by ethanol were permeabilized in 0.1% Triton at for . Then the strand breaks of cleaved DNA were detected by incubating the cells with TMR-dUTP and TdT in a shaded humidity chamber at for . Last, the cells were washed with PBS, mounted with Vectashield medium, and read out by fluorescence microscopy. 3.Results3.1.Transparent Three-Dimensional Reference ChartFor the characterization of the optical arrangement and determination of the optical resolution, a reference chart with defined optical and spatial parameters has been developed by thin-film technology. A 1951 USAF resolution chart (Edmund Optics) served as a mask for photolithography to etch the lateral chart dimensions as steps into a certified quartz wafer (Schott Lithotec) with (specified by the manufacturer). The patterns of the USAF chart ranges from group 0 element 1 down to group 7 element 6, with a width of in decreasing size of . Step heights achieved by reactive ion etching (RIE) were investigated with scanning electron microscopy (SEM, Hitachi S-4700) and with a profilometer (Dektak stylus profiler, Veeco Instruments GmbH). The SEM measurement showed a flank of the step with , which is a normal effect of physical and chemical dry etching processes like RIE, as is the undercut of about (Fig. 4 ). The flank causes a lateral variation of from top to bottom of the step. The height of the etched steps was determined as (s.d.) by the profilometer. The standard deviation includes not only the measurement error within an element of the chart but also the error between different groups. Fig. 4Scanning electron microscopy images of the etched reference chart: (a) Top view, element 4 of group 5, scale bar , top width , bottom width . (b) Top view, element 6 of group 7, scale bar , top width , bottom width . (c) Tilted view, scale bar , angle between step and bottom . 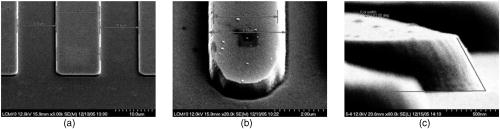 The transparent reference chart with defined parameters qualifies the process of thickness and volume measurement with the digital holographic microscope (Fig. 5 ). Inserting the obtained phase-shift values in Eq. 6 results in a mean step height of (s.d.). The error describes the variation between the etched steps and the single phase measurements. Measuring in air ensures correct phase unwrapping since the phase shifts do not exceed . Furthermore, lens effects deforming the wavefront are avoided by the flat top and bottom surface of the substrate. Fig. 5(a) Surface topology of the etched transparent reference chart (elements 4 to 6 of group 6) recorded by the digital holographic microscope, magnification 20×; (b) line scan of gray values as marked in the pseudo 3-D image. 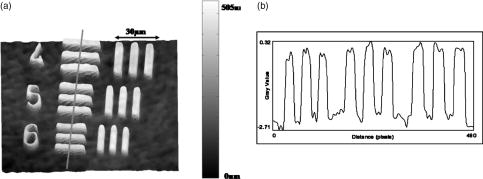 The deviation of the DHM measurement compared to the profilometer values is 2% and therefore tolerable for measuring the thickness of living cells. The flank determined with the SEM is not resolvable when the microscope objectives have a numerical aperture below 1.4; thus, lateral variation of does not falsify the measurement results of the DHM. The lateral resolution depends only on the microscope objective used. 3.2.Measurement of Morphology FeaturesThe cells were observed over a period of time, and the changes of the phase shift of the cells as well as retracting of the lamellipodia were detected. Oligodendrocytes were put onto a coverslip integrated in the fluidic chamber waiting for adherence of the cells and observed over without any stimuli. Snapshots of the phase image at the beginning, after ca. , and ca. are shown in Fig. 6 . The average phase shift of the three cells increased from , which equals a thickness of assuming an integral refractive index of 1.375.15, 23, 31 Determining the area covered after segmentation and multiplication with the average cell thickness shows that the volume swells from . Furthermore, the lamellipodium of the cell is retracting from a length of , as indicated by the arrow length in the phase image (Fig. 6). 3.3.Effects of the Trypsinization Process on the Phase ShiftsA straightforward experiment to induce thickness changes while keeping the refractive index within the cells constant is the trypsinization process commonly used for detaching the cells from the bottom of cell culture flasks. Cells were again grown adherently inside the fluidic chamber before adding trypsin/EDTA solution (0.05% and 0.02% in PBS). The reaction of the cells to the added trypsin was observed for . The initial phase value was . Taking the refractive index of , the thickness of the adherent cell calculates to . Ten minutes after addition of the trypsin, we observed a rapid change of the phase value from until no further change at around . This phase shift corresponds to a total thickness of the cell of (Figs. 7 and 8 ). The segmentation algorithm calculated a decrease of 19.2% from of the surface covered by the cell, but the phase shift of the cell increased by 26%. There was a minimal increase of the cell volume of about 6.8%. A control experiment has been carried out in DMEM without adding trypsin. In this case, the thickness of the cell remained constant. 3.4.Investigation of Cell Volume Changes Induced by Variation of OsmolarityThe phase shift induced by an object measured by digital holography is a function of its refractive index and its thickness. Increasing phase shifts can result from an increasing refractive index as well as from an increasing object thickness. The average refractive index of the cell decreases by water uptake and increases by water release. Both biological processes were measured in each case for swelling and shrinking by reducing or enhancing the osmolarity of the cell medium, respectively. For the investigation of the refractive index, we assumed a spherical shape of a cell that is not adherent before the experiment is started (Fig. 9 ). Under this assumption—the maximum thickness of the cell is equal to the lateral diameter—the time-dependent changes of the cellular refractive index were extracted from the phase shift during the swelling process by subtracting the fraction of the lateral changes of the cell diameter. One cell was recorded directly after passaging before it adhered, settling in a spherical shape on the bottom of the fluidic chamber. Fig. 9Phase image of nonadherent spherical oligodendrocyte for the determination of the integral refractive index; scale bar in [rad].  The refractive index of the cell can be determined by rearranging Eq. 6 and assuming the maximum phase shift corresponding to the maximum cell thickness, which is equal to the cell diameter : Insertion of , , , and results in , which is in good accordance to the literature values23 of, e.g., mouse neurons with .If we assume a spherical cell, i.e., the lateral diameter is equal to the cellular thickness, the refractive index can be calculated by applying Eq. 8 when the fraction of the phase shift caused by the change of the cellular thickness is subtracted. In the following experiment, the cells were put under high hypo-osmotic pressure to induce water influx. The nonadherent cell #1 was recorded during the swelling process as well as an adherent cell #2 (Fig. 10 ). The time-dependent refractive index of cell #1 was observed while the diameter changed, fit to an exponentially decaying function (Fig. 11 ), and was subsequently used for both cells #1 and #2 for evaluation of their thickness changes. Thus, the volume changes of both cells could be observed by determining each of the parameters’ refractive index and thickness by investigating a spherical-shaped cell and an adherent cell, respectively. Fig. 11(a) Mean phase shift of the nonadherent cell #1 induced by lower osmolarity. (b) Determination of the time-dependent refractive index change after subtracting the phase shift corresponding to the cellular thickness.  For the hypo-osmotic ambient, the cell medium was substituted by distilled water, leading to cell swelling. For simplicity, we disregarded the difference in the refractive indices between DMEM and distilled water . The mean phase shift of cell #1 decreases from after , demonstrating that the effect of the decreasing cellular refractive index compensates the changes induced by the cell thickness. Otherwise, an increase in the phase shift should have been detected. This can be explained by water uptake leading to a lower integral refractive index of the investigated cell. The diameter increased from , resulting in a volume change, assuming a spherically shaped cell from , meaning a difference of , and an increase in volume of 52%. The phase shift of the adherent cell #2 decreased as well, from . The change in diameter of the roughly spherically shaped cell #1 is applied for each measurement to evaluate the refractive index by applying Eq. 8. The refractive index of cell #1 decreased from 1.3557 to 1.3440. The refractive index at the beginning of the experiment was lower than the literature value due to the use of the mean phase shift of the cell and not the maximum phase shift to avoid scattering of the values applying the maximum value. Therefore, we take into account a systematical underestimation of to obtain a low-scattering time-dependent thickness measurement. The time-dependent function of the refractive index is set as offset against the mean phase shift change of both cells #1 and #2 to extract their thickness changes. The area covered by cell #1 increases its volume 55% from about . Assuming the similar change of refractive index for cell #2, the volume increased 69%, from about . Shrinking experiments were carried out applying 1.5% (w/w) NaCl solution. The phase shift increased after substitution of the DMEM from (cell #1) or from (cell #2), reaching asymptotically a steady state after or , respectively (Fig. 12 ). Fig. 12Mean phase shift induced by higher osmolarity: (a) cell #2 (adherent), (b) cell #1 (nonadherent).  The oligodendrocytes behaved inversely to the cell swelling, as expected. Consequently, the refractive index compensates the thickness in the phase shift caused by osmotic changes. Comparing the trypsinization with experiments of the induced volume changes, the different percentage of phase shift changes is remarkable. While trypsinization leads to a phase shift increase of 28%, the phase shift changes of the swelling and shrinking experiments are 102% or 50% and 61% or 70% related to the shrinked state, respectively. This indicates as well the strong influence of the refractive index. Therefore, an evaluation without the determination of the reaction-dependent refractive index of the swelling or shrinking cell may be suitable if the assay format stays the same and a statistically sufficient number of experiments were performed. This can be carried out using an objective with a lower magnification. Then a larger number of cells can be imaged simultaneously with the drawback of a worse lateral resolution accompanied with difficulties in the segmentation of the single cells. Therefore, it is a task of software development to separate cells if they are too close or even on top of each other. 3.5.Following Apoptosis by Phase-Shift ChangesApoptosis is a topic of high relevance in biological research. It can be initiated internally by the cell itself or externally by addition of apoptotic drugs. The application of the antibiotic staurosporine is convenient for inducing the apoptosis process.32, 33, 34 The process was observed over a time period of . At the beginning of the experiment, the cells were grown adherently on the FCS-modified coverslip. One cell has been chosen for observation. After addition of ( in dimethyl sulfoxide) staurosporine solution (Sigma-Aldrich) the cell contracted immediately, began to desorb, and adopted a spherical shape (Fig. 13 ). Fig. 13Phase images of oligodendrocytes (a) before and (b) after inducing apoptosis by staurosporine, with marked pinch-offs.  Consequently, the phase shift increased, and the average thickness of was higher than the initial thickness of . The lamellipodia were retracted by the cell. After , the cell began to form pinch-offs typical for apoptosis. The control experiment carried out in the same manner but without staurosporine showed no changes in the morphology (Fig. 14 ). Since there are other processes where the cell adopts a spherical shape, we used the TUNEL assay for an identically treated sample to be sure of apoptosis. In this assay, strand breaks of cleaved DNA were labeled with a fluorescent dye if apoptosis occurred (Fig. 15 ). 4.DiscussionThe time-dependent measurements of the phase shift caused by living cells are suitable for observing changes over a certain time period, as has been illustrated in the examples described earlier. Since the thickness varies rather strongly from cell to cell, the absolute measured values may be of only low importance. This is due on the one hand to how well a cell adheres onto a surface and on the other hand to the cell shape and size. Since living cells show dynamic behavior even without any stimuli, it is difficult to determine absolute errors for morphology changes. But even if the cell morphology changes without any stimuli during observation, the response of a cell to a drug or to the variation of the environment can be detected unambiguously and quantified by the induced phase shift or corresponding thickness variation. The stimuli cause an immediate change in the phase shift, whereas the cell volume without any stimuli varies steadily. We have carried out a control experiment with oligodendrocytes without any stimuli to determine the accuracy and to ensure that the effect on the cell is derived from the induced variation. The obtained standard deviation of the cellular thickness was in the phase value, resulting in an accuracy in thickness of . The mean value phase shift of the background was with a standard deviation of based on 48 single images. This standard deviation of cell thickness contains the uncertainty of the optics, the segmentation process, and especially the cell. Since the cells do not show dramatic changes over a time period of , the influences, e.g., by the lack of a temperature control unit, can be tolerated. The standard deviation of measuring the reference chart in air is based on a linescan of the background area. The error describes the accuracy of the optical arrangement and the roughness of the surface of the reference chart due to the etching process. Using ethanol as liquid ambient to create an index closer to the object that is more comparable to the experiments with living cells, the standard deviation was . For the spherical-shaped cell in Fig. 9, the surface of the cell showed a standard deviation of applying a polynomial fit of the fifth order. The stimulated changes in cellular thickness vary in the extent, because cells normally behave differently dependent on their state. But the immediate response to the stimuli can be detected for each experiment. The cellular refractive index can be determined by assuming a spherical shape if it does not adhere immediately onto the bottom surface of the fluidic chamber. The value obtained with the applied method is in good accordance to the literature values. Rappaz developed a refractive index measurement by recording two corresponding holograms with media of two different refractive indices but the same osmolarity to calculate the integral refractive index of the cell.23 This allows decoupling the refractive index and the cellular thickness. The procedure we suggested in this work is much simpler and allows the determination of the time-dependent integral refractive index of the cell, but only of the whole area covered by the cell and not for each pixel. Consequently, the discrimination of the refractive index of the nucleus and cytoplasma is not feasible. In addition to the conventional two-dimensional (2-D) transmitted light microscopy, digital holography enables access to parameters like cellular thickness or volume as well as refractive index, which has not gained much attention up to now. The technology serves as an observation tool for cellular processes and cannot replace fluorescent techniques. But if correlations can be found between a cellular process and the change in the optical thickness, the technology can be applied for the development of specific assays with the advantage that the use of reporter molecules potentially influencing the experiment can be avoided. Measuring shapes and volumes of cells by standard confocal laser scanning microscopy is rather time-consuming and therefore not convenient for fast three-dimensional (3-D) measurements,13 whereas digital holography allows us to monitor the cell morphology in real time, since one phase image contains all the necessary optical information for the determination of volume changes, neglecting the lateral refractive index distribution. But with a confocal laser scanning microscope, the cellular thickness can be recorded by a representative cross-sectional area of a cell to monitor volume changes, and the viability of a cell can be better assessed by the localization of the fluorescent dye. Volume measurements during the apoptosis process are also described in the literature by Hessler 34 However, Hessler’s atomic force microscopy study of the staurosporine-induced apoptosis process shows an unambiguous decrease in cellular thickness and volume using epithel-like adherent KB cells (human cervix carcinoma). Because we observed an increase of the cellular thickness, the DHM results of the apoptosis process using oligodendrocytes cannot be generalized but demonstrate the feasibility of time-dependent volume measurements. Future experiments will address the integration of the digital holographic microscope into cell culture conditions according to temperature and humidity as well as in combination with conventional microscope and fluorescent techniques. AcknowledgmentsWe thank Uwe Vetter for etching the silicon oxide substrates. Initial experiments with cells were carried out by Nicole Ebentheuer in the framework of her diploma thesis. We thank Martin Schwemmle from the University of Freiburg for providing the cell line and Cornelia Hildebrandt from Fraunhofer IBMT for performing the apoptosis control experiment. The work was financed by the Fraunhofer Gesellschaft as part of the Live Cell Monitoring project. ReferencesE. K. Hoffmann and
H. H. Ussing,
“Membrane mechanisms in volume regulation in vertebrate cells and epithelia,”
Membrane Transport in Biology, 317
–399 Springer, Heidelberg
(1992). Google Scholar
D. Häussinger and
F. Lang,
“Regulation of cell volume in the hepatic function: a mechanism for metabolic control,”
Biochim. Biophys. Acta, 1071 311
–350
(1991). 0006-3002 Google Scholar
D. Häussinger,
W. Gerok, and
F. Lang,
“Cell volume and heperic metabolism,”
Adv. Comp. Environ. Physiol., 14 33
–67
(1993). Google Scholar
D. Häussinger,
“The role of cellular hydration in the regulation of cell function,”
Biochem. J., 313 697
–710
(1996). 0264-6021 Google Scholar
E. K. Hoffmann,
“Intracellular signaling involved in volume regulatory decrease,”
Cell. Physiol. Biochem., 10 273
–288
(2000). https://doi.org/10.1159/000016356 1015-8987 Google Scholar
E. K. Hoffmann and
P. B. Dunham,
“Membrane mechanisms and intracellular signaling in cell volume regulation,”
Int. Rev. Cytol., 161 173
–262
(1995). 0074-7696 Google Scholar
S. P. Srinivas and
J. A. Bonanno,
“Measurements of changes in cell volume based on fluorescence quenching,”
Am. J. Physiol., 272 C1405
–1414
(1997). 0002-9513 Google Scholar
W. E. Crowe,
J. Altamirano,
L. Huerto, and
F. J. Alvarez-Leefmans,
“Volume changes in single N1E-115 neuroblastoma cells measured with a fluorescent probe,”
Neuroscience (N.Y.), 69 283
–296
(1995). 0735-2743 Google Scholar
J. Farinas,
V. Simanek, and
A. S. Verkman,
“Cell volume measured by total internal reflection microfluorimetry: application to water and solute transport in cells transfected with water channel homologs,”
Biophys. J., 68 1613
–1620
(1995). 0006-3495 Google Scholar
J. Altamirano,
M. S. Brodwick, and
F. J. Alvarez-Leefmans,
“Regulatory volume decrease and intracellular in murine neuroblastoma cells studied with fluorescent probes,”
J. Gen. Physiol., 112 145
–160
(1998). https://doi.org/10.1085/jgp.112.2.145 0022-1295 Google Scholar
A. Rohrbach,
“Observing secretory granules with a multiangle evanescent wave microscope,”
Biophys. J., 78 2641
–2645
(2000). 0006-3495 Google Scholar
M. Zelenina and
H. Brismar,
“Osmotic water permeability measurements using confocal laser scanning microscopy,”
Eur. Biophys. J., 29 165
–171
(2000). https://doi.org/10.1007/PL00006645 0175-7571 Google Scholar
M. S. Droste,
S. S. Biel,
L. Terstegen,
K.-P. Wittern,
H. Wenck, and
R. Wepf,
“Noninvasive measurement of cell volume changes by negative staining,”
J. Biomed. Opt., 10 064017
(2005). https://doi.org/10.1117/1.2138011 1083-3668 Google Scholar
R. C. Zeimer,
J. G. Cunha-Vas, and
M. E. Johnson,
“Studies on the technique of vitreous fluorophotometry,”
Invest. Ophthalmol. Visual Sci., 22 668
–674
(1982). 0146-0404 Google Scholar
J. Farinas and
A. S. Verkman,
“Cell volume and plasma membrane osmotic water permeability in epithelial cell layers measured by interferometry,”
Biophys. J., 71 3511
–3522
(1996). 0006-3495 Google Scholar
K. Maric,
B. Wiesner,
D. Lorenz,
E. Klussmann,
T. Betz, and
W. Rosenthal,
“Cell volume kinetics of adherent epithelial cells measured by laser scanning reflection microscopy: determination of water permeability changes of renal principal cells,”
Biophys. J., 80 1783
–1790
(2001). 0006-3495 Google Scholar
D. Gabor,
“A new microscopic principle,”
Nature (London), 161 777
–778
(1948). 0028-0836 Google Scholar
J. Goodman and
R. Lawrence,
“Digital image formation from electronically detected holograms,”
Appl. Phys. Lett., 11 77
–79
(1967). https://doi.org/10.1063/1.1755043 0003-6951 Google Scholar
U. Schnars and
W. Jüptner,
“Direct recording of holograms by a CCD target and numerical reconstruction,”
Appl. Opt., 33 179
–181
(1994). 0003-6935 Google Scholar
E. Cuche,
P. Marquet, and
C. Depeursinge,
“Simultaneous amplitude-contrast and quantitative phase-contrast microscopy by numerical reconstruction of Fresnel off-axis holograms,”
Appl. Opt., 38 6994
–7001
(1999). 0003-6935 Google Scholar
B. Kemper,
D. Carl,
A. Höink,
G. von Bally,
I. Bredebusch, and
J. Schnekenburger,
“Modular digital holographic microscopy system for marker free quantitative phase contrast imaging of living cells,”
Proc. SPIE, 6191 61910T
(2006). https://doi.org/10.1117/12.662781 0277-786X Google Scholar
W. Xu,
M. H. Jericho,
I. A. Meinertzhagen, and
H. J. Kreuzer,
“Digital in-line holography for biological applications,”
Proc. Natl. Acad. Sci. U.S.A., 98 11301
–11305
(2001). https://doi.org/10.1073/pnas.191361398 0027-8424 Google Scholar
B. Rappaz,
P. Marquet,
E. Cuche,
Y. Emery,
C. Depeursinge, and
P. J. Magistretti,
“Measurement of the internal refractive index and dynamic cell morphometry of living cells with digital holographic microscopy,”
Opt. Express, 13 9361
–9373
(2005). https://doi.org/10.1364/OPEX.13.009361 1094-4087 Google Scholar
H. Iwai,
C. Fang-Yen,
G. Popescu,
A. Wax,
K. Badizadegan,
R. R. Dasari, and
M. S. Feld,
“Quantitative phase imaging using actively stabilized phase-shifting low-coherence interferometry,”
Opt. Lett., 29 2399
–2401
(2004). https://doi.org/10.1364/OL.29.002399 0146-9592 Google Scholar
G. Popescu,
L. P. Deflores,
J. C. Vaughan,
K. Badizadegan,
H. Iwai,
R. R. Dasari, and
M. S. Feld,
“Fourier phase microscopy for investigation of biological structures and dynamics,”
Opt. Lett., 29 2503
–2505
(2004). https://doi.org/10.1364/OL.29.002503 0146-9592 Google Scholar
L. Z. Cai,
Q. Liu, and
X. L. Yang,
“Generalized phase-shifting interferometry with arbitrary unknown phase steps for diffraction objects,”
Opt. Lett., 29 183
–185
(2004). https://doi.org/10.1364/OL.29.000183 0146-9592 Google Scholar
D. Carl,
B. Kemper,
G. Wernicke, and
G. von Bally,
“Parameter-optimized digital holographic microscope for high-resolution living-cell analysis,”
Appl. Opt., 43 6536
–6544
(2004). https://doi.org/10.1364/AO.43.006536 0003-6935 Google Scholar
M. Liebling,
T. Blu, and
M. Unser,
“Complex-wave retrieval from a single off-axis hologram,”
J. Opt. Soc. Am. A, 21 367
–377
(2004). https://doi.org/10.1364/JOSAA.21.000367 0740-3232 Google Scholar
P. Marquet,
B. Rappaz,
P. J. Magistretti,
E. Cuche,
Y. Emery,
T. Colomb, and
C. Depeursinge,
“Digital holographic microscopy: a noninvasive contrast imaging technique allowing quantitative visualization of living cells with subwavelength accuracy,”
Opt. Lett., 30 468
–470
(2005). https://doi.org/10.1364/OL.30.000468 0146-9592 Google Scholar
A. Dunn and
R. Richards-Kortum,
“Three-dimensional computation of light scattering from cells,”
IEEE J. Sel. Top. Quantum Electron., 2 898
–905
(1996). https://doi.org/10.1109/2944.577313 1077-260X Google Scholar
R. Posmantur,
K. McGinnis,
R. Nadimpalli,
R. B. Gilbertsen, and
K. K. W. Wang,
“Characterization of CPP32-like protease activity following apoptotic challenge in SH-SY5Y neuroblastoma cells,”
J. Neurochem., 68 2328
–2337
(1997). 0022-3042 Google Scholar
I. Kruman,
G. Qing, and
M. P. Mattson,
“Calcium and reactive oxygen species mediate staurosporine-induced mitochondrial dysfunction and apoptosis in PC12 cells,”
J. Neurosci. Res., 51 293
–308
(1988). 0360-4012 Google Scholar
J. A. Hessler,
A. Budor,
K. Putchakayala,
A. Mecke,
D. Rieger,
M. M. Banaszak Holl,
G. O. Bradford,
A. Bielinska,
J. Beals, J. Baker Jr.,
“Atomic force microscopy study of early morphological changes during apoptosis,”
Langmuir, 21 9280
–9286
(2005). https://doi.org/10.1021/la051837g 0743-7463 Google Scholar
|