|
|
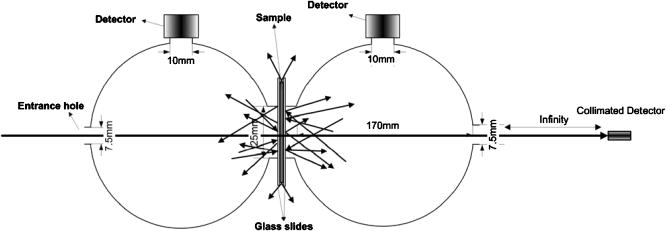
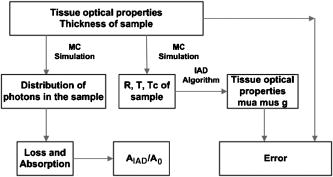
1.IntroductionDetermination of tissue’s optical properties is fundamental for the application of light in either therapeutic or diagnostic procedures. 1, 2, 3, 4, 5, 6, 7, 8, 9, 10, 11, 12, 13, 14, 15, 16, 17, 18, 19, 20, 21, 22, 23, 24, 25, 26, 27, 28, 29, 30, 31, 32, 33, 34, 35, 36, 37, 38, 39 Different methodologies have been proposed to determine tissue’s optical properties. Frequency-domain diffuse reflectance, 1, 2, 3, 4 time-domain diffuse reflectance, 4, 5, 6, 7, 8, 9, 10 spatially resolved steady-state diffuse reflectance, 11, 12, 13, 14, 15 optoacoustics,16 digital microradiography,17 single integrating sphere, 18, 19, 20, 21, 22, 23 or double integrating sphere 24, 25, 26, 27, 28, 29, 30, 31, 32, 33, 34, 35, 36, 37, 38, 39 have been widely used in vivo or in vitro. Each technique has its own advantages and disadvantages. In vivo techniques can be immediately applicable to dosimetry, but only provide limited information about optical properties. In vitro measurements can provide details about individual tissue structures. The double integrating sphere (DIS) technique is frequently applied to measure the optical properties of tissue in vitro. 24, 25, 26, 27, 28, 29, 30, 31, 32, 33, 34, 35, 36, 37, 38 The reflection, diffuse, and collimated transmissions are measured with one sample placed between two integrating spheres, and then the scattering coefficient, the absorption coefficient, and the anisotropy factor can be deduced simultaneously using a model of radiative transfer theory.24, 25, 26 Therefore, DIS technique is also available if the tissue is to undergo some external stimulus such as heating and chemical changes.25, 37 Based on measurements of DIS, the inverse Monte Carlo (IMC) simulations yield the most exact solutions because every geometric parameter can be considered in a computer program.27, 28, 29 However, the inverse algorithm requires laborious and intensive calculations because it uses optical properties to calculate reflection and transmission, thus the optical parameters have to be fitted to the measured values. Peters developed an available method to determine the optical properties of tissues based on a combination of experimental data and a Monte Carlo (MC) model of light transport, which solved the long timewaste problems successfully for single integrating spheres by using precalculated simulations.18 However, this method has not been extended to a DIS system. The inverse adding-doubling (IAD) method developed by Prahl represents a numerical solution to the radiative transport equation that can be used to calculate the optical properties for arbitrary boundary conditions.26 The main advantage of the IAD method is its combination of fast computation and validity over practical optical properties. This algorithm has been used for determination of optical properties within a host of tissues for reflectance and transmission measurements. 30, 31, 32, 33, 34, 35, 36, 37 A problem may arise if light losses occurring through glass slides and ports in the spheres are not taken into account correctly in the algorithm. de Vries paid attention to the effect of the loss through the exit port in the transmission sphere with an IMC algorithm.38 Beek hypothesized that light losses at the sides of the sample result in overestimation of the absorption coefficient and an erroneous dependence of the obtained optical properties on the physical sample thickness.32 Pickering and Prahl thought that the losses could be reduced for greater sample port diameters or greater optical depths based on some experiments.24, 25, 26 After having calculated the absorption coefficient and the reduced scattering coefficient of tissues by the IAD method based on the measurements of the DIS technique, Sardar compared the measurements of reflectance and transmission with those generated by the MC simulation technique. They also found that there were differences between the measurements and estimation of reflectance and transmission, which were relative to the optical properties of tissue.30, 31 Nevertheless, these investigations were not sufficient for demonstrating the light losses of a sample between two integrating spheres and the error of optical properties of tissue estimation by IAD method. It is necessary to study the effect caused by various factors systematically, such as the parameters of integrating a sphere and sample, on the light loss and the optical properties estimation. In this paper, a MC algorithm has been applied to simulate the measurements of a sample with glass slides sandwiched between the DIS setup. The effects caused by various parameters, such as different sample port diameters of the integrating sphere, thicknesses, and optical properties of a sample, on light losses have been investigated, and then the relative error of the absorption coefficient and the scattering coefficient estimation by the IAD method is deduced. Finally, the correlation of the error and those factors has been analyzed quantitatively. 2.MethodsThe sample, sandwiched between glass slides, is placed between two integrating spheres. Then a MC algorithm of photon propagation in multilayered tissue, developed by Wang, 40 compared with the light propagation theory of DIS (Ref. 25) is used to obtain the distribution of photons, the diffuse reflectance, the diffuse transmittance, or the collimated transmittance based on the sampling parameters of the integrating spheres and the optical properties and thickness of the sample. Then the absorption of the sample inside the sample port diameter area and the light losses out of edges of the sample are deduced. The geometry implemented in the MC algorithm is shown in Fig. 1 . The refracting index of the sample is 1.37 and that of the glass is 1.52. The thickness of a glass slide is . Because the loss of light from the edges of the sample is regarded as a part of absorption of the sample in the IAD method, the amount of the absorption equals the sum of light losses and the absorption inside the sample port diameter area Based on the diffuse reflectance, the diffuse transmittance, and the collimated transmittance above, combined with the thicknesses of the samples and the sample port diameters of the integrating spheres, the absorption coefficient, scattering coefficient, and anisotropy factor were calculated using the IAD method. Comparing the estimations of optical properties with the optical properties used in the MC algorithm, we can obtain the relative error of optical properties. Figure 2 shows the flow chart of the method. Pickering indicated that the loss of light through the sides of the sample and sample holder may depend on the physical size and geometry of the sample and the optical properties of the sample.24 Hence, we will discuss the effect caused by the sample port diameter of the integrating sphere, the thickness of the sample, and the absorption coefficient, the scattering coefficient, and the anisotropy factor of sample on the light loss and the error of optical properties estimation. The sample port diameter of DIS in is commonly used, and the thickness of the sample is less than for most experiments. In near infrared (NIR), most biological tissues show highly forward scattering. The anisotropy factors are larger than 0.7, the absorption coefficient and the scattering coefficient are usually larger than and , respectively.39 de Vries pointed out that when , the IAD method did not converge and failed to estimate optical properties according to the DIS measurements.38 Therefore, in this paper, we discuss light losses and the error of optical properties estimation for different sample port diameters (20, 25, ), different thicknesses of samples (0.7, 0.8, ), and different tissue optical properties (anisotropy factors: 0.7, 0.8, 0.9; absorption coefficient: 0.01 to ; scattering coefficient: 2 to ), respectively. 3.Results and Analysis3.1.Light Losses of the Sample between the Two Integrating SpheresFigure 3 shows the percentage of as a function of absorption and scattering coefficients for different sample port diameters, different thicknesses, and different anisotropy factors. The results indicate that the percentages of are always greater than 100%. The IAD method overestimates the absorption because of light losses. Different effects on light losses that resulted from various factors will be analyzed below. Fig. 3varying with the absorption and scattering coefficients for different sample port diameters (a) to (c), different thicknesses of samples (d) to (f), and different anisotropy factors (g) to (i).  3.1.1.The influence of the sample port diameter of the integrating sphere on light lossesThe influences on light losses for different sample port diameters ( , 25, ), and constant anisotropy factor and constant thickness of sample are shown in Figs. 3a, 3b, 3c. We can see that the bigger the sample port diameter is, the smaller the percentage of is for the same samples (with constant thickness and tissue optical properties). When the sample port diameter is , the maximal percentage of is 159%, which means that the light loss–induced increase in apparent absorption of the sample is 59%. When the sample port diameter increases to 25 and , the maximal percentage of reaches to 128 and 113%, respectively. 3.1.2.The influence of the thickness of the sample on light lossesFigures 3d, 3e, 3f show the influence of different thicknesses of the sample ( , 0.8, ) on light losses for constant anisotropy factor and constant sample port diameter . Comparing Figs. 3d, 3e, 3f, we can conclude that if the sample port diameter is constant, for the same kind of samples (constant tissue optical properties), the percentage of the increases slightly with the increase in the thickness of the sample. The thickness of the sample increases from 0.7 to , and the maximum of increases from 125 to 128%. 3.1.3.The influence of optical properties of the sample on light lossesAnisotropy factorFigures 3g, 3h, 3i show the percentage of varying with the absorption and the scattering coefficients for constant sample port diameter , thickness of sample and different anisotropy factor ( , 0.8, 0.9), respectively. When increases from 0.7 to 0.9, the maximal percentage of is 106, 114, and 128%, respectively. Absorption coefficient and scattering coefficientFigures 3a, 3b, 3c, 3d, 3e, 3f, 3g, 3h, 3i indicate the percentage of as a function of the absorption and scattering coefficients. The percentage of decreases when the absorption coefficient or the scattering coefficient increases. The larger the absorption coefficient or scattering coefficient, the less the percentage of ; that is, when the absorption coefficient is larger than or the scattering coefficient is larger than , the maximal percentage of is less than 105%. 3.2.The IAD Method–Induced Error of Tissue Optical Properties EstimationAccording to the analysis above, we can conclude that the overestimation of absorption depends on many factors, such as the sample port diameter, the thickness, and the optical properties of the sample. Corresponding to Fig. 3, Fig. 4 shows the relative error of optical properties estimation by the IAD method. Fig. 4The relative estimation error of the absorption coefficient (a1) to (i1) and the scattering coefficient (a2) to (i2) estimation by the IAD for different sample port diameters (a1) to (c1) and (a2) to (c2), different thicknesses of samples (d1) to (f1) and (d2) to (f2), and different anisotropy factors (g1) to (i1) and (g2) to (i2). 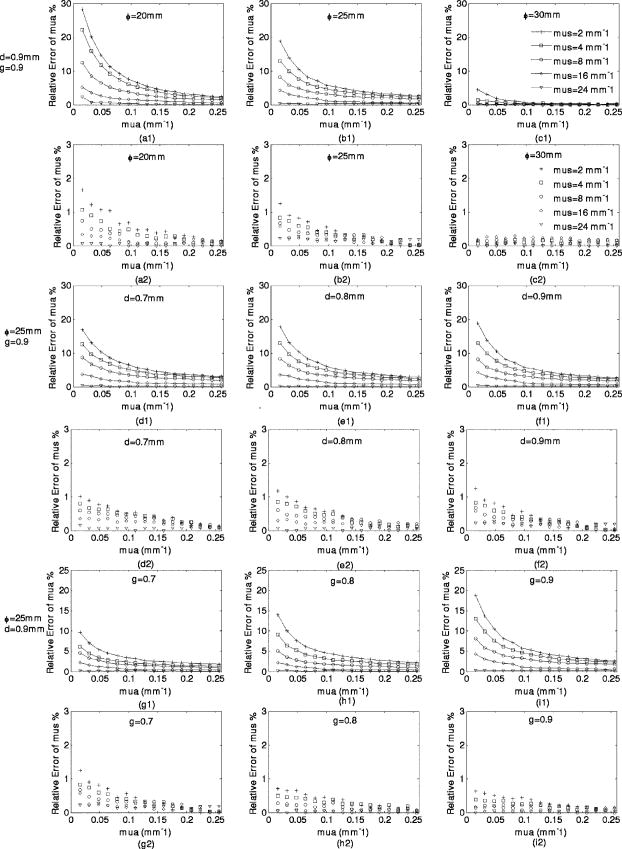 From Figs. 4(a1)–4(i1) and 4(a2)–4(i2), we find that the influence on the estimation of absorption coefficient is much greater than that on the scattering coefficient; that is the maximal relative error of absorption coefficient is 28% and that of scattering coefficient is below 2%. But the variety tendencies of the error of the absorption and scattering coefficients are the same: when the relative error of absorption coefficient decreases, the relative error of the scattering coefficient approaches 0. Thus, we only pay attention to the influence on the absorption coefficient estimation caused by the different factors below. 3.2.1.The dependence of the error on the sample port diameter of the integrating sphereFigures 4(a1)–4(c1) show the relative error of the absorption coefficient estimation for constant anisotropy factor , constant thickness of sample , and different sample port diameters ( , 25, ), respectively. The results indicate that the large sample port diameter of the integrating sphere can decrease the error obviously; that is, when is , the maximal error is 28%, but when is 25 or , it is 19 and 4%, respectively. 3.2.2.The dependence of the error on the thickness of the sampleWhen the size of the integrating sphere port is constant (i.e., the sample port diameter is ), the dependence of the error on the thickness of the sample is represented in Figs. 4(d1)–4(f1). We can find that the thicker the sample is, the larger the error of the optical properties estimation is. Whereas the difference of error caused by the change in thickness of the sample is very tiny; that is when is 0.7, 0.8, , the maximal error is 17, 18, and 19%, respectively. 3.2.3.The dependence of the error on tissue optical properties of the sampleWhen the DIS system and the thickness of sample are constant, the dependence of the error on tissue optical properties is investigated below. Anisotropy factorFigures 4(g1)–4(i1) show the relative error of the absorption coefficient estimation as a function of the absorption coefficient and the scattering coefficient of the sample for constant sample port diameter , constant thickness of sample , and different anisotropy factor . The relative error increases with the anisotropy factor. When the anisotropy factor is 0.7, 0.8, 0.9, the maximal error is 10, 14, and 19%, respectively. Absorption coefficient and scattering coefficientComparing the curves in Figs. 4(a1)–4(i1), we find that the relative error decreases significantly with the increase in the absorption coefficient or the scattering coefficient of the sample. The larger the absorption coefficient and scattering coefficient are, the smaller the errors are. A large scattering coefficient decreases the relative error more obviously than a large absorption coefficient does. If only the scattering coefficient is large enough (i.e., ), the maximal relative error of the absorption coefficient is less than 1%. In contrast, when the scattering coefficient is very small (i.e., ), and absorption coefficient is large enough (i.e., ), the minimal relative error of the absorption coefficient is still larger than 3%. From the curves in Figs. 4(d1)–4(i1) for the same sample port diameter of the integrating sphere, we can estimate that the error decreases very slowly with the absorption coefficient when the absorption coefficient is very large. 4.DiscussionAccording to the simulation results about the light loss and the relative error of optical properties estimation, we find that the light loss is regarded as a part of the absorption in the IAD method, which overestimates the absorption coefficient and introduces some error. The greater the light losses, the larger the errors, which accords with Pickering’s experimental results.24 People always recognize that the IAD method overestimates the absorption coefficient, but no one notices whether there is an estimation error of the scattering coefficient. Our simulation results show that the IAD method also overestimates the scattering coefficient, even though the error of the scattering coefficient is much less than that of absorption coefficient. In the range of the parameters used in the simulation, the maximal relative error of the scattering coefficient is less than 1.5%. Therefore, the error of the scattering coefficient estimation by the IAD method may almost be ignored. Based on the analysis of the dependence of the relative error of the absorption coefficient estimation on the sample port diameter and the thickness of the sample, we will discuss how to improve the accuracy of the optical properties estimation from the perspective of the design of the DIS system and the preparation of samples. Moreover, when considering the optical properties of the sample, we will also evaluate the error of the optical properties estimation by the IAD method. 4.1.The Design of DIS and the Preparation of SamplesAccording to the results mentioned above, the sample port diameter seriously influences the loss of light from the edges of the sample between two integrating spheres. Increasing the sample port diameter will decrease the light losses and the relative error of the optical properties estimation by the IAD method. The reason for this is that the enhancement of the sample port diameter will increase the part of light absorption caused by the sample, and the amount of absorption used in the IAD method is close to the real value, which decreases the relative error of the optical properties estimation. When the sample port diameter is , in the range of the parameters, the relative error of the absorption coefficient estimation is less than 5%. Therefore, enhancing the sample port diameter of the integrating sphere is a good method for decreasing the error of optical properties estimation by the IAD method. We noticed that when the sample port diameter is big, the diameter of the integrating sphere should be big enough to maintain the shape of the sphere, which should be considered in the design of DIS. On the other hand, the IAD sample requires a uniform sample to be used for the experiment. However, it is not easy to prepare a biological tissue sample with big enough size and uniform thickness. Compared with the sample port diameter, the change in thickness of the sample has less influence. Reducing the thickness of the sample could also decrease light losses and the error of the optical properties estimation. The amount of scattering decreases in the thin sample, which reduces the light losses and the absorption of the sample. The two factors together make light losses produce less influence on the error. Although the error slightly decreases with the thickness of the sample, it is not convenient for the preparation. There are usually some air bubbles in thin samples that destroy the uniformity of samples and introduce other errors into the measurements. Consequently, it is for the reasons stated above that we should consider all factors together in the design of DIS and the preparation of samples. The error of optical properties estimation by IAD method as well as the error of measurement introduced by the preparation of the sample should be considered. 4.2.The Evaluation of the Accuracy of the Optical Properties EstimationThe simulation results also demonstrate that there will be a very small error of optical properties estimation by the IAD method for high scattering or high absorption samples, which agrees with Pickering’s conclusion that the error would be reduced for greater optical depths.24 However, Pickering 24 also pointed out that for a 1-mm sample thickness and 25-mm sample port diameter, the light losses were negligible over the optical depth range from 0 to 54, which is not consistent with what we simulated above. For weak scattering and absorption samples, the relative error of the absorption coefficient is usually very large, that is up to 19% for 0.9-mm sample thickness, 0.9 anisotropy factor, and 25-mm sample port diameters. The anisotropy factor of the sample affects the error of the optical properties estimation. When the anisotropy factor is smaller, the backscattering increases and the forward scattering reduces, and more photons move a short trip in the sample and return to the incidence surface, so the light losses decrease. In contrast, when the anisotropy factor is bigger, the light losses increase because there will be greater forward scattering light, and more photons move a long trip in the sample to undergo multiscattering, therefore, which causes an increase in the error of absorption coefficient estimation by the IAD. Because most tissues show the characteristic of high scattering (i.e., larger than ) and weak absorption in NIR, the maximal relative error of the absorption coefficient estimation by the IAD method is less than 5% based on a constant sample port diameter . If the scattering coefficient is larger than , the relative error is less than 1%. For some tissues, such as lung, kidney, and colon mucous,39 their scattering coefficients are in the range of 4 to , and their absorption coefficients are larger than , we still estimate that the relative errors of absorption are less than 5% if both the DIS measurement technique and the IAD method are used. Therefore, in NIR, the error of optical properties estimation is almost ignored. That is why the measurement of tissue optical properties based on both the DIS measurement technique and the IAD method is still widely used. Nevertheless, for some other tissues, such as bladder wall, bladder mucous, bladder integral, prostate, fatty of female breast, fibrous of female breast, infiltrating carcinoma, and others, which have a weak scattering coefficient (less than ) and a weak absorption coefficient (less than ) in NIR,39 the error of absorption coefficient estimation by the IAD method will not be neglected. This problem could be solved by using a big sample port of the integrating sphere and thin samples, by applying an inverse MC algorithm,27, 28, 29 or by expanding the precalculated simulations that were developed by Peters 18 to DIS. 5.ConclusionIn summary, we quantitatively analyze light losses from the edges of the sample from perspectives of sample port diameters of integrating spheres and thickness and optical properties of samples and deduce the relative error in estimation of absorption coefficient and scattering coefficient by the IAD method. The results show that the relative error of the scattering coefficient is less than 2%, which is much less than that of the absorption coefficient. The error of the optical properties estimation strongly depends on the sample port diameter of the integrating sphere and the scattering coefficient of the sample and also depends on the absorption coefficient, anisotropy factor, and the thickness of sample. Enhancing the sample port diameter of the integrating sphere and the thickness of the sample can reduce the error of the optical properties estimation, and the effect on the error caused by the sample port diameter is greater than that by thickness of sample. IAD method is most suitable for estimating the optical properties of high scattering or high absorbing samples. This work can not only evaluate the estimation error of optical properties estimation based on both the DIS technique and IAD method, but also provide optimal ways for the design of DIS and a scheme for ac-quiring accurate optical properties based on the DIS measurement. AcknowledgmentsThis study was supported by National Nature Science Foundation of China for international cooperation (Grant Nos. 60411120125, 60511120093, 30770552). The authors would like to thank Prof. Steven. L. Jacques at Oregon Medical Laser Center of America and Dr. Yuhui Zhang at Huazhong University of Science and Technology of China for their help. ReferencesS. Fantini,
M. A. Francechini-Fantini,
J. S. Maier,
S. A. Walker,
B. Barbieri, and
E. Gratton,
“Frequency-domain multichannel optical detector for noninvasive tissue spectroscopy and oximetry,”
Opt. Eng., 34 32
–42
(1995). https://doi.org/10.1117/12.183988 0091-3286 Google Scholar
G. Alexandrakis,
D. R. Busch,
G. W. Faris, and
M. S. Patterson,
“Determination of the optical properties of two-layer turbid media by use of a frequency-domain hybrid Monte Carlo diffusion model,”
Appl. Opt., 40 3810
–3821
(2001). https://doi.org/10.1364/AO.40.003810 0003-6935 Google Scholar
N. Shah,
A. E. Cerussi,
D. Jakubowski,
D. Hsiang,
J. Butler, and
B. J. Tromberg,
“Spatial variations in optical and physiological properties of healthy breast tissue,”
J. Biomed. Opt., 9 534
–540
(2004). https://doi.org/10.1117/1.1695560 1083-3668 Google Scholar
E. M. Sevick,
B. Chance,
J. Leigh,
S. Nioka, and
M. Maris,
“Quantitation of time- and frequency-resolved optical spectra for the determination of tissue oxygenation,”
Anal. Biochem., 195 330
–351
(1991). https://doi.org/10.1016/0003-2697(91)90339-U 0003-2697 Google Scholar
M. S. Patterson,
B. Chance, and
B. C. Wilson,
“Time resolved reflectance and transmittance for the noninvasive measurements of optical properties,”
Appl. Opt., 28 2331
–2336
(1989). 0003-6935 Google Scholar
A. A. Oraevsky,
S. L. Jacques, and
F. K. Tittel,
“Measurement of tissue optical properties by time-resolved detection of laser-induced transient stress,”
Appl. Opt., 36 402
–415
(1997). https://doi.org/10.1038/385402a0 0003-6935 Google Scholar
S. J. Matcher,
M. Cope, and
D. T. Delpy,
“In vivo measurements of the wavelength dependence of tissue-scattering coefficients between 760 and measured with time-resolved spectroscopy,”
Appl. Opt., 36
(1), 386
–396
(1997). 0003-6935 Google Scholar
G. Pal,
S. Basu,
K. Mitra, and
T. Vo-Dinh,
“Time-resolved optical tomography using short-pulse laser for tumor detection,”
Appl. Opt., 45 6270
–6282
(2006). 0003-6935 Google Scholar
S. Andersson-Engels,
R. Berg,
A. Persson, and
S. Svanberg,
“Multispectral tissue characterization with time-resolved detection of diffusely scattered white light,”
Opt. Lett., 18 1697
–1699
(1993). 0146-9592 Google Scholar
D. Contini,
A. Torricelli,
A. Pifferi,
L. Spinelli,
F. Paglia, and
R. Cubeddu,
“Multi-channel time-resolved system for functional near infrared spectroscopy,”
Opt. Express, 14 5418
–5432
(2006). https://doi.org/10.1364/OE.14.005418 1094-4087 Google Scholar
T. J. Farrell and
M. S. Patterson,
“A diffusion theory model of spatially resolved, steady-state diffuse reflectance for the noninvasive determination of tissue optical properties in vivo,”
Med. Phys., 19 879
–888
(1992). https://doi.org/10.1118/1.596777 0094-2405 Google Scholar
R. Bays,
G. Wagnieres,
D. Robert,
D. Braichotte,
J.-F. Savary,
P. Monnier, and
H. van den Bergh,
“Clinical determination of tissue optical properties by endoscopic spatially resolved reflectometry,”
Appl. Opt., 35 1756
–1766
(1996). 0003-6935 Google Scholar
P. R. Bargo,
S. A. Prahl,
T. T. Goodell,
R. A. Sleven,
G. Koval,
G. Blair, and
S. L. Jacques,
“In vivo determination of optical properties of normal and tumor tissue with white light reflectance and an empirical light transport model during endoscopy,”
J. Biomed. Opt., 10 034018
(2005). https://doi.org/10.1117/1.1921907 1083-3668 Google Scholar
S. Yeh,
O. S. Khalil,
C. F. Hanna, and
S. Kantor,
“Near-infrared thermo-optical response of the localized reflectance of intact diabetic and nondiabetic human skin,”
J. Biomed. Opt., 8
(3), 534
–544
(2003). https://doi.org/10.1117/1.1578641 1083-3668 Google Scholar
A. Dimofte,
J. Finlay, and
T. Zhu,
“A method for determination of the absorption and scattering properties interstitially in turbid media,”
Phys. Med. Biol., 50 2291
–2311
(2005). https://doi.org/10.1088/0031-9155/50/10/008 0031-9155 Google Scholar
R. O. Esenaliev,
Y. Y. Petrov,
O. Hartrumpf,
D. J. Deyo, and
D. S. Prough,
“Continuous noninvasive monitoring of total hemoglobin concentration by an optoacoustic technique,”
Appl. Opt., 43
(17), 3401
–3407
(2004). https://doi.org/10.1364/AO.43.003401 0003-6935 Google Scholar
C. L. Darling,
G. D. Huynh, and
D. Fried,
“Light scattering properties of natural and artificially demineralized dental enamel at ,”
J. Biomed. Opt., 11 034023
(2006). https://doi.org/10.1117/1.2204603 1083-3668 Google Scholar
V. G. Peters,
D. R. Wyman,
M. S. Patterson, and
G. L. Frank,
“Optical properties of normal and diseased human breast tissues in the visible and near infrared,”
Phys. Med. Biol., 35 1317
–1334
(1990). https://doi.org/10.1088/0031-9155/35/9/010 0031-9155 Google Scholar
A. N. Yaroslavsky,
P. C. Schulze,
I. V. Yaroslavsky,
R. Schober,
F. Ulrich, and
H. J. Schwarzmaier,
“Optical properties of selected native and coagulated human brain tissues in vitro in the visible and near infrared spectral range,”
Phys. Med. Biol., 47 2059
–2073
(2002). https://doi.org/10.1088/0031-9155/47/12/305 0031-9155 Google Scholar
A. N. Bashkatov,
E. A. Genina,
V. I. Kochubey, and
V. V. Tuchin,
“Optical properties of human skin, subcutaneous and mucous tissues in the wavelength range from 400 to ,”
J. Phys. D, 38 2543
–2555
(2005). https://doi.org/10.1088/0022-3727/38/15/004 0022-3727 Google Scholar
W. C. Lin,
C. Buttermere, and
A. Mahadevan-Jansen,
“Effect of thermal damage on the in vitro optical and fluorescence characteristics of liver tissues,”
IEEE J. Quantum Electron., 9 162
–170
(2003). https://doi.org/10.1109/JSTQE.2003.811288 0018-9197 Google Scholar
S. C. Gebhart,
W. C. Lin, and
A. Mahadevan-Jansen,
“In vitro determination of normal and neoplastic human brain tissue optical properties using inverse adding-doubling,”
Phys. Med. Biol., 51 2011
–2027
(2006). https://doi.org/10.1088/0031-9155/51/8/004 0031-9155 Google Scholar
M. Friebel,
A. Roggan,
G. Muller, and
M. Meike,
“Determination of optical properties of human blood in the spectral range 250 to using Monte Carlo simulations with hematocrit-dependent effective scattering phase function,”
J. Biomed. Opt., 11 034021
(2006). https://doi.org/10.1117/1.2203659 1083-3668 Google Scholar
J. W. Pickering,
S. A. Prahl,
N. Vanwieringen,
J. F. Beek,
H. J. C. M. Sterenborg, and
M. J. C. Vangemert,
“Double integrating-sphere system for measuring the optical-properties of tissue,”
Appl. Opt., 32 399
–410
(1993). 0003-6935 Google Scholar
J. W. Pickering,
C. J. M. Moes,
H. J. C. M. Sterenborg,
S. A. Prahl, and
M. J. C. van Gemert,
“Two integrating spheres with an intervening scattering sample,”
J. Opt. Soc. Am. A, 9 621
–631
(1992). 0740-3232 Google Scholar
S. Prahl,
M. van Gemert, and
A. Welch,
“Determining the optical properties of turbid media by using the adding doubling method,”
Appl. Opt., 32 559
–568
(1993). 0003-6935 Google Scholar
A. Roggan,
K. Dorschel,
O. Minet,
D. Wolff, and
G. Müller,
“The optical properties of biological tissue in the near infrared wavelength range-review and measurements,”
Laser-Induced Interstitial Thermaotherapy, 10
–44 SPIE Press, Bellingham, Wash. (1995). Google Scholar
A. Roggan,
M. Friebel,
K. Dorschel,
A. Hahn, and
G. Müller,
“Optical properties of circulating human blood in the wavelength range ,”
J. Biomed. Opt., 4 36
–46
(1999). https://doi.org/10.1117/1.429919 1083-3668 Google Scholar
H. Wei,
D. Xing,
G. Wu,
H. Gu,
J. Lu,
Y. Jin, and
X. Li,
“Differences in optical properties between healthy and pathological human colon tissues using a Ti:sapphire laser: An in vitro study using the Monte Carlo inversion technique,”
J. Biomed. Opt., 10 044022
(2005). https://doi.org/10.1117/1.1990125 1083-3668 Google Scholar
D. K. Sardar,
F. S. Salinas,
J. J. Perez, and
A. T. C. Tsin,
“Optical characterization of bovine retinal tissues,”
J. Biomed. Opt., 9 624
–631
(2004). https://doi.org/10.1117/1.1688813 1083-3668 Google Scholar
D. K. Sardar,
M. L. Mayo, and
R. D. Glickman,
“Optical characterization of melanin,”
J. Biomed. Opt., 6 404
–411
(2001). https://doi.org/10.1117/1.1411978 1083-3668 Google Scholar
J. F. Beek,
P. Blokland,
P. Posthumus,
M. Aalders,
J. W. Pickering,
H. J. Sterenborg, and
M. J. van Gemert,
“In vitro double-integrating-sphere optical properties of tissues between 630 and ,”
Phys. Med. Biol., 42 2255
–2261
(1997). https://doi.org/10.1088/0031-9155/42/11/017 0031-9155 Google Scholar
T. L. Troy and
S. N. Thennadil,
“Optical properties of human skin in the near infrared wavelength range of 1000 to ,”
J. Biomed. Opt., 6 167
–176
(2001). https://doi.org/10.1117/1.1344191 1083-3668 Google Scholar
J. F. Beek,
H. J. van Staveren,
P. Posthumus,
H. J. C. M. Sterenborg, and
M. J. C. van Gemert,
“The optical properties of lung as a function of respiration,”
Phys. Med. Biol., 42 2263
–2272
(1997). https://doi.org/10.1088/0031-9155/42/11/018 0031-9155 Google Scholar
J. W. Pickering,
S. Bosman,
P. Posthumus,
P. Blokland,
J. F. Beek, and
M. J. C van Gemert,
“Changes in the optical properties (at ) of slowly heated myocardium,”
Appl. Opt., 32 367
–371
(1993). 0003-6935 Google Scholar
D. Zhu,
Q. Luo, and
J. Chen,
“Effects of dehydration on the optical properties of in vitro porcine liver,”
Lasers Surg. Med., 33 226
–231
(2003). https://doi.org/10.1002/lsm.10215 0196-8092 Google Scholar
W. Lin,
M. Motamedi, and
A. J. Welch,
“Dynamics of tissue optics during laser heating of turbid media,”
Appl. Opt., 35 3413
–3420
(2001). 0003-6935 Google Scholar
G. de Vries,
J. F. Beek,
G. W. Lucassen, and
M. J. C. van Gemert,
“The effect of light losses in double integrating spheres on optical properties estimation,”
IEEE J. Quantum Electron., 5 944
–947
(1999). https://doi.org/10.1109/2944.796315 0018-9197 Google Scholar
J. Mobley and
T. Vo-Dinh,
“Optical properties of tissue,”
Biomedical Photonics Handbook, 1
–76 CRC Press, New York (2003). Google Scholar
L. Wang,
S. L. Iacques, and
L.-Q. Zheng,
“MCML–Monte Carlo modeling of photon transport in multi-layered tissue,”
Comput. Methods Programs Biomed., 47 131
–146
(1995). https://doi.org/10.1016/0169-2607(95)01640-F 0169-2607 Google Scholar
|