
|
|
1.IntroductionHigh-resolution microvascular imaging has provided insights into cancer pathophysiology1, 2 and is increasingly important in the field of critical care medicine as microvascular function has been associated with survival in patients with severe bacterial infection.3 In patients, the sublingual (tongue) microcirculation has become an important imaging target for assessing superficial microvascular geometry using orthogonal polarization spectroscopy (OPS) imaging.3, 4 Experimentally, the skeletal muscle microcirculation has been used to investigate microvascular oxygen transport in animal models of bacterial infection using intravital video microscopy.5 While the sublingual microcirculation is convoluted, the skeletal muscle microvascular unit is well defined, consisting of three components: (1) feeding arterioles, which are resistance vessels and deliver blood to the tissue; (2) capillary networks, which distribute individual red blood cells throughout the tissue; and (3) collecting venules, which are larger capacitance microvessels that collect and return blood to the general circulation. To achieve increased optical imaging resolution, researchers have turned to multiphoton microscopy for deep tissue imaging6, 7, 8 and fluorescent quantum dots9, 10 (QDs), which provide more imaging detail than organic probes such as FITC-dextran.11 This combination of technologies has been used to image microvessels in highly scattering adipose tissue,11 extravasating tumor cells in the lung,12 and channels in plasma membranes.13 QDs are semiconductor nanocrystals consisting of a CdSe core and a ZnS shell with a dry diameter of only a few nanometers. Unlike organic fluorophores, QDs have a broad excitation spectrum, but a narrow diameter-dependent, fluorescence emission spectrum.9, 10 Moreover, they are highly photostable, have negligible temporal fluctuations and are very bright, with two-photon cross sections two to three orders of magnitude greater than conventional fluorescent probes.11 As such, these QD nanoparticles are particularly attractive as contrast agents for deep tissue optical imaging using nonlinear multiphoton fluorescence excitation, which requires the simultaneous absorption of two or more IR photons in a femtoliter focal volume.7, 14 To render QDs water soluble, however, they must be coated with amphiphilic materials. Coating nanoparticles with polyethylene glycol (PEG) serves two important purposes. First, it renders nanoparticles biologically useful as an imaging contrast agent, and second, PEGylation increases nanoparticle circulating half-life.11, 15 In this paper, we report on the use of methoxy-PEGylated (mPEG, ) QDs for deep tissue in vivo microvascular imaging in mouse skeletal muscle using multiphoton microscopy. We show that complete microvascular units, including capillaries, can be readily identified at tissue depths of . We confirm previous observations that QDs accumulate in various tissues, but also show that QD aggregates accumulate in particular microvascular locations and extravasate from the microcirculation. We also report that QDs are rapidly cleared during the onset of endotoxemia, thereby reducing their effective time window as an imaging contrast agent. 2.Materials and Methods2.1.QDsFor this work, nontargeted methoxy-PEGylated QDs (maximum fluorescence emission ) were supplied by Quantum Dot Corporation (Hayward, California). Immediately prior to injection, QDs were sonicated for in an ice bath to break up any aggregates that might have formed and mixed (vol/vol) with saline to a working concentration of . In preliminary studies comparing the fluorescent signal from equimolar solutions of 565- and mPEG-5000 QDs, we found the larger CdSe-ZnS core-shell nanoparticles to be the “brighter” of the two when excited at . The larger QDs with emission maximum at also had the advantage of being further red-shifted from the skeletal muscle tissue autofluorescence background signal. 2.2.Animal and Extensor Digitorum Longus Muscle PreparationMale CD1 mice, weighing , were anesthetized by an intraperitoneal injection of ketamine and xylazine and placed on a heating pad. The left hind limb was shaved and surface hair removed as it interfered with fluorescent imaging. The extensor digitorum longus (EDL) skeletal muscle was blunt dissected and severed at the tendon. The animal was placed in the recovery position with its leg extended into a WillCo-glass-bottom dish (Amsterdam, The Netherlands), for imaging using an inverted microscope, and the muscle held under tension by a suture tied to the EDL tendon. The muscle was bathed in warm saline, maneuvered into the optical beam path, and covered by a piece of Saran Wrap, which acted as an oxygen permeability barrier. Then 60 pmols of QDs were injected into the circulation via the tail vein. Approximating the mouse blood volume at , we estimated the initial QD circulating concentration to be . The animal was then covered with a heating pad to maintain internal core temperature. To assess the effect of an endotoxemic response on QD clearance, a mouse model of bacterial infection was used where gram negative bacterial cell wall lipopolysaccharide (LPS) was mixed with saline ( , Escherichia coli 0111:B4 LPS, Sigma, Saint Louis, Missouri) and injected intraperitoneally. Since the microvascular response to LPS takes several hours to develop, QDs were injected after LPS injection. All procedures were approved by the Animal Care Committee at the University of British Columbia. 2.3.Multiphoton MicroscopyTo facilitate in vivo microvascular imaging in the highly light absorbing and scattering skeletal muscle tissue, we used a titanium sapphire mode-locked pulse laser (Spectra Physics, Mountain View, California), with a repetition rate, tuned to and focused through a numerical aperture (NA) water-immersion objective (AOBS SP2 TCS laser scanning confocal microscope, Leica Microsystems, Heidelberg GmbH, Mannheim). The power out of the objective was ; however, the power at the focal plane within the muscle was unknown. Fluorescent images were acquired at using either single-frame acquisition or three frame averaging. Optical sectioning was performed using Nyquist sampling. In time course experiments to determine QD circulating half-life, imaging parameters were adopted on the fly to optimize the dynamic range of the initial fluorescence reading. Larger microvessels near the surface of the skeletal muscle were chosen to follow the in vivo QD elimination as they were the easiest vessels to find quickly following injection and provided good imaging targets of not only intravascular fluorescence, but also of local QD accumulation near microvessel bifurcations and for tracking of extravasating QD aggregates. To determine what multiphoton excitation wavelength would best minimize endogenous background autofluorescence in skeletal muscle, tissue was excited over a range of wavelengths from and spectral emission scans with bandwidths were collected from . 2.4.Analysis of In Vivo QD EliminationTo quantify QD elimination, fluorescence intensity was measured in defined regions of interest within microvessels and the surrounding tissue and normalized to baseline. Intensity values were corrected for background, which was determined in the extravascular space surrounding the blood vessels. Visual inspection of the fluorescent time-course profiles indicated that QDs were eliminated from LPS-treated mice much more rapidly than controls. To quantify in vivo circulating kinetics we determined elimination rate constants (Kel) and circulating QD half-lives in three control and three LPS treated mice. QD clearance was modeled as a first order elimination reaction where Solving and rearranging Eq. 1 to the form , where QD/QDo is normalized fluorescence, is time, and Kel is the elimination rate constant, enabled us to determine Kel by linear regression and algebraically. A test was performed (SigmaStat 3.0, Systat Software Inc, Richmond, California) to test for differences in Kel and circulating half-life between groups.While we found no increase in background fluorescent signal in general, we did observe some evidence of QD aggregates accumulating in and extravasating from the skeletal muscle microcirculation of LPS-treated mice. Since LPS is known to activate components of the reticuloendothelial and immune system including macrophages (liver Kupffer cells and circulating monocytes) and leukocytes that roll and adhere to the microvascular endothelium, we suspect that these cells were accumulating QDs in vivo. To assess whether activated leukocytes could nonspecifically accumulate QDs, we isolated mouse leukocytes from whole blood using 7% dextran ( ; Sigma, Ontario) ( vol/vol). Washed leukocytes were resuspended in RPMI-1640 medium (Invitrogen, Ontario) and incubated at for with TNFalpha in the presence of QDs at the estimated in vivo concentration used for microvascular imaging. TNFalpha is a proinflammatory mediator that activates leukocytes and macrophages. Cells were fixed using 4% paraformaldehyde and analyzed using flow cytometry (Epics XL-MCL, Beckman Coulter, Fullerton, California). 3.Results3.1.Near IR Excitation Reduces Background Skeletal Muscle AutofluorescenceTissue autofluorescence arises when a variety of intrinsic molecules including NAD(P)H, flavins, retinol, tryptophan, and its indolamine derivatives are excited by UV or near-IR light.16 To minimize tissue autofluorescence and maximize microvessel fluorescence contrast, skeletal muscle was excited in the IR at [Fig. 1a versus Fig. 1b]. We found that exciting the tissue at increasingly longer wavelengths, from , resulted in a reduction in peak autofluroescent signal at [Fig. 1c]. Moving to longer excitation wavelengths was also advantageous for imaging skeletal muscle because it enabled deeper tissue penetration with less photon scatter. Since the autofluorescence signal ranged from below our cutoff emission wavelength of to approximately , which overlapped with the emission spectrum of smaller and less “bright” nontargeted QDs, we opted to use the brighter QDs, which have an emission maximum at and a relatively narrow emission bandwidth from . Fig. 1Multiphoton excitation wavelength dependence of mouse hind limb skeletal muscle autofluorescence. (a) Tissue autofluorescence when excited at compared to (b) the same tissue excited at , NA water-immersion objective with emission bandwidth ; power was out of the objective. (c) Spectral profiles obtained from an imaging series ranging from tissue excitation at with emission bandwidths. To test for possible photobleaching, images were reacquired at 750, 800, and . The scale bar is .  3.2.In Vivo QD Fluorescent Contrast ImagingOur first question regarding in vivo QD behavior was how they were distributed within the blood. We found QDs to occupy the plasma space between red blood cells without being incorporated into red blood cells themselves. Figure 2 shows rapid single-frame high-resolution images of red blood cells flowing through a -diam capillary and a relatively larger -diam feeding arteriole. Dark nonfluorescent red blood cells can clearly be distinguished from fluorescent plasma gaps containing QDs, which provide good imaging contrast between plasma, erythrocytes, and background tissue. We found no evidence that QDs were taken up by erythrocytes over the time course of this study as erythrocytes remained nonfluorescent; however, the slight speckle on some erythrocytes seen in high-resolution images suggested that there may have been some minor adsorption to the outer membrane. A thin fluorescent film was detected between the boundary of the erythrocyte membrane and the inner microvessel wall (Fig. 2a)]. Fig. 2Optical sections of skeletal muscle microvessels. Multiphoton rapid scans of (a) a single capillary and (b) microvascular arterioles using an upright laser scanning confocal microscope configuration show that QDs are confined to the plasma space between red blood cells ( excitation, fluorescent emission , NA dipping objective). In (a) we see a train of red blood cells flowing through a capillary; red blood cells (arrows A, B, and C) are nonfluorescent and detected by contrast with the fluorescent QDs filled plasma gaps (arrow D). The characteristic red blood cell “tail” is indicative of red blood cell deformation as it passes through a capillary diameter smaller than its own diameter. A thin fluorescent layer can be seen between the red blood cell and the capillary cell wall (arrow E). In larger diameter arterioles (b) red blood cells retain their discoid shape (arrow G). Arrow F indicates fluorescent plasma. The scale bars are 8 and , respectively. 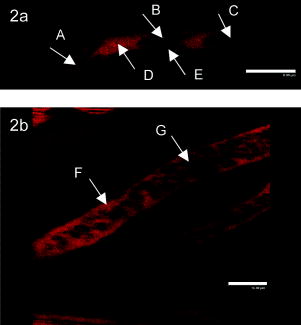 3.3.In Vivo Microvascular Imaging Using QDs and Multiphoton MicroscopySince QDs provided good microvascular imaging contrast, we next evaluated their ability to facilitate deep tissue mapping of the functional microcirculation. To do this, we used multiphoton microscopy optical sectioning and three-frame averaging to obtain images of the mouse skeletal muscle microcirculation to depths of . Figures 3a, 3b, 3c, 3d depict a reconstructed pseudocolored (for depth) composite image of a complete skeletal muscle microvascular unit, comprising feeding arteriole, capillary network, and collecting venule. Single-frame-reconstructed 3-D black and white images [rotated to show top and side views of Fig. 3d] show larger dark (fluorescent) feeding arterioles branching off to individual capillaries, which run perpendicular to the feeding arterioles and parallel to muscle fibers (not shown in the image). In individual capillaries, fluorescent plasma gaps appear as dark objects, while white spaces indicate the presence of nonfluorescent red blood cells. Accordingly, the single-frame image provides static information on capillary red cell lineal density (LD, RBC/mm capillary length) and maps the 3-D microvascular architecture; however, it does not provide any dynamic information. To obtain dynamic information from a single capillary, individual line scans can be performed to generate space-time images5, 17 (STIs), which provide hemodynamic information on red cell velocity and lineal density. An example is shown in Fig. 3e. Fig. 3In vivo three-frame average composite multiphoton image of the skeletal muscle microcirculation using fluorescent QDs with emission range of . Excitation at was delivered through a NA water-immersion objective lens with out of the objective. The capillary network is orientated within the dashed lines from 7 to 2 o’clock. In the centre of the image, a deep collecting venule (V) is running beneath the capillary network (CN), which is supplied by feeding arterioles (FA) on the left and drained by a collecting venule on the right. Color bar indicates depth. Scale bar is . The enlarged panel (d) distinguishes between flowing capillaries with continuous fluorescent signal (arrow B) and stopped-flow capillaries with a punctate fluorescent signal (arrow A). Different perspectives of a single frame image from panel (d) show both fluorescent plasma gaps (dark objects, liquid phase) and nonfluorescent red blood cells (bright spaces, solid phase), indicative of the two phase nature of capillary blood flow. (e) Space time image (STI) generated from a line scan (milliseconds per line) across a single capillary, where and are the spatial and time dimensions, respectively. Red cell velocity can be calculated from the slope of the dark bands, while red cell lineal density can be determined from the number of red cells (dark bands) at a given time.  In contrast to the single-frame image, acquiring microvascular images using three-frame averaging (images were acquired at using bidirectional scan mode with off-line phase correction) identifies putative functional or flowing capillaries as the temporal and spatial variation in fluorescent plasma gaps results in a continuous fluorescent signal along the length of the capillary. Note that stopped-flow vessels, which increase in various disease states, generate a discontinuous or punctate fluorescent signal when acquired as a three-frame average because stationary nonfluorescent red blood cells produce nonfluorescent gaps in the fluorescent signal. By comparison, vessels with only plasma flow produce a continuous fluorescent signal; however, these vessels can not be deemed “functional” since they do not contain erythrocytes. In the panel in Fig. 3d, enlarged, we see evidence of both continuous-flow (continuous fluorescent signal along the capillary) and stopped-flow capillaries (discontinuous fluorescent signal along the capillary). To determine microvascular functionality, one must assess the three-frame average image relative to the single-frame image. Comparing the nature of the fluorescent signals in three-frame and single-frame images [Fig. 3d], we determined that most microvessels were in fact functional, that is they showed both a continuous fluorescent signal and the presence of red blood cells. 3.4.In Vivo QD Stability for Microvascular ImagingDuring our initial imaging studies of the inflamed microcirculation, we were surprised to find an absence of QD fluorescent signal after LPS injection. To investigate the disappearance of QDs from the circulation, we performed in vivo kinetic experiments by sampling the fluorescent signal in single microvessels ( diameter) over time. Figure 4 shows the time course of mPEGylated QD clearance from the circulation. We found the elimination rate constant (Kel) to be almost 7 times greater in the LPS treated mice compared to control ( in LPS versus in control, ). The increased Kel in LPS treated mice was reflected by a significant decrease in circulating QD half-life compared to control ( in LPS versus in control, ). Since the normalized QD signal in inflamed mice decreased to less than 10% by , the rapid clearance of QDs offers an explanation for why no fluorescent signal was detected by . Fig. 4QD clearance from mouse circulation: (a) example of surface skeletal muscle microvessels used to follow the in vivo time course of QD clearance form the circulation. Microvessels were imaged using multiphoton microscopy ( excitation, NA water-immersion objective, emission fluorescence). Circles indicate regions of interest for intravascular fluorescence and background measurements. (b) The time course of QD elimination for control and LPS treated mice. The scale bar is .  While we confirmed ex vivo that QDs accumulate in a number of tissues including the liver, spleen, kidney, and lung (Fig. 5 ), we also observed the in vivo accumulation of QD aggregates at microvascular bifurcations in skeletal muscle (Fig. 6 ). Additionally, we observed the extravasation of QD aggregates from the microcirculation (Fig. 6). To assess whether activated leukocytes might enhance nonspecific QD uptake and accumulation, we isolated white blood cells and treated them with TNFalpha in the presence of QDs. Flow cytometry analysis revealed that activated monocytes (circulating phagocytes) were more likely to take up QDs than nonactivated monocytes (Table 1 ). Fig. 5Accumulation of QDs in mouse liver, lung, spleen, and kidney after treatment with LPS. Organs were removed and imaged in cross section using high-resolution multiphoton imaging ( excitation, NA water-immersion objective, emission fluorescence). While QD fluorescence was virtually eliminated from the circulation, we found evidence of QD accumulation in all organs examined. The color bar indicates fluorescent intensity and the Scale bar is .  Fig. 6QD accumulation at a microvascular bifurcation and extravasation from the skeletal muscle microcirculation in LPS-treated mice. QDs were imaged using multiphoton microscopy ( excitation, NA water-immersion objective, emission fluorescence). QD aggregates can be seen to accumulate at multiple locations near the microvascular bifurcation (arrow A) and extravasate from the microcirculation (arrow B). The color bar indicates fluorescence intensity and the scale bar is .  Table 1Percent of isolated leukocytes that accumulate QDs.
Isolated leukocytes from CD1 mice were treated with TNFα (200 ng/ml) and incubated with quantum dots for three hours at 37°C/5% CO2 using gentle mixing. Cells were fixed in 4% paraformaldehyde and QD fluorescence detected by flow cytometry. Values indicate the % of cells with QD signal and are the average of two samples. 4.DiscussionIn this paper, we have shown that near-IR multiphoton imaging of nontargeted mPEGylated QDs provides excellent in vivo fluorescent contrast for high-resolution imaging of the skeletal muscle microcirculation. Using this approach, we were able to minimize tissue autofluorescence and resolve all major components of the complete microvascular unit, including feeding arterioles, capillary networks, and collecting venules. This is a distinct advantage over other optical imaging modalities, bright-field microscopy, or OPS imaging, as they lack the resolving power to detect deep microvascular structures. Despite the multiphoton imaging advantage of limiting fluorescent excitation to the focal volume and nowhere else, the potential for local tissue damage remains. Working with laser powers out of the objective in the range, we found no evidence of skeletal muscle damage or abnormal microvascular flow. This contrasts with the sensitivity of the mouse eye, where we observed that powers above a few milliwatts induced hyperemia.18 While we confirmed that QDs are taken up by the liver and spleen,15, 19 we also observed that mPEGylated QDs aggregated at microvascular bifurcations, suggesting that hemodynamic forces play a role in the biodistribution of QDs, presumably by increasing the contact time between nanoparticles and rolling or adhered leukocytes. This microvascular localization of QDs likely explains why the circulating half-life of QDs assessed by whole body noninvasive imaging was found to be twice that determined by venipuncture.15 Using the higher imaging resolution afforded by multiphoton microscopy, we were able to avoid regions with QD accumulation and sample fluorescent signal from the center of microvessels. Not only did QD aggregates accumulate in microvascular bifurcations, but we also observed QD aggregates extravasating from the microcirculation. Here we assume that activated lymphocytes were responsible for clearing the QDs via the lymph, which may also help explain the observation that QDs accumulate in lymph nodes.15 An important consideration when using microvascular imaging contrast agents is their circulating half-life. While core/shell size has a negligible effect on QD clearance, increasing the length of the PEG substitution from mPEG-750 (300 residues/QD) to mPEG-5000 (100 residues/QD) increased15 the circulating half-life 20-fold. In our study, we found that the circulating half-life of mPEG QDs decreased seven-fold, from , when mice were stimulated with bacterial LPS. This reduction in circulating half-life means that QD imaging should be done soon after injection to maximize image contrast between microvessels and tissue. Since LPS causes a systemic inflammatory and coagulation response, including complement activation, increased production of acute phase proteins, and activation of macrophages, it is conceivable that an activated reticuloendothelial system, which removes exogenous particles from the blood, was responsible for enhanced nonspecific clearance of QDs in endotoxemic mice. This is supported by our findings that QDs accumulated in endotoxemic liver, spleen, and TNFalpha-activated circulating monocytes (phagocytes). Increasing the density and length of nanoparticle surface PEGylation has been shown to reduce nonspecific uptake and increase circulating half-life in normal animals,15, 20 suggesting that additional PEGylation or other surface modifications may increase QD circulating half-life under endotoxemic conditions. Further study is required to assess the effect of extending the degree of QD PEGylation or other surface modifications on increasing the QD imaging window under endotoxemic conditions. 5.ConclusionTo translate this experimental microvascular imaging capability from the bench to the bedside will require the ability to image through the skin and deep into the highly light absorbing and scattering skeletal muscle tissue. The potential for diagnostic microvascular imaging in deep tissues looks promising as advances in technology, including femtosecond laser pulses beyond the IR range, nanocrystals with fluorescent emissions in the far-IR spectral region, increased sensitivity of photon detectors, new fiber optic systems for light delivery, and collection and optical clearing agents, will collectively enhance high-resolution optical imaging of the microcirculation in deep tissue. We believe this optical imaging approach can be extended to investigate other important microvascular phenomena in deep tissue including leukocyte behavior and microvascular permeability, which may provide better patient treatment through better diagnosis of the microvascular state. AcknowledgmentsThe authors acknowledge the help of Yingjin Wang with animal experiments and Anna Merideth with flow cytometry. Support is acknowledged as follows. R. M. Bateman is a Heart and Stroke Foundation, Michael Smith Foundation for Health Research and CIHR/HSFC IMPACT Strategic Training Postdoctoral Fellow. K. R. Walley is a Michael Smith Foundation for Health Research Distinguished Scholar. ReferencesH. J. Varghese,
L. T. MacKenzie,
A. C. Groom,
C. G. Ellis,
A. F. Chambers, and
I. C. MacDonald,
“Mapping of the functional microcirculation in vital organs using contrast-enhanced in vivo video microscopy,”
Am. J. Physiol. Heart Circ. Physiol., 288
(1), H185
–193
(2005). 0363-6135 Google Scholar
M. Stroh,
J. P. Zimmer,
D. G. Duda,
T. S. Levchenko,
K. S. Cohen,
E. B. Brown,
D. T. Scadden,
V. P. Torchilin,
M. G. Bawendi,
D. Fukumura, and
R. K. Jain,
“Quantum dots spectrally distinguish multiple species within the tumor milieu in vivo,”
Nat. Med., 11
(6), 678
–682
(2005). 1078-8956 Google Scholar
Y. Sakr,
M. J. Dubois,
D. De Backer,
J. Creteur, and
J. L. Vincent,
“Persistent microcirculatory alterations are associated with organ failure and death in patients with septic shock,”
Crit. Care Med., 32
(9), 1825
–1831
(2004). 0090-3493 Google Scholar
P. E. Spronk,
C. Ince,
M. J. Gardien,
K. R. Mathura,
H. M. Oudemans-van Straaten, and
D. F. Zandstra,
“Nitroglycerin in septic shock after intravascular volume resuscitation,”
Lancet, 360
(9343), 1395
–1396
(2002). https://doi.org/10.1016/S0140-6736(02)11393-6 0140-6736 Google Scholar
C. G. Ellis,
R. M. Bateman,
M. D. Sharpe,
W. J. Sibbald, and
R. Gill,
“Effect of a maldistribution of microvascular blood flow on capillary O(2) extraction in sepsis,”
Am. J. Physiol. Heart Circ. Physiol., 282
(1), H156
–164
(2002). 0363-6135 Google Scholar
W. Denk,
J. H. Strickler, and
W. W. Webb,
“Two-photon laser scanning fluorescence microscopy,”
Science, 248
(4951), 73
–76
(1990). https://doi.org/10.1126/science.2321027 0036-8075 Google Scholar
W. R. Zipfel,
R. M. Williams, and
W. W. Webb,
“Nonlinear magic: multiphoton microscopy in the biosciences,”
Nat. Biotechnol., 21
(11), 1369
–1377
(2003). https://doi.org/10.1038/nbt899 1087-0156 Google Scholar
P. T. So,
C. Y. Dong,
B. R. Masters, and
K. M. Berland,
“Two-photon excitation fluorescence microscopy,”
Annu. Rev. Biochem., 2 399
–429
(2000). 0066-4154 Google Scholar
W. C. Chan and
S. Nie,
“Quantum dot bioconjugates for ultrasensitive nonisotopic detection,”
Science, 281
(5385), 2016
–2018
(1998). https://doi.org/10.1126/science.281.5385.2016 0036-8075 Google Scholar
M. Bruchez Jr., M. Moronne,
P. Gin,
S. Weiss, and
A. P. Alivisatos,
“Semiconductor nanocrystals as fluorescent biological labels,”
Science, 281
(5385), 2013
–2016
(1998). https://doi.org/10.1126/science.281.5385.2013 0036-8075 Google Scholar
D. R. Larson,
W. R. Zipfel,
R. M. Williams,
S. W. Clark,
M. P. Bruchez,
F. W. Wise, and
W. W. Webb,
“Water-soluble quantum dots for multiphoton fluorescence imaging in vivo,”
Science, 300
(5624), 1434
–1436
(2003). https://doi.org/10.1126/science.1083780 0036-8075 Google Scholar
E. B. Voura,
J. K. Jaiswal,
H. Mattoussi, and
S. M. Simon,
“Tracking metastatic tumor cell extravasation with quantum dot nanocrystals and fluorescence emission-scanning microscopy,”
Nat. Med., 10
(9), 993
–998
(2004). 1078-8956 Google Scholar
V. Nechyporuk-Zloy,
C. Stock,
H. Schillers,
H. Oberleithner, and
A. Schwab,
“Single plasma membrane channel detection by using dual-color quantum dot labeling,”
Am. J. Physiol.: Cell Physiol., 291
(2), C266
–269
(2006). https://doi.org/10.1152/ajpcell.00633.2005 0363-6143 Google Scholar
F. Helmchen and
W. Denk,
“Deep tissue two-photon microscopy,”
Nat. Methods, 2
(12), 932
–940
(2005). 1548-7091 Google Scholar
B. Ballou,
B. C. Lagerholm,
L. A. Ernst,
M. P. Bruchez, and
A. S. Waggoner,
“Noninvasive imaging of quantum dots in mice,”
Bioconjugate Chem., 15
(1), 79
–86
(2004). https://doi.org/10.1021/bc034153y 1043-1802 Google Scholar
W. R. Zipfel,
R. M. Williams,
R. Christie,
A. Y. Nikitin,
B. T. Hyman, and
W. W. Webb,
“Live tissue intrinsic emission microscopy using multiphoton-excited native fluorescence and second harmonic generation,”
Proc. Natl. Acad. Sci. U.S.A., 100
(12), 7075
–7080
(2003). https://doi.org/10.1073/pnas.0832308100 0027-8424 Google Scholar
D. Kleinfeld,
P. P. Mitra,
F. Helmchen, and
W. Denk,
“Fluctuations and stimulus-induced changes in blood flow observed in individual capillaries in layers 2 through 4 of rat neocortex,”
Proc. Natl. Acad. Sci. U.S.A., 95
(26), 15741
–15746
(1998). https://doi.org/10.1073/pnas.95.26.15741 0027-8424 Google Scholar
R. M. Bateman,
K. C. Hodgson,
C. Van Breeman, and
K. R. Walley,
“Microvascular geometry and differential permeability in the eye during inflammation revealed with dual channel multiphoton microscopy,”
Proc. SPIE, 6089 60891Y
(2006). https://doi.org/10.1117/12.647309 0277-786X Google Scholar
M. E. Akerman,
W. C. Chan,
P. Laakkonen,
S. N. Bhatia, and
E. Ruoslahti,
“Nanocrystal targeting in vivo,”
Proc. Natl. Acad. Sci. U.S.A., 99
(20), 12617
–12621
(2002). https://doi.org/10.1073/pnas.152463399 0027-8424 Google Scholar
V. C. Mosqueira,
P. Legrand,
J. L. Morgat,
M. Vert,
E. Mysiakine,
R. Gref,
J. P. Devissaguet, and
G. Barratt,
“Biodistribution of long-circulating PEG-grafted nanocapsules in mice: effects of PEG chain length and density,”
Pharm. Res., 18
(10), 1411
–1419
(2001). https://doi.org/10.1023/A:1012248721523 0724-8741 Google Scholar
|


