
|
|
1.IntroductionAdvances in biomedical imaging are expected to improve disease detection and staging, facilitate treatment selection and monitoring, accelerate our understanding of disease pathogenesis and, together with the development of more selective and higher-affinity targeted diagnostic and therapeutic agents, lead to the transformation of general clinical practice toward personalized medicine. Among current challenges for effective translation of newly developing biomedical imaging technologies into clinical settings is identification of the most promising versatile, biocompatible, and nontoxic optical probes. In recent years, a variety of nanomaterials including quantum dots (QDs), 1, 2, 3, 4, 5, 6 metal nanoshells,7 gold, and functional silica nanoparticles8 have begun to show their utility in imaging applications, promising the tremendous scientific and technological potential of nanobiotechnology.9, 10, 11 Currently, the most prominent class of fluorescent nanoprobes in biological imaging are QDs. They are characterized by outstanding photostability and brightness, and have been used for a variety of biomedical applications, such as circulatory system imaging, sentinel lymph node mapping, cellular imaging, and in-vivo cell tracking. 4, 5, 12, 13, 14, 15, 16, 17, 18 Although QDs offer a number of potential benefits, several properties limit their widespread application. There are considerable concerns about QD disposal and the toxic heavy metals within the QD core (i.e., cadmium, lead), which can leach into solution and cause harm to both cells in culture and animals.18, 19, 20 Further, the lack of detailed toxicological information on the potential side effects of in-vivo QD usage raises the question of whether or not these nanoparticles are appropriate for use in biological, and particularly, clinical applications.1, 21 Quantum dots are natively incompatible with water, and must be coated with a polymer to allow for use in aqueous and biological settings, thus introducing a second foreign material into cells, tissue, or living organisms.22 Furthermore, single colloidal quantum dots emit intermittently due, in part, to uncontrolled surface states, decreasing their usefulness in single particle tracking within live cells or intracellular fluids.23 Organic and metallorganic dye molecules have long been used for labeling biological samples to increase contrast in both absorption-based and fluorescent analyses.24 For fluorescent analyses, emitters are available in colors spanning the spectrum from ultraviolet to near-infrared wavelengths (300 to ). Although there are a wide variety of organic fluorophores available, individual dye molecules may suffer from limited brightness (low absorption cross section and/or low quantum yield), environment-dependent quenching, and photobleaching.25 Recent work has shown that the properties of organic fluorophores can be improved by covalently integrating them into the core of a core-shell silica nanoparticle [Fig. 1a ].8, 26 These particles, referred to as C dots, can be synthesized with radii down to 10 to , as shown by scanning electron microscopy [Fig. 1b]. Covalent incorporation of dye species such as tetramethylrhodamine isothiocyanate (TRITC) [Fig. 1a] into the pseudo-solid-state environment within the silica particle enhances both the brightness and photostability of the dyes, while providing a robust, water-soluble vehicle. As previously reported,26 the brightness per C dot is more than an order of magnitude greater than that of the constituent dye, creating a probe with a perparticle brightness within a factor of 2 to 3 of QDs of similar hydrodynamic size and emission wavelength. As well, by integrating multiple independent emitters into a single particle, the particles are less prone to stochastic blinking, facilitating sustained imaging of the particles. Under saturated excitation, a single C dot can emit 10 or more photons in the time that a single fluorophore can emit one photon (depending on the number of individual fluorophores in particle). This makes them particularly useful for particle tracking experiments where collecting the maximum number of photons per particle per unit time is critical. Furthermore, this architecture is readily surface functionalized to facilitate targeting or uptake in biological systems.26 Finally, the sol-gel synthesis27 can be tailored to create particles with narrow particle size distributions and diameters from tens of nanometers up to microns, facilitating size-selective analyses.26 Fig. 1C dot core-shell fluorescent silica nanoparticles, shown in schematic form (a) with the covalently bound TRITC dye within the particle core. (b) Scanning electron micrographs of 30-nm-diam C dot particles. Scale bar .  Perhaps the most promising characteristic of C dots is that because they are composed primarily of silica, they are expected to be biologically inert and thus potentially non-toxic for research and biomedical applications. In this study, we evaluate biodistribution and toxicity of these particles, and investigate their biomedical utility in a series of in-vivo experiments. 2.Materials and Methods2.1.AnimalsFemale ICR mice, 7 to 8 weeks old, were purchased from Taconic (Hudson, New York) for the biodistribution and toxicity evaluation. Male severe combined immunodeficiencies (SCID/NCr) mice (BALB/C background), 6 weeks old, were obtained from the National Cancer Institute (Bethesda, Maryland), for all other experiments. 6 to 10 week old FVB/N mice (inbred) or transgenic mice that carry green fluorescent protein (GFP) driven by chicken -actin promoter [FVB. (ACTB-EGFP)B5Nagy/J; strain 003516; The Jackson Laboratory, Bar Harbor, Maine] were used for bone marrow collection. All experiments were conducted under identical conditions, following recommendations of the Institutional Laboratory Animal Care and Use Committee of Cornell University. 2.2.C Dot SynthesisThe synthesis and photophysical characterization of 30-nm-diam C dot particles has been explored at length, and the particles used in these experiments were prepared by the same synthetic method as reported elsewhere.28 Briefly, an organic dye [tetramethylrhodamine isothiocyanate or Oregon Green 488 isothiocyanate (TRITC or OG488) Invitrogen Corporation, Carlsbad, California] was conjugated via the isothiocyanate group to 3-aminopropyltriethoxysilane (APTS, Gelest, Incorporated, Morrisville, Pennsylvania) at a molar ratio of 1:50 (dye:APTS) in degassed absolute ethanol (200 proof) under nitrogen. The resulting solution was then diluted to a concentration of in an ethanolic solution of 0.02 M ammonia (Aldrich) and 0.855-M deionized water. To this, a pure silica precursor [tetraethoxysilane (TEOS), Sigma-Aldrich Corporation, St. Louis, Missouri] was added to a concentration of . After reacting for at least , the cores were coated with further TEOS added in 23 equal aliquots at intervals (to minimize secondary nucleation). The core-shell particles were allowed to react for a further and were then dialyzed [Pierce, Rockford, Illinois, 3500 molecular weight cut-off (MWCO) membrane] to deionized water and analyzed to determine size, concentration, and photophysical properties26 before injection into the mice. 2.3.Biodistribution and Toxicity Experiments30-nm-diam particles were injected intravenously at or in of deionized water via the tail vein of mice anaesthetized with Avertin ( in 0.85% ; body weight). For each concentration, at least three mice were collected at 1, 3, 7, 21, and 60 days post-injection. As a control, mice were injected with distilled water and collected over the same time schedule. Mice were observed daily and subjected to careful pathological evaluation at the time of necropsy. Brain, thymus, lung, liver, kidney, adrenal gland, ovary, spleen, pancreas, intestine, heart, thigh muscle, and skin were fixed in phosphate-buffered 4% paraformaldehyde, and representative specimens were further characterized by microscopic analysis of 4- -thick paraffin sections stained with hematoxylin and eosin following standard practices of toxicologic pathology assessment.29 For evaluation of C dot distribution, sections were counterstained with nuclear stain (DAPI). Quantitative assessment of fluorescence was performed by using custom image analysis software written using the Interactive Data Language (IDL), image analysis platform (Research Systems Incorporated, Boulder, Colorado). C dots (and cell nuclei) were located by thresholding the blue (and red) channels using the median image value plus five (two) times the image standard deviation. Nonzero regions were eroded, dilated, and then enumerated. Each region of fluorescence in the C dot channel was assigned to the particular nucleus to which it is closest. After collection of at least five images for each specimen, all data were expressed as a mean standard deviation. 2.4.ImmunohistochemistryDeparaffinized sections were exposed to 0.02% trypsin (0.05-M , pH 7.8, with 1% calcium chloride, , ) for antigen retrieval. After avidin/biotin blocking, samples were incubated with F4/80 antibodies (AbD Serotec, Raleigh, North Carolina) for 1 h at room temperature and subsequently treated with 0.3% in methanol. Following incubation with the secondary biotinylated goat anti-rat antibodies (Vector Labs Incorporated, Burlingame, California, 1:100, , room temperature) and fluorescein avidin D (Vector Labs; , , room temperature), the samples were counterstained with DAPI. Samples were mounted with (Biomeda Corporation, Foster City, California), sealed with Clarion Mounting Medium (Biomeda Corporation, Foster City, California), and imaged by fluorescence microscopy (Carl Zeiss Axioskop 2). 2.5.In-Vivo Capillary and Macrophage LabelingMice were prepared for imaging as previously described.30 Briefly, mice were anesthetized with 3.5% Isoflurane and placed on a heating pad throughout the experiment. Fur was removed by shaving and Nair application. of particles were injected into the tail vein for endothelial blood vessel labeling and intradermally for macrophage labeling. The mice were maintained at Isoflurane for anesthesia and were imaged after particle injection on a multiphoton microscope.30 During imaging, the dorsal skin was immobilized to isolate the imaging area from body motion to facilitate high-resolution imaging. 2.6.Sentinel Lymph Node Identificationof trypan blue was injected intradermally in the right paw of an aesthetized mouse. After 5 min, the skin was opened and the lymph node located. of C dots were injected intradermally at the same site on the paw. The lymph node was imaged by brightfield and fluorescence on an Olympus OV100 whole-mouse imaging system (Olympus America Incorporated, Melville, New York). 2.7.C Dot - TAT Peptide ConjugationOligopeptides of the active region of the TAT protein (residues 48 to 57) were purchased from Sigma-Genosys (The Woodlands, Texas) with a cysteine residue at the C-terminus. To create the peptide-particle conjugates, 3-aminopropyltriethoxysilane (Gelest Incorporated, Morrisville, Pennsylvania) was reacted with N-( -maleimidobutyryloxy)succinimide ester (GMBS, Pierce Incorporated, Rockford, Illinois) in a 1:1.5 ratio in dimethyl sulfoxide (DMSO) to yield a maleimide-silane. This product was reacted overnight onto the C dot surface in basic ethanol (0.1-M ). The maleimide-functionalized particles were then reacted with a 100 times excess of in ethanol to yield peptide-functionalized particles. Finally, the particles were dialyzed overnight to deionized water to remove unreacted peptide and ethanol, and filtered through a sterile polytetrafluoroethylene (PTFE) filter. 2.8.Establishment of PCN2 and PCN2-EGFP Prostate Cancer Cell LinesCell line PCN2 was established from prostate carcinoma of 241-day-old PB-Cre4, mice.31 PCN2 tumor cells were cultured in Dulbecco’s modified eagle medium (DMEM) containing 10% fetal bovine serum (FBS) at in a humidified incubator with 5% . To prepare PCN2-EGFP cells, PCN2 cells were infected with the pLEGFP-N1 retroviral vector from Clontech (Palo Alto, California) to introduce EGFP to the cells. Viral supernatant containing EGFP was generated by packaging cell line EcoPack2-293 (Clontech) according to manufacturer’s protocols. PCN2 cells were exposed to viral supernatant containing EGFP in a 6-cm dish at a multiplicity of infection of 1:1 in the presence of polybrene (Sigma, Saint Louis, Missouri) for . Subsequently, the viral supernatant was replaced with fresh medium. After further incubation for , infected PCN2 cells were selected with G418 for 2 weeks and EGFP positive cells (PCN2-EGFP) were then sorted by FACS. 2.9.C Dot Labeling in Cell CulturePCN2 cells were incubated with 1.66 picomol of either bare or TAT-conjugated 30-nm C dots for 2 h, washed three times with phosphate buffered saline (PBS), plated on slides, and incubated overnight. The following day, the cells were incubated with a lipophilic fluorescent probe ( Molecular Probes, Eugene, Oregon) for plasma membrane staining, washed with PBS, counterstained with DAPI in some experiments, mounted as before on a Leica TCX-SP2 confocal microscope equipped with a oil 1.40 NA objective with separate excitation for the C dots and (543 and , respectively). 2.J.Isolation and Labeling of Bone Marrow Cells with Tat Peptide-Conjugated ParticlesFemoral and tibial bone marrow cells were collected from 6 to 10 week old FVB/N or FVB.Cg-Tg(ACTB-EGFP)B5Nagy/J mice by flushing excised and cut leg bones with washing medium (DMEM including 2% FBS). The collected cells were washed twice and filtered through a nylon filter (BD Biosciences, San Jose, California) to remove noncellular material. Isolated bone marrow cells were incubated with TAT-conjugated C dots for 2 h at particles/cell. After incubation and washing, the cells were injected via the tail vein into FVB/N mice irradiated with a lethal dose of x-rays to ensure removal of their own bone marrow cells. The mice were sacrificed by cervical dislocation 24-h post-injection, and tissue sections were analyzed as before. 2.K.Tracking Metastatic and/or Bone Marrow CellsPCN2-EGFP cells were labeled with TAT C dots as described for cell culture experiments but without labeling with or DAPI. Following incubation with TAT C dots for 2 h and PBS washing, cells were injected via the tail vein. For simultaneous tracking of two types of cells labeled with different color C dots, a mixture of PCN cells labeled with Oregon Green-based C dots (green) and bone marrow cells, labeled with TRITC-based C dots (red), were injected into mice intravenously. The lung was collected post-injection and imaged with multiphoton microscopy. 2.L.Statistical AnalysesAll statistical analyses in this study were done with InStat 3.06 and Prism 4.03 software (GraphPad, Incorporated, San Diego, California). Means were compared by estimation of the two-tailed P with the Mann-Whitney test. Statistical assessment of multiple samples was performed by one-way analysis of variance (ANOVA) and linear regression as necessary. 3.ResultsBefore investigating biomedical applications of the C dots, we first examined the biodistribution and potential toxicity of C dots in a mouse model system. No abnormal clinical signs were evident in mice exposed to tetramethylrhodamine (TRITC) dye-based 30-nm-diam core-shell C dots, even at the highest tested concentration of administered in of deionized water by tail-vein injection. The mice behaved normally throughout the experiment, and showed no pathological alterations typical for either acute (cellular swelling, necrosis, apoptosis, hemorrhage, etc.) or chronic (hyperplasia, metaplasia, fibrosis, calcification, etc.) responses to injury in any of the assessed tissues and organs. Analysis of tissue samples revealed that the C dots were predominantly localized in the spleen, liver, and lung [Figs. 2a, 2b, 3, 4 ] following their initial appearance in blood vessels throughout the body (Fig. 5 ). The particles were mainly localized in the cells of the mononuclear phagocyte system such as F4/80 positive Kupffer cells in the liver [Fig. 2d]. The distribution pattern of C dots in the lung, liver, and spleen was found to be time and concentration dependent, as measured by a decrease in the number of cells with C dot fluorescence over time [Figs. 2c, 3, 4]. At concentration , cells with TRITC C dots became almost undetectable in the liver between 21 and 60 days post-injection [Figs. 2c and 4]. To confirm that the observed disappearance of particles was not due to the loss of their fluorescence intensity, we measured the emission of C dots incubated at by spectrofluorometry over time, relative to samples stored at . This experiment showed that although the particle fluorescence decreased slightly over time, this nonspecific degradation was only per month and could not result in the net loss of fluorescence seen in vivo [Fig. 6a ]. Although the particle size is too large for excretion through the kidneys and urinary system,32 the localization of the particles within the mononuclear phagocyte system indicates that the particles may be scavenged and cleared by macrophages consistently with results from pulmonary silica particle exposure.33, 34, 35 This possibility is in agreement with our observation that the average dot fluorescence per cell remained relatively constant [Fig. 6b]. Fig. 2Biodistribution of C dots following tail vein injection. TRITC C dots were found to localize predominantly in (a) the spleen and (b) liver with peak levels of particle fluorescence (red) occurring within the first week of intravenous injection (DAPI counterstaining). Hematoxylin and eosin stained parallel sections of spleen and liver show no pathological changes. The number of fluorescent cells (mean standard deviation) in the liver was monitored over time (c), showing that the C dots were almost cleared over the course of approximately 60 days (red; , blue; 30-nm C dots). (d) Localization of the C dots within F4/80-positive Kupffer cells (arrow, green) of the liver. FITC Avidin D method. Scale bar: .  Fig. 3Concentration-dependent biodistribution of TRITC C dots injected intravenously. Lung images 3 days after injection of (a) and (c) and (b) and (d) of C dots. (a) through (d) show DAPI counterstaining. (c) and (d) are fluorescent images overlaid with a brightfield image of the same area. The scale bar: .  Fig. 4Time-dependent biodistribution of 30-nm C dots in the liver after intravenous injection. (a) and (b) Control was injected with distilled water, imaged one day post-injection. (c) and (d) TRITC-C dots imaged one day post-injection, (e) and (f) three days post-injection, (g) and (h) seven days post-injection, (i) and (j) 21 days post-injection, and (k) and (l) 60 days post-injection. (a) through (l) show DAPI counterstaining. (b), (d), (f), (h), (j), and (l) are fluorescent images overlaid with a brightfield image of the same area. The scale bar: .  Fig. 5(a) Labeling of capillaries with C dots immediately following a tail vein injection of TRITC C dots. Fluorescent capillaries containing C dots (arrow) were clearly visible in vivo at the base of the dermis via multiphoton microscopy. Here, imaging was accomplished using 880-nm excitation. Second harmonic generation from collagen fibrils is shown in green. Fluorescence emission (500 to ) is shown in red. The large red structure in the upper left hand corner is from an autofluorescent hair follicle. The skin was imaged in vivo using the temporary skin immobilizer as described in Ref. 30. (b) Labeling of macrophages with C dots. Macrophages (arrow) were detected through the skin of a mouse following intradermal injection of C dots. (c) through (f) Sentinel lymph node mapping with C dots. (c) The arrow indicates the auxiliary lymph node marked with trypan blue. Fluorescent images of the node were taken with the Olympus OV 100 system (d) before and (e) at 1 and (f) after administration of C dots injected at the same site as trypan blue. The scale bar: (a) , (b) , and (c) through (f) , respectively. 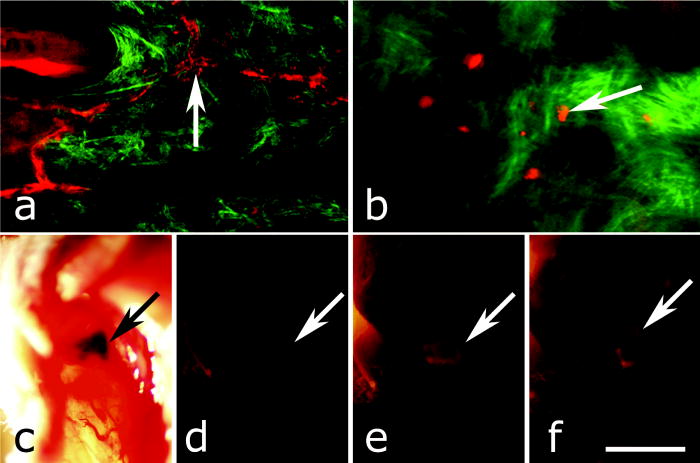 Fig. 6The stability of C dot fluorescence intensity and C dot localization in dermal cells. (a) The intensity of C dots that were incubated at in vitro only shows a 25% decrease over 4 weeks. The data were analyzed by linear regression (slope: , ). (b) The average intensity of C dots in the liver was fairly stable and unchanged. The average intensity (mean standard deviation) indicates the average pixel value of C dots in cells with particles. (c) After multiphoton imaging, F4/80 antigen was detected by FITC immunofluorescence in the sections of the skin of imaged mice. Note colocalization (yellow, arrow) of C dots (red) and F4/80 positive macrophages (green) of the dermis. Scale bar; . (Color online only.)  Having demonstrated the C dots to be a nontoxic and minimally invasive tool for in-vivo experiments, we sought to demonstrate their capabilities for live animal imaging. Multiphoton imaging [Fig. 5a] of intravenously injected C dots showed appreciable fluorescence within capillaries at the base of the dermis. In addition to intravenous injection, C dots were imaged following subcutaneous injection and found to localize within phagocytic cells within of injection [Fig. 5b]. Based on immunofluorescent staining for F4/80, phagocytic cells were determined to be macrophages [Fig. 6c]. As a demonstration of the use of C dots as clinical tools for biomedicine, we next tested the particles as tracers for sentinel lymph node mapping. After intradermal injection of Trypan blue followed by TRITC-based C dots into the mouse paw, the sentinel lymph node was marked by fluorescence in a whole-body imager from 30-s post-injection, and remained visible up to 1 h post-injection [Figs. 5c, 5d, 5e, 5f, 7 ]. Fig. 7Sentinel lymph node mapping with C dots. (a) Identification of the lymph node with trypan blue, (b) before C dot injection, (c) after C dot injection, (d) 1 min post-injection, (e) 5 min post-injection, (f) 10 min post-injection, (g) 30 min post-injection, and (h) 1 h post-injection. Arrows indicate the auxiliary lymph node. The scale bar indicates .  The appeal of fluorescent silica nanoparticles as biological probes comes not only from their bright and stable fluorescence, but also the ability to tune the particle surface toward particular applications. For example, biological applications frequently require the labeling of particular cells to facilitate imaging and tracing in vivo. Toward that end, cell-penetrating oligopeptides (e.g., HIV-1 36) can be covalently bound to the particle surface to mediate cellular uptake.37 We developed conjugation methods for functionalizing 30-nm TRITC-based C dots with TAT peptides. These functionalized particles were found to be readily endocytosed into intracellular vesicles in mouse prostate carcinoma cells [PCN2, Fig. 8a ], while bare particles showed minimal uptake under similar conditions [Figs. 8b and 9 ]. TRITC particle-labeled prostate carcinoma cells were introduced into the body intravenously to simulate the release of metastatic cells into the bloodstream by extravasation. Using the fluorescent C dot labels, in conjunction with GFP-expressing PCN2 cells, the cells were found to localize predominantly in the lung of the mouse, where they were imaged via ex-vivo multiphoton imaging [Fig. 8c]. This application demonstrates the use of these particles as tags for the tracking and identification of metastatic cells toward a better understanding of the spread of cancer through the body. Fig. 8Labeling and tracing cells with C dots. PCN2 cells were incubated with (a) TAT-conjugated and (b) bare silica TRITC C dots (red) for at , stained with membrane-specific lipophilic probe (green) and imaged by confocal fluorescence microscopy. The TAT-conjugated particles show efficient uptake into vesicles within the cytoplasm, when compared to the bare silica C dots (arrows). Green dots on images are artifacts that represent droplets formed in the aqueous culture media caused by their highly lipophilic nature. (c) Tumor cells expressing GFP (arrow) labeled with TRITC C dots (red) functionalized with TAT-peptide oligomers were imaged in the lung by multiphoton microscopy 5 h after tail vein injection. Multiphoton microscopy is accomplished using 880-nm excitation with two broad emission filters (380 to , green and 550 to , red). Note that nonspecific autofluorescnce and second harmonic generation showing lung structure is also visible in the green channel. (d) through (g) Bone marrow cells (arrows) were collected from transgenic mice that carry GFP driven by a chicken -actin promoter, (e), (f), and (g) labeled with TAT C dots, and (d) and (e) imaged in bone marrow smear with DAPI labeling, (f) the liver, and (g) the spleen after tail vein injection of irradiated recipient mice. The bone marrow cells that contain TRITC C dots are (e) yellow, while those without C dot labeling (d) are green. (h) Metastatic tumor cells labeled with OG488 C dots (green, arrow) and bone marrow cells labeled with TRITC C dots (red, arrowhead) were detected in the lung by multiphoton microscopy. The scale bar: (a) and (b), (c) and (h), and (d) through (g), respectively.  Fig. 9TAT peptide-mediated uptake of TRITC-based C dots (red). PCN2 murine prostate carcinoma cells (c) and (d) labeled with TAT C dots show significant particle uptake as compared to (a) and (b) PCN2 cells exposed to bare C dots. Counterstaining with lipophilic membrane dye (green). The scale bar indicates . (Color online only.)  This protocol was expanded to label primary bone marrow cells to demonstrate the versatility of TAT-peptide mediated particle uptake. We exposed TAT-conjugated TRITC-based C dots to freshly harvested bone marrow cells from transgenic mice expressing GFP under the control of a chicken -actin promoter. We then administered the C-dot-labeled cells to irradiated chimeric mice lacking viable bone marrow cells, and monitored the distribution of the cells in the body [Figs. 8d, 8e, 8f, 8g]. The TAT peptide-mediated labeling of these cells proved effective in tracking their fate following injection into the body, where they were found to localize predominantly in the bone marrow [Fig. 8e], liver [Fig. 8f], and spleen [Fig. 8g]. Finally, we investigated the feasibility of labeling different cell types with C dots of different colors. TAT peptide-labeled Oregon Green 488 (OG488) and TRITC-based 30-nm C dots were incubated with PCN2 and bone marrow cells, respectively. Following mixing both cell types and tail vein injection of the combined solution, organs were harvested and imaged using multiphoton microscopy. Optical lung sections collected 5 h post-injection showed that both cancer cells (green) and the bone marrow cells (red) can be easily detected [Figs. 8h and 1Video 1 ]. Interestingly, both cell types are commonly found to be colocalized, indicating possible functional interactions between bone marrow and metastatic cells. Video 1Tracking PCN2 and bone marrow cells by multiphoton microscopy. The colocalization of PCN2 metastatic cells labeled with OG488-based C dots (green) and bone marrow cells labeled with TRITC-based C dots (red) was observed in the lung of a mouse injected with a mixture of both cell types. The images were taken serially at intervals from the surface of the lung. (Color online only.) 1 > 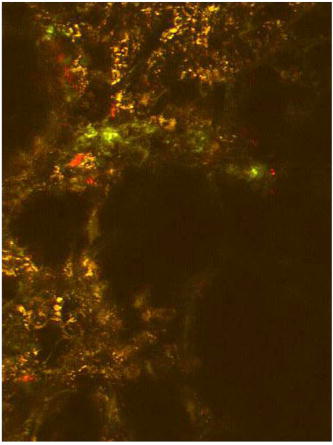 4.DiscussionBiological safety concerns are among the principle roadblocks on the way toward implementation of imaging nanoparticles into clinical practice. For example, the issue of QD toxicity caused by heavy metals (Cd, Pb, etc.) has been raised and is of particular importance for long-term in-vivo experiments. Recent studies have observed cytotoxicity in hepatocytes (a major target of injury), caused by the release of ions from the cadmium selenide QD core due to oxidization by air or UV light. 18, 19, 20, 38 Researchers have tried to combat this by applying surface coatings such as , polymers, or surfactants to reduce the release of heavy metals, but these treatments provide only partial protection to the core.1 Additional research has shown that certain QD surface coatings (e.g., mercaptoundecanoic acid) can actually decrease cell viability in cell culture studies.38 These problems have prompted us to test if recently described bright core-shell silica nanoparticles (C dots) could be a feasible alternative to QDs in various biomedical imaging applications. Available reports on toxicological effects of silica concentrate on pulmonary exposure (rather than intravenous) to simulate human exposure to particulates in air. Toxicological effects of colloidal (amorphous) silica are characterized fairly well as being less toxic than crystalline forms in experimental animals.39, 40 However, there are studies suggesting that inhalation of materials such as colloidal silica by mice induces dose- and size-dependent pulmonary effects, with ultrafine particles inducing greater lung inflammation and tissue damage than larger particles.41 Generally, these effects were characterized by an accumulation of particles in alveolar macrophages, neutrophilic infiltration, and type-2 epithelial cell hyperplasia.33, 42 In our studies, we have found that 30-nm C dot silica nanoparticles administered by tail-vein injection (rather than inhalation) show no apparent toxicity in mice when compared with control populations, supporting the notion that colloidal (amorphous) silica is less toxic than crystalline silica. The discrepancy with the previous study by Kaewamatawong 41 is likely due to the different administration route of our particles. Thus, functional core-shell silica nanoparticles may represent a valuable materials platform for in-vivo studies of fundamental biology, as well as the development of clinical applications for the particles. We chose to employ multiphoton microscopy for much of the in-vivo imaging experiments because of its ability to image deeply in tissue and that it also allows for simultaneous collection of morphological information from intrinsic tissue emitters and collagen second harmonic.43 In addition, the localized excitation eliminates photobleaching outside of the focal plane compared to single-photon wide-field or confocal microscopy.43 This allowed us to determine the location and trafficking of the particles within the circulatory system as well as within the tissue of the mouse with high signal-to-noise, and may be useful in the future for imaging of, e.g., tumor vasculature or ischemia. One area where the development of nanoscale tools is of particular interest is cancer research and diagnosis.11 The convergence of sensitive and stable imaging agents8 with advancements in multiphoton43 and whole-body imaging can facilitate studies of both fundamental cancer biology as well as potentially advancing clinical techniques. For example, early detection of cancer dramatically increases survival rates, and the use of targeted multifunctional nanoparticle assays with advanced imaging techniques may decrease the detection limit for tumor size to allow treatments to be targeted to tumors before they pose a major threat to the patient. As well, these particles may allow for greater sensitivity in clinical applications such as sentinel lymph node mapping, which has been proven to be an effective method for diagnosis of tumor metastasis and is currently the protocol of choice to determine the likely site of tumor progression.44 In this approach, a dye or other tracer is injected in the tumor locale, and visualized as it drains into the lymphatic basin. The sentinel lymph node is the node that collects this tracer and can then be removed for biopsy. Further analysis of the node reveals whether or not any metastatic cells have also drained into the node, and provides oncologists with an effective means to monitor the spread of the cancer through the body. Our study demonstrates that the bright and stable fluorescence of the 30-nm C dots make them excellent imaging agents for the identification of sentinel lymph nodes. Nanoparticle-based probes also facilitate studying fundamental cancer biology. For example, fluorescence imaging provides an excellent tool for following the fate of metastatic cells as they leave the tumor milieu.16 By surface-functionalizing the C dots with cell-penetrating peptides,36, 37 we were able to internally label the cells through particle uptake and track the metastatic prostate carcinoma cells through the body. This method may be employed in the future to study the trafficking of different cancer cells and to determine their response to therapeutic interventions. One of the rapidly developing areas of metastasis research is understanding of interactions between metastatic and bone marrow cells.45, 46 To test for such interactions, we developed a multicolor labeling experiment using different colored TAT-conjugated C dots to label prostate cancer cells and bone marrow cells in vivo. We then injected both particles and were able to detect their localization by multiphoton microscopy. According to this assay, metastatic and bone marrow cells were frequently localized in immediate proximity to each other. Further experiments will determine whether observed colocalization of metastatic and bone marrow cells reflects biologic processes and is related to metastasis. This work demonstrates the versatility of TAT-C dots as tools for the labeling of various cell types, and their potential suitability to study interactions between metastatic and bone marrow cells. In this work, we have demonstrated the safety, efficacy, and utility of fluorescent core-shell silica nanoparticles (C dots) for biomedical applications from research to clinically relevant tools for oncology and beyond. These experiments point to the use of these particles as an appealing alternative to QDs for a variety of in-vivo applications, including immunolabeling, targeted imaging, and cell tracking. Moreover, recent work has shown that the C dot architecture can be built on further to develop core-shell particles incorporating multiple dye species. One application of these particles is the creation of quantitative ratiometric sensors for analytes such as pH,47 which could be of interest for probing the growth of tumors in vivo. In the future, the modular nature of the core-shell architecture may allow creation of multifunctional silica particles, a concept referred to as “lab on a particle,”8 incorporating, e.g., imaging, drug delivery, targeting, and sensing capabilities into a single probe. In turn, this may lead to the production of highly integrated and functional nanoparticle platforms for molecular medicine. AcknowledgmentsWe would like to thank David M. Roy for help with F4/80 immunostaining. The authors would also like to thank the Cornell Center for Materials Research and the Cornell Nanobiotechnology Center for facilities usage. This work was supported by NIH grants CA96823, CA112354, CA083638, and RR17595 to Nikitin, CA116583 and P41-RR04224 to Williams and Zipfel, and by NSF-STC grant ECS-9876771 to Wiesner. ReferencesA. P. Alivisatos,
W. Gu, and
C. Larabell,
“Quantum dots as cellular probes,”
Annu. Rev. Biomed. Eng., 7 55
–76
(2005). https://doi.org/10.1146/annurev.bioeng.7.060804.100432 1523-9829 Google Scholar
I. L. Medintz,
H. T. Uyeda,
E. R. Goldman, and
H. Mattoussi,
“Quantum dot bioconjugates for imaging, labelling and sensing,”
Nat. Mater., 4
(6), 435
–446
(2005). https://doi.org/10.1038/nmat1390 1476-1122 Google Scholar
X. Michalet,
F. F. Pinaud,
L. A. Bentolila,
J. M. Tsay,
S. Doose,
J. J. Li,
G. Sundaresan,
A. M. Wu,
S. S. Gambhir, and
S. Weiss,
“Quantum dots for live cells, in vivo imaging, and diagnostics,”
Science, 307
(5709), 538
–544
(2005). https://doi.org/10.1126/science.1104274 0036-8075 Google Scholar
S. Kim,
Y. T. Lim,
E. G. Soltesz,
A. M. De Grand,
J. Lee,
A. Nakayama,
J. A. Parker,
T. Mihaljevic,
R. G. Laurence,
D. M. Dor,
L. H. Cohn,
M. G. Bawendi, and
J. V. Frangioni,
“Near-infrared fluorescent type II quantum dots for sentinel lymph node mapping,”
Nat. Biotechnol., 22
(1), 93
–97
(2004). https://doi.org/10.1038/nbt920 1087-0156 Google Scholar
M. Stroh,
J. P. Zimmer,
D. G. Duda,
T. S. Levchenko,
K. S. Cohen,
E. B. Brown,
D. T. Scadden,
V. P. Torchilin,
M. G. Bawendi,
D. Fukumura, and
R. K. Jain,
“Quantum dots spectrally distinguish multiple species within the tumor milieu in vivo,”
Nat. Med., 11
(6), 678
–682
(2005). 1078-8956 Google Scholar
D. R. Larson,
W. R. Zipfel,
R. M. Williams,
S. W. Clark,
M. P. Bruchez,
F. W. Wise, and
W. W. Webb,
“Water-soluble quantum dots for multiphoton fluorescence imaging in vivo,”
Science, 300
(5624), 1434
–1436
(2003). https://doi.org/10.1126/science.1083780 0036-8075 Google Scholar
L. R. Hirsch,
R. J. Stafford,
J. A. Bankson,
S. R. Sershen,
B. Rivera,
R. E. Price,
J. D. Hazle,
N. J. Halas, and
J. L. West,
“Nanoshell-mediated near-infrared thermal therapy of tumors under magnetic resonance guidance,”
Proc. Natl. Acad. Sci. U.S.A., 100
(23), 13549
–13554
(2003). https://doi.org/10.1073/pnas.2232479100 0027-8424 Google Scholar
A. Burns,
H. Ow, and
U. Wiesner,
“Fluorescent core-shell silica nanoparticles: towards “Lab on a Particle” architectures for nanobiotechnology,”
Chem. Soc. Rev., 35
(11), 1028
–1042
(2006). https://doi.org/10.1039/b600562b 0306-0012 Google Scholar
V. Wagner,
A. Dullaart,
A. K. Bock, and
A. Zweck,
“The emerging nanomedicine landscape,”
Nat. Biotechnol., 24
(10), 1211
–1217
(2006). https://doi.org/10.1038/nbt1006-1211 1087-0156 Google Scholar
M. Ferrari,
“Cancer nanotechnology: opportunities and challenges,”
Nat. Rev. Cancer, 5
(3), 161
–171
(2005). https://doi.org/10.1038/nrc1566 1474-175X Google Scholar
S. Santra,
D. Dutta,
G. Walter, and
B. Moudgil,
“Fluorescent nanoparticle probes for cancer imaging,”
Technol. Cancer Res. Treat., 4
(6), 593
–602
(2005). 1533-0346 Google Scholar
X. Gao,
L. Yang,
J. A. Petros,
F. F. Marshall,
J. W. Simons, and
S. Nie,
“In vivo molecular and cellular imaging with quantum dots,”
Curr. Opin. Biotechnol., 16
(1), 63
–72
(2005). https://doi.org/10.1016/j.copbio.2004.11.003 0958-1669 Google Scholar
N. G. Portney and
M. Ozkan,
“Nano-oncology: drug delivery, imaging, and sensing,”
Anal. Bioanal. Chem., 384
(3), 620
–630
(2006). https://doi.org/10.1007/s00216-005-0247-7 1618-2642 Google Scholar
M. E. Akerman,
W. C. Chan,
P. Laakkonen,
S. N. Bhatia, and
E. Ruoslahti,
“Nanocrystal targeting in vivo,”
Proc. Natl. Acad. Sci. U.S.A., 99
(20), 12617
–12621
(2002). https://doi.org/10.1073/pnas.152463399 0027-8424 Google Scholar
A. Albini,
“Tumor and endothelial cell invasion of basement membranes. The matrigel chemoinvasion assay as a tool for dissecting molecular mechanisms,”
Pathol. Oncol. Res., 4
(3), 230
–241
(1998). 1219-4956 Google Scholar
E. B. Voura,
J. K. Jaiswal,
H. Mattoussi, and
S. M. Simon,
“Tracking metastatic tumor cell extravasation with quantum dot nanocrystals and fluorescence emission-scanning microscopy,”
Nat. Med., 10
(9), 993
–998
(2004). 1078-8956 Google Scholar
B. Ballou,
B. C. Lagerholm,
L. A. Ernst,
M. P. Bruchez, and
A. S. Waggoner,
“Noninvasive imaging of quantum dots in mice,”
Bioconjugate Chem., 15
(1), 79
–86
(2004). https://doi.org/10.1021/bc034153y 1043-1802 Google Scholar
A. Shiohara,
A. Hoshino,
K. Hanaki,
K. Suzuki, and
K. Yamamoto,
“On the cyto-toxicity caused by quantum dots,”
Methods Achiev Exp. Pathol., 48
(9), 669
–675
(2004). 0076-681X Google Scholar
A. M. Derfus,
W. C. W. Chan, and
S. N. Bhatia,
“Probing the cytotoxicity of semiconductor quantum dots,”
Nano Lett., 4
(1), 11
–18
(2004). https://doi.org/10.1021/nl0347334 1530-6984 Google Scholar
C. Kirchner,
T. Liedl,
S. Kudera,
T. Pellegrino,
A. Munoz Javier,
H. E. Gaub,
S. Stolzle,
N. Fertig, and
W. J. Parak,
“Cytotoxicity of colloidal and nanoparticles,”
Nano Lett., 5
(2), 331
–338
(2005). https://doi.org/10.1021/nl047996m 1530-6984 Google Scholar
G. Oberdorster,
A. Maynard,
K. Donaldson,
V. Castranova,
J. Fitzpatrick,
K. Ausman,
J. Carter,
B. Karn,
W. Kreyling,
D. Lai,
S. Olin,
N. Monteiro-Riviere,
D. Warheit, and
H. Yang,
“Principles for characterizing the potential human health effects from exposure to nanomaterials: elements of a screening strategy,”
Part. Fibre Toxicol., 2 8
(2005). Google Scholar
Y. Nagasaki,
T. Ishii,
Y. Sunaga,
Y. Watanabe,
H. Otsuka, and
K. Kataoka,
“Novel molecular recognition via fluorescent resonance energy transfer using a biotin-PEG/polyamine stabilized quantum dot,”
Langmuir, 20 6396
–6400
(2004). https://doi.org/10.1021/la036034c 0743-7463 Google Scholar
R. G. Neuhauser,
K. T. Shimizu,
W. K. Woo,
S. A. Empedocles, and
M. G. Bawendi,
“Correlation between fluorescence intermittency and spectral diffusion in single semiconductor quantum dots,”
Phys. Rev. Lett., 85
(15), 3301
–3304
(2000). https://doi.org/10.1103/PhysRevLett.85.3301 0031-9007 Google Scholar
J. R. Lakowicz, Principles of Fluorescence Spectroscopy, Springer-Verlag, New York (2006). Google Scholar
F. Wang,
W. B. Tan,
Y. Zhang,
X. Fan, and
M. Wang,
“Luminescent nanomaterials for biological labelling,”
Nanotechnology, 17
(1), R1
–R13
(2006). https://doi.org/10.1088/0957-4484/17/1/R01 0957-4484 Google Scholar
H. Ow,
D. R. Larson,
M. Srivastava,
B. A. Baird,
W. W. Webb, and
U. Wiesner,
“Bright and stable core-shell fluorescent silica nanoparticles,”
Nano Lett., 5
(1), 113
–117
(2005). https://doi.org/10.1021/nl0482478 1530-6984 Google Scholar
C. J. Brinker and
G. W. Scherer,
(1990) Google Scholar
D. Larson,
H. Ow,
H. Vishwasrau,
A. Heikal,
U. Wiesner, and
W. Webb,
“Silica nanoparticle architecture determines radiative properties of encapsulated fluorophores,”
Chem. Mater., 0897-4756 Google Scholar
Animal Models in Toxicology, CRC Press, Boca Raton, FL (2007). Google Scholar
A. Flesken-Nikitin,
R. M. Williams,
W. R. Zipfel,
W. W. Webb, and
A. Y. Nikitin,
“Use of multiphoton imaging for studying cell migration in the mouse,”
Methods Mol. Biol., 294 335
–345
(2005). 1064-3745 Google Scholar
Z. Zhou,
A. Flesken-Nikitin,
D. C. Corney,
W. Wang,
D. W. Goodrich,
P. Roy-Burman, and
A. Y. Nikitin,
“Synergy of p53 and Rb deficiency in a conditional mouse model for metastatic prostate cancer,”
Cancer Res., 66
(16), 7889
–7898
(2006). https://doi.org/10.1158/0008-5472.CAN-06-0486 0008-5472 Google Scholar
P. Choyke and
H. Kobayashi,
“Functional magnetic resonance imaging of the kidney using macromolecular contrast agents,”
Abdom. Imaging, 31 224
–231
(2006). 0942-8925 Google Scholar
K. P. Lee and
D. P. Kelly,
“The pulmonary response and clearance of Ludox colloidal silica after a 4-week inhalation exposure in rats,”
Fundam. Appl. Toxicol., 19
(3), 399
–410
(1992). 0272-0590 Google Scholar
D. B. Warheit,
M. C. Carakostas,
J. R. Bamberger, and
M. A. Hartsky,
“Complement facilitates macrophage phagocytosis of inhaled iron particles but has little effect in mediating silica-induced lung inflammatory and clearance responses,”
Environ. Res., 56
(2), 186
–203
(1991). 0013-9351 Google Scholar
I. Y. Adamson,
H. Prieditis, and
D. H. Bowden,
“Enhanced clearance of silica from mouse lung after instillation of a leukocyte chemotactic factor,”
Exp. Lung Res., 20
(3), 223
–233
(1994). 0190-2148 Google Scholar
V. P. Torchilin,
R. Rammohan,
V. Weissig, and
T. S. Levchenko,
“TAT peptide on the surface of liposomes affords their efficient intracellular delivery even at low temperature and in the presence of metabolic inhibitors,”
Proc. Natl. Acad. Sci. U.S.A., 98
(15), 8786
–8791
(2001). https://doi.org/10.1073/pnas.151247498 0027-8424 Google Scholar
S. Santra,
H. Yang,
D. Dutta,
J. T. Stanley,
P. H. Holloway,
W. Tan,
B. M. Moudgil, and
R. A. Mericle,
“TAT conjugated, FITC doped silica nanoparticles for bioimaging applications,”
Chem. Commun. (Cambridge), 24 2810
–2811
(2004). https://doi.org/10.1039/b411916a 1359-7345 Google Scholar
A. Hoshino,
K. Fujioka,
O. T. M. Suga,
Y. F. Sasaki,
T. Ohta,
M. Yasuhara,
K. Suzuki, and
K. Yamamoto,
“Physicochemical properties and cellular toxicity of nanocrystal quantum dots depend on their surface modification,”
Nano Lett., 4
(11), 2163
–2169
(2004). https://doi.org/10.1021/nl048715d 1530-6984 Google Scholar
D. P. Kelley and
K. P. Lee,
“Pulmonary response to Ludox colloidal silica inhalation exposure in rats,”
Toxicologist, 10 202A
(1990). Google Scholar
D. B. Warheit,
T. A. McHugh, and
M. A. Hartsky,
“Differential pulmonary responses in rats inhaling crystalline, colloidal or amorphous silica dusts,”
Scand. J. Work Environ. Health, 21
(suppl 2), 19
–21
(1995). 0355-3140 Google Scholar
T. Kaewamatawong,
N. Kawamura,
M. Okajima,
M. Sawada,
T. Morita, and
A. Shimada,
“Acute pulmonary toxicity caused by exposure to colloidal silica: particle size dependent pathological changes in mice,”
Toxicol. Pathol., 33
(7), 743
–749
(2005). 0192-6233 Google Scholar
K. P. Lee and
D. P. Kelly,
“Translocation of particle-laden alveolar macrophages and intra-alveolar granuloma formation in rats exposed to Ludox colloidal amorphous silica by inhalation,”
Toxicology, 77
(3), 205
–222
(1993). https://doi.org/10.1016/0300-483X(93)90161-K 0300-483X Google Scholar
W. R. Zipfel,
R. M. Williams, and
W. W. Webb,
“Nonlinear magic; multiphoton microscopy in the biosciences,”
Nat. Biotechnol., 21
(11), 1369
–1377
(2003). https://doi.org/10.1038/nbt899 1087-0156 Google Scholar
J. W. Jakub,
S. Pendas, and
D. S. Reintgen,
“Current status of sentinel lymph node mapping and biopsy: facts and controversies,”
Oncologist, 8
(1), 59
–68
(2003). Google Scholar
R. N. Kaplan,
R. D. Riba,
S. Zacharoulis,
A. H. Bramley,
L. Vincent,
C. Costa,
D. D. MacDonald,
D. K. Jin,
K. Shido,
S. A. Kerns,
Z. Zhu,
D. Hicklin,
Y. Wu,
J. L. Port,
N. Altorki,
E. R. Port,
D. Ruggero,
S. V. Shmelkov,
K. K. Jensen,
S. Rafii, and
D. Lyden,
“VEGFR1-positive haematopoietic bone marrow progenitors initiate the pre-metastatic niche,”
Nature, 438
(7069), 820
–827
(2005). https://doi.org/10.1038/nature04186 0028-0836 Google Scholar
A. H. Shah,
W. B. Tabayoyong,
S. D. Kundu,
S. J. Kim,
L. Van Parijs,
V. C. Liu,
E. Kwon,
N. M. Greenberg, and
C. Lee,
“Suppression of tumor metastasis by blockade of transforming growth factor beta signaling in bone marrow cells through a retroviral-mediated gene therapy in mice,”
Cancer Res., 62
(24), 7135
–7138
(2002). 0008-5472 Google Scholar
A. Burns,
P. Sengupta,
T. Zedayko,
B. Baird, and
U. Wiesner,
“Core/shell fluorescent silica nanoparticles for chemical sensing: towards single-particle laboratories,”
Small, 2
(6), 723
–726
(2006). https://doi.org/10.1002/smll.200600017 1613-6810 Google Scholar
|


