

|
|
1.IntroductionHeart defects are a major cause of infant mortality and spontaneous abortions.1, 2 Since the basic process of heart development and the genetic network that regulates it has been found to be conserved throughout evolution,3, 4 research in lower vertebrates, including the Xenopus embryo, can help in understanding normal and abnormal heart development.5 The Xenopus laevis tadpole is an ideal animal model for demonstrating optical imaging methods, as it has relatively large and partially transparent embryos. The morphology of the developing Xenopus laevis heart was described based on studies in fixed embryos.6, 7 Similar to other vertebrates, Xenopus heart development starts at the gastrula stage. Later on, it takes the form of a linear tube that undergoes looping and compression. Differentiation gives rise to the truncus arteriosus (TA), bulbus cordis (BC), ventricle (V), atrium (A), and sinus venosus (SV). The final step of heart development is valve and septum formation (around stage 47). The fully differentiated Xenopus heart has three chambers: two atria divided by the partial atrial septum, and a single highly trabeculated ventricle. The atrioventricular valve is located between the ventricle and the atrium, and the spiral valve is located within the TA.6, 7 Elucidating the relationship between the molecular basis of congenital malformations and phenotype requires accurate 2- and 3-D characterization of microstructure of the embryonic heart. However, due to cardiac motion and its small dimensions, the heart is among the most difficult organs to evaluate in a living embryo. Optical techniques are capable of imaging the living embryonic heart at high resolution.8, 9 While presently the vast majority of optical imaging techniques utilize exogenous molecular labels, for some applications, optical imaging based on endogenous contrast may be advantageous. For instance, endogenous contrast mechanisms, such as tissue scattering and autofluorescence, allow investigation of the specimen in its native state, at multiple time points,10 and with minimal preparation. Endogenous contrast microscopy can furthermore be used in tandem with fluorescence imaging, providing an important structural context that is complementary to molecular labeling. Here, we describe several endogenous-contrast imaging modalities for visualizing both normal and abnormal Xenopus laevis tadpole heart microstructures: full-field optical coherence microscopy (FFOCM),11, 12, 13 which utilizes low-coherence interferometry and high numerical aperture objective lenses to attain resolution at the subcellular level in all three dimensions (3-D); spectrally encoded confocal microscopy (SECM),14, 15 a form of reflectance confocal microscopy that can obtain 2-D images with micron-level resolution; and optical frequency-domain imaging [OFDI, also referred as swept-source optical coherence tomography (OCT)],16, 17 a recently developed derivative of OCT that acquires images at significantly higher frame rates.18 The high speed of OFDI opens up the possibility of conducting real-time 4-D microscopy19, 20 (3-D microscopy as a function of time). The purpose of this study is to demonstrate these endogenous contrast microscopy technologies and elucidate the potential merits of high-speed and high-resolution imaging for the normal and abnormal embryonic heart. 2.Materials and Methods2.1.Bench-Top Optical Coherence Tomography and Optical Frequeny-Domain Imaging SystemsIn time-domain OCT (TDOCT), axial ranging is performed by use of low-coherence reflectometry where the individual depth points are probed sequentially in time. A broad bandwidth [ , full width at half maximum (FWHM)] source centered at was used, providing an axial resolution of in tissue. The frame rate was ( A-line rate, ). OFDI originates from a telecommunications ranging method termed optical frequency-domain reflectometry. The primary differences between OCT and OFDI are found in the system optics. With OFDI, the interferometer reference arm remains stationary and spectral interference is detected using a narrowband wavelength-tuning source. OFDI images, reconstructed by taking the Fourier transform of the spectral fringe pattern, are essentially identical to those obtained by OCT. OFDI provides a several-hundred-fold improvement in signal-to-noise ratio (SNR),16, 17 compared to OCT, which can be utilized to increase imaging speed to nearly . The wavelength tunable laser light source of our OFDI system was an extended cavity semiconductor laser employing an intracavity spectral filter.14, 17 The laser featured a sweep repetition rate of up to , a wide tuning range of centered at , and a high average output power of ( on the tissue). The axial resolution was in tissue. The frame rate was , resulting in a volumetric acquisition rate of ( per volume). The system further comprised an acousto-optic frequency shifter to remove the depth degeneracy inherent in frequency-domain reflectometry.21 Polarization-diversity detection was implemented to eliminate polarization artifacts in the fiber-based OFDI system. Dual-balanced photoreceivers were used to improve imaging sensitivity through the reduction of laser intensity noise. The photoreceiver outputs were digitized with a two-channel analog-to-digital converter at a sampling rate of with resolution. TDOCT and high-speed OFDI were incorporated into a dissecting light microscope. The scanning system was comprised of a collimating lens ( beam diameter), two synchronized galvanometric scanners for transverse scanning, a focusing lens ( focal length), and a small mirror that deflected the beam downward toward the sample. The transverse resolution was with a confocal parameter of . Displacements associated with local cardiac motion (Figs. 5a, 5b, 5c, 5d) were estimated from the OFDI data by subtracting the heart surface locations at end diastole from those at end systole on a frame-by-frame basis. First, the heart was semiautomatically segmented using IPLab Spectrum (BD Biosciences, Franklin Lakes, New Jersey) in end diastole and end systole. Morphologic edge detection was then conducted on the segmented areas to determine the heart surfaces for end diastole and end systole. End diastole and end systole segmented areas were subtracted on a frame-by-frame basis. The subtracted image maintained its sign so that positive and negative displacements could be computed. For every point on the edge images, the thickness of the subtracted volumes was determined by summing the subtracted data within a local kernel centered at each edge point. The displacement value estimate for each surface position was then scaled according to the pixel dimensions and assigned a unique color that served as a color overlay on the 3-D volume rendering. Volumetric rendering and 3-D visualization was accomplished by using OsiriX software.22 High-resolution OFDI was performed using a novel laser source with tuning range, centered at , in which two semiconductor optical amplifiers were utilized as the gain media.23 An axial resolution of in tissue was measured. The transverse resolution was with objective lens. The imaging rate was with an A-line rate of (500 A-lines per frame, per A-line). Polarization-diversity and dual-balanced detection were performed and the photoreceiver outputs were digitized with a two-channel analog-to-digital converter at a sampling rate of with resolution. 2.2.Full-Field Optical Coherence Microscopy SystemFFOCM is an interferometric technique that utilizes 2-D parallel detection to provide subcellular resolution images of reflected light within biological specimens.12, 24 The FFOCM system used spatially incoherent broadband light from a xenon arc lamp to illuminate the sample and the reference mirror of a Linnik interference microscope using two identical water-immersion microscope objective lenses. Interference images were captured with a complementary metal oxide semiconductor (CMOS) area scan camera with a spectral response centered at . The transverse resolutions were and the axial resolution was . Maximum penetration depth was typically . Acquisition time was per frame for a transverse field of view of approximately ( per frame, 800 frames per volume). Three-dimensional data was obtained by moving the sample through the focus at increments. Volumetric rendering and visualization was accomplished by using OsiriX software. 2.3.Spectrally Encoded Confocal Microscopy SystemSECM is a reflectance confocal microscopy technique that uses near-infrared light, allowing deeper penetration into tissue,25 compared with confocal microscopes that utilize visible light. SECM differs from conventional laser scanning confocal microscopy in that it projects different wavelengths onto distinct locations on the sample.15 Rapid acquisition of spectra returned from the sample enables high-speed reconstruction of the image. In the SECM system,14 light from a rapid wavelength tuning source in the near-infrared (center , instantaneous line , total , repetition rate up to ) was collimated onto a diffraction grating (1100 lines per mm) and focused through a 1.2 NA, objective (Olympus UPlanApo/IR ). A multimode fiber was used for signal collection, resulting in transverse and axial resolutions. Images comprised of were acquired at . The maximum imaging depth was limited to the working distance of the objective lens. 2.4.Resolution MeasurementsFor all imaging modalities (TDOCT, OFDI, SECM, and FFOCM), transverse resolution was measured by imaging a resolution target and calculating the full width at half maximum (FWHM) of the derivative of the edge response. Axial resolution was measured by scanning a mirror along the optical axis and determining the FWHM. 2.5.Specimen Preparation, Ethanol Treatment, and HistologyXenopus laevis frogs were purchased from Nasco (Fort Atkinson, Wisconsin). Animal procedures were performed according to the approved protocols of Massachusetts General Hospital Subcommittee on Research Animal Care. Embryos were obtained by in vitro fertilization, incubated in Marc’s modified Ringer’s medium (MMR),26 and staged according to Nieuwkoop and Faber tables.27 Ethanol treatments were performed in MMR (vol/vol), from the mid-blastula transition (MBT, stage 8.5),28 until the time of imaging, typically after at room temperature. All embryos were imaged repeatedly during their development. Aligning the embryos was performed by observing them through the dissecting microscope and TDOCT cross sectional imaging of the heart area. Prior to in vivo imaging, to prevent the embryos from swimming, they were anesthetized using 0.02% 3-aminobenzoic acid ethyl ester (A-5040, Sigma). For TDOCT and OFDI imaging, embryos were positioned on a 1.5% agarose gel plate with their ventral side facing up, covered by the anesthesia working solution. For imaging with the SECM system, embryos were placed on a cover slip, lying on their ventral side in an anesthesia buffer, and imaged from below. FFOCM was conducted on fixed embryos. Fixation was done in MEMFA [ MOPS (pH7.4), EGTA, , and 3.7% formaldehyde] for more than one hour. Prior to imaging, the fixed embryos were transferred into a Petri dish with phosphate buffered saline (PBS) (8-gr NaCl, 0.2-gr KCl, 1.44-gr , and 0.24-gr ), with their ventral side facing up, supported by clay. Developmental stages and phenotypes were determined by R. Yelin. Plastic histology sections29 were obtained after additional fixation in Karnovsky’s Fixative (KII) and embedding in tEpon-812 (Tousimis). Sections thick were cut on a Reichert Ultracut Microtome and stained with methylene blue/toluidine blue in borate buffer (Tousimis). Paraffin sections ( thick) were stained with hematoxylin and eosin. 3.Results3.1.High-Resolution Three-Dimensional Imaging by Full-Field Optical Coherence Microscopy in Fixed EmbryosFFOCM offers the capability to image the microstructure of the embryonic heart with nearly isotropic cellular level resolution in a fixed embryo. Volumetric FFOCM images spanned a transverse field of view of and in depth. The transverse and axial resolutions were 2 and , respectively. Acquisition time was for a single en face section, and for the entire volume. FFOCM sections of the heart in a fixed Xenopus tadpole (stage 49) allow visualization of the ventricular trabeculae [Figs. 1a and 1c ], the spiral valve [Figs. 1b and 1d, arrows], and the partial atrial septum [Fig. 1d, arrow head]. Partially transparent volumetric rendering of the heart [Figs. 1e, 1f, 1g, 1h] reveals the looping-compression structure with the angled TA [Fig. 1e], the aortic arches [Figs. 1f and 1g], and the thin wall of the atrium [Figs. 1g and 1h], in their 3D context. Cutaway views of Fig. 1e show fine 3-D internal structures, including the trabeculae [Figs. 1i and 1j] and the atrioventricular valve [Fig. 1k]. A magnified view of the atrioventricular valve, shown [Fig. 1l] next to a corresponding histology section of the same embryo [Fig. 1m], demonstrates its bicuspid morphology. Fig. 13-D imaging of Xenopus heart (stage 49) using FFOCM in a fixed embryo. En face sections show trabeculae (a) within the ventricle and (b) the spiral valve (valve marked by arrow). Cross sections at different locations along the anterior-posterior axis show (c) the ventricular trabeculae and cavity, (d) the TA and spiral valve (marked by arrow), the thin atrium wall, and the partial atrial septum (arrowhead). Partially transparent volumetric rendering of the heart (e) through (h) is shown at different viewing angles, revealing (e) the characteristic looping-compression structure and the angled TA, (f) the TA splitting into the paired aortic arches, the carotid arches (ca), systemic arches (sa), the pulmocutaneous arches (pa), and (g) and (h) the thin walled atrium. (i), (j), and (k) Cut away views through the 3-D dataset. The atrioventricular valve is shown in a magnified view [(l), marked by star] next to the corresponding histological section [(m); resin-embedded, sections, methylene blue stain]. v, ventricle; t, truncus arteriosus; a, atrium. Scale bars correspond to .  3.2.Heart Abnormalities Due to Ethanol ExposureCardiovascular malformation can be caused by genetic30 and teratogenic factors.31 Ethanol is a well-known teratogen; exposure of human embryo during pregnancy to alcohol (ethanol) is associated with fetal alcohol syndrome (FAS).32, 33 One estimate suggests that 54% of the children with FAS have heart defects.34 To study the teratogenic effect of ethanol on Xenopus heart development, embryos were exposed to different concentrations of ethanol (0.5 to 2.5% vol/vol) from the mid-blastula transition (stage 8.5)28 until they were imaged. Siblings developing under the same conditions, but not exposed to ethanol, were used as controls. During the developmental process, we screened the heart area of 121 live embryos in an attempt to identify and qualitatively evaluate the extent of the teratogenic effect. To image the large number of embryos repeatedly and reliably, we used a dedicated TDOCT system that was incorporated into a dissecting microscope, which allowed simultaneous imaging with the two systems, with easy access for embryo manipulation (accurate orientation alignment). What appears as a complete maturation with a substantial change in morphology compared to the controls was found in a minority (25%) of embryos that were exposed to 1% ethanol , and in a majority (74%) of embryos that were exposed to 1.5% ethanol ( , as in 1Video 1 ). Grossly abnormal rotation of the heart tube and/or incomplete maturation was found in all embryos in the 2.0 and 2.5% groups ( and , respectively, as in 2Video 2 ). We did not observe morphologic differences between the 0.5% ethanol treated group ( , as in 3Video 3 ) and the control group ( , as in 4Video 4 ). Video 1TDOCT movie of a Xenopus heart area from the group treated with 1.5% ethanol, acquired in vivo. Imaging rate was (QuickTime; ). 1.  Video 2TDOCT movie of a Xenopus heart area from the group treated with 2.0% ethanol, obtained in vivo. Imaging rate was (QuickTime; ). 2.  Video 3TDOCT movie of a Xenopus heart area from the group treated with 0.5% ethanol, obtained in vivo. Imaging rate was (QuickTime; ). 3.  Video 4TDOCT movie of a Xenopus (stage 48) heart area from the control group, obtained in vivo. Imaging rate was (QuickTime; ). 4.  Video 5SECM movie of the spiral valve in a stage 47 Xenopus heart, obtained in vivo. Imaging rate was (QuickTime; ). 5.  Video 6SECM movie of the aneurismal dilatation on the TA wall of a stage 47 tadpole, acquired in vivo. Imaging rate was (QuickTime; ). 6.  Video 8Cross sectional imaging of stage 49 Xenopus heart acquired in vivo using high-resolution OFDI. Imaging rate was (QuickTime; ). 8.  Cardiac motion was evident in all embryos, even those with the most severe malformations. Using TDOCT, we selected one tadpole (stage 48) from each of the control, 0.5, 1.5, and 2.0% ethanol treated groups to demonstrate typical phenotypes (1Videos 1 through 44). We determined that the four tadpoles’ hearts were in advanced developmental stages by identifying the existence of a partial atrial septum and an atrioventricular valve (histology data not shown). The TDOCT images provided the first indication of damaged looping in the 1.5 and 2.0% groups (1Videos 1 and 22). We furthermore observed lower TDOCT signal from within the ventricle in those groups. Photographs of the tadpoles, taken in vivo from the ventral aspect, are shown in Figs. 2a, 2b, 2c, 2d . The four embryos were then fixed and imaged with FFOCM to evaluate fine structural malformations. 3-D rendering of FFOCM data allowed evaluation of myocardial structure at high resolution, revealing the similarity between the control and the 0.5% tadpoles, and clearly showing defective heart tube looping in tadpoles from the 1.5 and 2.0% groups [Figs. 2e, 2f, 2g, 2h]. Based on sections from the FFOCM datasets, we measured the TA dimensions in each of the four representative embryos and found a decrease in maximum diameter of approximately in the 1.5% embryo and in the 2% embryo, when compared to the control and 0.5% groups. The smaller distorted TAs and spiral valves (marked by arrows) are shown in the 1.5% [Fig. 2k] and 2.0% embryos [Fig. 2l] compared with the control [Fig. 2i] and the 0.5% [Fig. 2j] embryos. Fig. 2Abnormal heart formation due to ethanol exposure. (a) through (d) Ventral-view photographs of the tadpoles, obtained in vivo. (e) through (h) 3-D renderings of the heart area using FFOCM in fixed embryos. (i) through (l) En face FFOCM sections through the volumetric datasets at the level of the spiral valve (marked by arrows). (m) through (p) Cross sections through the ventricle. (q) through (t) Corresponding histological sections (paraffin, H and E). v, ventricle; t, truncus arteriosus; a, atrium; tr, trabeculae; frame width in (a) through (d) is . Scale bars correspond to .  Pericardial edema was present in the 1.5 and 2.0% groups [Figs. 2k, 2l, 2o, 2p] compared with the control and 0.5% groups. Ethanol also affected the ventricle. The developed trabeculae in the control [Fig. 2m] and 0.5% [Fig. 2n] hearts contrast the less developed trabeculae in the 1.5% group [Fig. 2o] and the large ventricular cavity with sparse, stunted trabeculae in embryos exposed to 2.0% ethanol [Fig. 2p]. Corresponding histological sections confirmed some of our findings, including the less developed trabeculae [Figs. 2q, 2r, 2s, 2t] in embryos with the greater ethanol exposure. 3.3.High-Resolution Imaging of the Embryonic Heart with Spectrally Encoded Confocal Microscopy In VivoTo obtain high-resolution images within the Xenopus heart in vivo, we have used SECM that allows the imaging of both structure and dynamics with microscopic resolution. SECM provides a transverse resolution comparable to FFOCM, but at much higher frame rates, enabling microscopy of the heart in vivo. The Xenopus myocardium (stage 49) was imaged with SECM in vivo at a frame rate of , a transverse field of view of , and transverse and axial resolutions of 0.9 and , respectively. The maximum penetration depth was . SECM images show the thin cusps of the atrioventricular valve [Fig. 3a ], approximately below the ventral surface, and parts of the ventricle and TA [Fig. 3c], containing individual blood cells within the trabecular spaces. SECM images correlated well with corresponding histology sections [Figs. 3b and 3d]. A series of frames from a different tadpole (stage 47) demonstrates the spiral valve as it closes [Fig. 3e] and opens [Figs. 3f and 3g], regulating blood flow, seen at the single-cell level, from the TA to the aortic bifurcation (5Video 5 ). Blood cells are also apparent between the trabeculae [Fig. 3h], and smaller, bright features that may represent nuclei and organelles can be observed. Fig. 3High-resolution confocal imaging in vivo using SECM. En face SECM images showing the atrioventricular valve [(a), marked by star], the ventricular trabeculae, and the TA (c) are compared with plastic histological sections [(b) and (d); resin-embedded, sections, methylene blue stain]. The regions of interest in (b) and (d), marked by the dotted rectangles, correspond to the approximate fields of view of the SECM images in (a) and (c), respectively. (e), (f), and (g) A series of three SECM images demonstrate the opening of the spiral valve, allowing the flow of blood cells to the aortic bifurcation. Arrows mark the flow direction. (h) Trabecular microstructure within the ventricle. Stars mark valve locations. v, ventricle; t, truncus arteriosus; s, spiral valve; b, blood cells. Scale bars correspond to .  3.4.Aneurismal Dilatation in the Xenopus EmbryoIn one of the embryos (stage 47), we noticed a protrusion emanating from the TA wall. SECM sections obtained in vivo at two different depths [Figs. 4a and 4b ], taken from 6Video 6 reveal its saccular shape, its location with respect to the spiral valve, as well the flow of individual blood cells through the defect. This abnormality was also observed in vivo with TDOCT [Fig. 4a, inset]. The embryo was then fixed and imaged with FFOCM. An FFOCM section [Fig. 4c] and a 3-D volumetric rendering of the dataset [Fig. 4d] shows the dilatation in the context of the entire heart. Difficult to see under conventional brightfield microscopy [Fig. 4e], but clearly visualized with TDOCT, FFOCM, and SECM, this protrusion may represent a saccular aneurismal dilatation of the TA in a heart that otherwise appeared to have a normal phenotype. Fig. 4Aneurismal dilatation in the Xenopus heart (stage 47). (a) SECM image, obtained in vivo, shows the presence of blood cells within the protrusion. (b) A deeper SECM section reveals the location of the protrusion relative to the spiral valve. TDOCT was used to confirm the abnormality in vivo [(a), inset, arrow]. (c) FFOCM en face section, obtained in fixed embryo, and (d) 3-D rendering of the FFOCM data, show additional views of the aneurysm. (e) Brightfield photo showing ventral view of the tadpole (frame ). The aneurismal defect is marked by arrows. v, ventricle; t, truncus arteriosus; a, atrium; s, spiral valve. Scale bars correspond to .  3.5.Optical Frequency Domain Imaging Allows Real-Time Four-Dimensional Imaging of the Xenopus Tadpole HeartDirect imaging of heart dynamics in the whole mount embryo, in situ, including valve activity and myocardial motion, can help to elucidate heart function and the etiology of failure. While FFOCM and SECM are too slow, in their current implementation, to acquire the 3-D volume of the heart in real time, OFDI allows 4-D imaging without using gating or synchronization techniques.19, 20 OFDI images of the Xenopus heart (stage 49) were acquired in vivo at a rate of (fps), while the OFDI image plane was scanned through the heart at a rate of . Volumetric OFDI images were therefore obtained at a rate of 20 3-D datasets per second [Figs. 5a, 5b, 5c, 5d ]. The heart beat rate was measured to be approximately , resulting in ten volumetric datasets captured during a single cardiac cycle. A 4-D rendering of the myocardial dynamics is shown in 7Video 7 . At end systole, OFDI demonstrated that the ventricle was at its smallest volume; the volumes of the atrium and truncus arteriosus (TA) were conversely at their maxima [Figs. 5a and 5c]. At end diastole, the ventricle was dilated to its greatest volume, whereas the volumes of the atrium and TA were at their minima [Figs. 5b and 5d]. 3.6.High-Resolution Optical Frequency Domain Imaging of the Embryonic Heart In VivoTo increase OFDI resolution, a novel broadband wavelength-swept source23 was used to obtain cross sections of a stage 49 Xenopus heart, in vivo. Compared to the transverse and axial resolutions of the previously described OFDI, the transverse and axial resolutions of high-resolution OFDI were 2 and , respectively. Imaging speed was . Details within the three-chamber Xenopus heart can be clearly resolved in the high-resolution OFDI movie (8Video 8 ), including atrioventricular valve dynamics [Figs. 5e, 5f, 5g]. Individual blood cells can also be seen flowing from the atrium to the ventricle through the atrioventricular valve [Fig. 5g]. The ventricular trabeculae [Fig. 5h] and the spiral valve [Fig. 5j] structure and dynamics are clearly resolved with the high-resolution OFDI. For comparison, we present FFOCM sections [Figs. 5i and 5k] of corresponding areas from embryos at similar developmental stages. Fig. 5Imaging of Xenopus laevis hearts (stage 49) in vivo using OFDI. (a) to (d) High-speed OFDI 4-D imaging is presented through displacement color maps, revealing myocardial motion within a single cardiac cycle. The imaging rate allows in vivo real-time 3-D imaging at a rate of (vps). (e), (f), and (g) High-resolution OFDI shows a series of frames of the atrioventricular valve (e) as it closes and [(g), valve marked by arrows] opens. Different anatomic structures within the heart can be clearly resolved, including (h) the ventricle with the trabeculae and [(j), spiral valve marked by arrow] the spiral valve within the TA. FFOCM images of the areas of the ventricle and the spiral valve are shown in (i) and [(k), spiral valve marked by arrow], respectively. v, ventricle; t, truncus arteriosus; a, atrium. Scale bars correspond to . 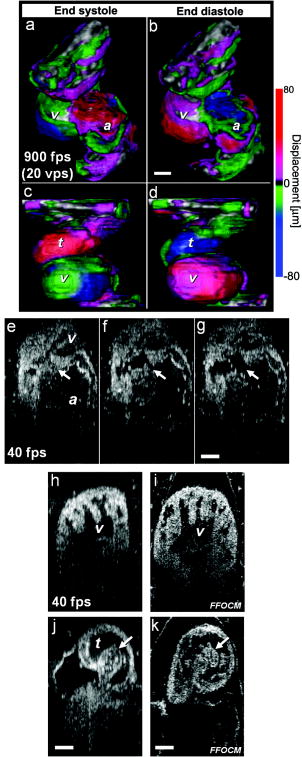 4.DiscussionA common paradigm in developmental biology research is to manipulate the genotype and monitor the phenotype. Morphology is an important aspect of the phenotype. In the heart, even slight morphological and dynamical abnormalities may be critical for proper myocardial function. An ability to identify subtle morphological and dynamical variations in two and three dimensions can significantly improve the sensitivity of this paradigm. In the Xenopus laevis tadpole, heart structures such as the myocardial wall, septum, and valves may only be a few cells thick. Evaluating the morphological phenotype not only requires resolving such fine structures, but also the capability to visualize these microscopic features within the beating heart, where typical displacement velocities are on the order of (estimated based on the data from the high-speed OFDI, and assuming a beat rate of approximately ). For cross sectional imaging, TDOCT at is sufficiently fast to avoid motion artifacts in a 2-D image. With the several-fold increase in imaging speed enabled by OFDI, 3-D images of the embryo heart can be obtained at different times within the cardiac cycle.19, 20 High resolution and high speed are not the only requirements for effective imaging of the heart. In the Xenopus embryo, the heart extends from between 200 and beneath the ventral surface. An effective imaging method should therefore also be capable of imaging at these depths without substantial loss of signal and resolution. Structural imaging of the heart in vivo has been demonstrated using a variety of noninvasive imaging modalities such as micro-MRI in adult pigs35 and adult mice,36 micro-CT in adult pigs37 and adult mice,38 ultrasound in mouse embryos,39 and positron emission tomography (PET) in adult dogs40 and adult mice.41 Optical techniques enable imaging of the embryonic heart at higher resolution. The morphology of the developing Xenopus laevis heart has been studied in fixed embryos, using 3-D rendering of histology sections6 and confocal microscopy.7 Confocal microscopy has been also used for in vivo heart imaging, including studying the role of intracardiac fluid forces42 and heart dynamics at very early developmental stages8 in zebrafish. Time-lapse study, which does not require optical sectioning, was conducted using high-speed video cameras, in chick embryos.10 TDOCT was first applied to small animal heart imaging by Boppart 43, 44 Doppler TDOCT allows quantitative velocity measurements under the tissue surface, and was used to demonstrate blood flow in the Xenopus tadpole.45, 46 Due to its limited speed, 3-D heart imaging using TDOCT has primarily been demonstrated in fixed embryos of Xenopus,43 mouse,9 and chick.47 The gating technique has been employed to circumvent imaging speed limitations, enabling the reconstruction of 3-D OCT heart images, at different stages in the cardiac cycle, of mouse and chick embryos.48 Post-acquisition synchronization techniques were used for 3-D in vivo confocal microscopy in zebrafish embryos.49 FFOCM was found to be capable of providing high quality 3-D imaging with cellular resolution. Compared to confocal microscopy, FFOCM has axial resolution that is independent of the objective lens numerical aperture, opening up the possibility of obtaining images with isotropic subcellular resolution. SECM was demonstrated with comparable transverse and axial resolution to those of FFOCM, but was capable of imaging at much higher speeds, enabling visualization of myocyte, blood, and valve motion in vivo. Owing to its high imaging speed, OFDI provided real-time 4-D imaging of a beating heart without requiring cardiac gating or synchronization.19, 20 We showed that OFDI might be useful for assessing myocardial wall displacement during the cardiac cycle [Figs. 5a, 5b, 5c, 5d]. The use of anesthesia for immobilizing the embryos during imaging also resulted with reduction in heart beat rate, from approximately , which helped to increase the number of volumetric samples acquired during a single cardiac cycle. While this demonstration is limited in scope, mainly due to the relatively low number of pixels in the dataset, and the anesthesia that was applied to the embryos, it still shows the potential of OFDI for 4-D imaging of the Xenopus heart. Future technical developments on faster light sources (see, for example, Jenkins 20) and more advanced image processing algorithms could extend this technology to allow reliable measurements of dynamic physiological parameters, such as stroke volume and ejection fraction, as well as valve opposition, stiffness, and nodularity, which all have close analogs in human pathophysiology. By modifying the OFDI light source, we were also able to conduct real-time cross sectional imaging with higher axial resolution while maintaining high frame rates , enabling unprecedented cross sectional visualization of valve dynamics [Figs. 5e, 5f, 5g] and single cell blood flow. Compared to FFOCM, the axial resolution of OFDI is limited due to the bandwidth of wavelength-tuning sources and its longer central wavelength , which affects both transverse and axial resolution. The focal volume of FFOCM in this work was approximately four times smaller than that of OFDI, allowing higher resolution for visualizing the detailed microstructure of the developing heart. Table 1 summarizes the different capabilities of each technique, highlighting their complementary nature. Table 1Comparison of endogenous-contrast modalities for optical imaging of the embryonic heart. Bold text denotes the best imaging characteristics.
To demonstrate the potential of some of these techniques for evaluating teratogenic effects, we imaged Xenopus embryos following the administration of different concentrations of ethanol. Different animal models are being used to study FAS, despite obvious differences in general structure and in the ethanol teratogenic concentrations.50 The teratogenic effect of ethanol on Xenopus laevis was previously studied on the morphological and molecular levels,28, 51, 52 but to our knowledge, the teratogenic effect of ethanol on Xenopus heart development has not been investigated. The ethanol concentrations that we used to obtain an observable effect on heart development were 1.5 to 2.5% (vol./vol.). These values are equivalent to , which are about 6- to 10-fold higher than high intoxication levels in the human blood system (about ). While this value may represent the levels of alcohol in the mother’s blood system, no information is available regarding the ethanol concentration within the human fetus that causes FAS. Also, no information exists regarding the actual ethanol levels in the tadpole itself. The alcohol concentrations in this work are similar to the concentrations that were used in the zebrafish study conducted by Bilotta 53 The pericardial edema that developed as part of the ethanol teratogenic phenotype prevented the use of standard light microscopy to study variations in heart morphology. The large penetration depth of TDOCT, OFDI, and FFOCM allowed imaging of the heart through the edema. Our preliminary results suggest that ethanol interferes with the process of heart looping [Figs. 2e, 2f, 2g, 2h], in agreement with a study on quail.54 The reduction in TA size that is reported in this work was predicted by Cavierres and Smith,55 but not observed. To our knowledge, less developed ventricular trabeculae caused by ethanol exposure [Figs. 2m, 2n, 2o, 2p] have not been previously reported. Interruption of active blood circulation following ethanol treatment was reported in quail and Medaka fish embryos.54, 56 That finding might explain our results concerning the low OCT signal from within the heart (1Videos 1 and 22). However, we could not rule out the possibility that the loss of signal was due to changes in blood composition, rather than an interrupted circulation. Even with their relatively high penetration depths, none of the optical imaging techniques investigated here could image the heart at the onset of cardiac organogenesis (around stage 29), due to high scattering at these earlier stages. We were able to identify the initiation of cardiac movements at stage 35 (data not shown). Clear structural images, at the onset of chamber formation, were acquired from around stage 41, as the embryo became optically transparent. The most detailed images were acquired by all four modalities from stage 46. Cellular-resolution FFOCM and SECM microscopic datasets were difficult to register with histology. The embryos were quite fragile when processed and embedded, making preservation of morphology challenging. Furthermore, images must be registered to histology with a precision on the order of , which is difficult to achieve with conventional sectioning techniques. As a result, there are many gaps in our understanding of the cellular structures that we see with these methods. Additional research is merited to better understand the cellular origins of scattering contrast seen in FFOCM and SECM images. One common characteristic of all imaging modalities presented in this work is the use of endogenous scattering mechanisms within the tissue. Endogenous-contrast imaging is advantageous because it is nondestructive and does not alter the composition of the specimen, the specimen preparation is less substantial or nonexistent, the signal does not decay over time, and biodistribution and delivery are not issues. Still, molecular imaging is critical for relating gene and protein expression to phenotype. We have already demonstrated that fluorescence imaging can be conducted in SECM by modification of the source and detection electronics.57 The coherent detection used in TDOCT, OFDI, and FFOCM cannot directly detect fluorescence. However, several molecular contrast methods have already been suggested for OCT.58, 59 Finally, the endogenous contrast optical imaging modalities presented in this work allow evaluation of the embryonic heart from different vantage points. Combining OFDI, SECM, and FFOCM could leverage their strengths (see Table 1) and provide a tool for obtaining a more comprehensive morphological and functional myocardial phenotype. This multimodality paradigm can be extended to other systems and animal models as well. Since these noninvasive imaging techniques do not alter the specimen, they can be used sequentially or in parallel. Furthermore, while we have used separate imaging systems in this work, there is no fundamental barrier preventing their combination into one imaging system that uses a single wavelength swept source.14, 17, 23 AcknowledgmentsWe gratefully thank Sven Holder and Margaret E. Sherwood for their assistance with paraffin and plastic histology, respectively. We also acknowledge Abraham Fainsod and Jason T. Motz for valuable scientific discussions. ReferencesR. S. Boneva,
L. D. Botto,
C. A. Moore,
Q. Yang,
A. Correa, and
J. D. Erickson,
“Mortality associated with congenital heart defects in the United States: trends and racial disparities, 1979–1997,”
Circulation, 103
(19), 2376
–2381
(2001). 0009-7322 Google Scholar
J. I. Hoffman,
“Congenital heart disease: incidence and inheritance,”
Pediatr. Clin. North Am., 37
(1), 25
–43
(1990). 0031-3955 Google Scholar
D. Srivastava and
E. N. Olson,
“A genetic blueprint for cardiac development,”
Nature (London), 407
(6801), 221
–226
(2000). https://doi.org/10.1038/35025190 0028-0836 Google Scholar
E. N. Olson,
“Gene regulatory networks in the evolution and development of the heart,”
Science, 313
(5795), 1922
–1927
(2006). https://doi.org/10.1126/science.1132292 0036-8075 Google Scholar
J. L. Lohr and
H. J. Yost,
“Vertebrate model systems in the study of early heart development: Xenopus and zebrafish,”
Am. J. Med. Genet., 97
(4), 248
–257
(2000). 0148-7299 Google Scholar
T. J. Mohun,
L. M. Leong,
W. J. Weninger, and
D. B. Sparrow,
“The morphology of heart development in Xenopus laevis,”
Dev. Biol., 218
(1), 74
–88
(2000). 0012-1606 Google Scholar
S. J. Kolker,
U. Tajchman, and
D. L. Weeks,
“Confocal imaging of early heart development in Xenopus laevis,”
Dev. Biol., 218
(1), 64
–73
(2000). 0012-1606 Google Scholar
A. S. Forouhar,
M. Liebling,
A. Hickerson,
A. Nasiraei-Moghaddam,
H. J. Tsai,
J. R. Hove,
S. E. Fraser,
M. E. Dickinson, and
M. Gharib,
“The embryonic vertebrate heart tube is a dynamic suction pump,”
Science, 312
(5774),
(2006). 0036-8075 Google Scholar
W. Luo,
D. L. Marks,
T. S. Ralston, and
S. A. Boppart,
“Three-dimensional optical coherence tomography of the embryonic murine cardiovascular system,”
J. Biomed. Opt., 11
(2), 021014
(2006). https://doi.org/10.1117/1.2193465 1083-3668 Google Scholar
T. M. Yelbuz,
L. Leatherbury,
R. R. Wolfe,
R. Loewy, and
M. L. Kirby,
“Images in cardiovascular medicine. Time-lapse study with high speed video camera in the early embryonic chick heart to visualize a time window of normal and abnormal heart development,”
Circulation, 106
(10), e44
–45
(2002). 0009-7322 Google Scholar
E. Beaurepaire,
A. C. Boccara,
M. Lebec,
L. Blanchot, and
H. Saint-Jalmes,
“Full-field optical coherence microscopy,”
Opt. Lett., 23
(4), 244
–246
(1998). 0146-9592 Google Scholar
A. Dubois,
K. Grieve,
G. Moneron,
R. Lecaque,
L. Vabre, and
C. Boccara,
“Ultrahigh-resolution full-field optical coherence tomography,”
Appl. Opt., 43
(14), 2874
–2883
(2004). https://doi.org/10.1364/AO.43.002874 0003-6935 Google Scholar
G. Moneron,
A. C. Boccara, and
A. Dubois,
“Stroboscopic ultrahigh-resolution full-field optical coherence tomography,”
Opt. Lett., 30
(11), 1351
–1353
(2005). 0146-9592 Google Scholar
C. Boudoux,
S. H. Yun,
W. Y. Oh,
M. White,
N. Iftimia,
M. Shishkov,
B. E. Bouma, and
G. J. Tearney,
“Rapid wavelength-swept spectrally encoded confocal microscopy,”
Opt. Express, 13
(20), 8214
–8221
(2005). https://doi.org/10.1364/OPEX.13.008214 1094-4087 Google Scholar
G. J. Tearney,
R. H. Webb, and
B. E. Bouma,
“Spectrally encoded confocal microscopy,”
Opt. Lett., 23
(15), 1152
–1154
(1998). 0146-9592 Google Scholar
M. A. Choma,
M. V. Sarunic,
C. H. Yang, and
J. A. Izatt,
“Sensitivity advantage of swept source and Fourier domain optical coherence tomography,”
Opt. Express, 11
(18), 2183
–2189
(2003). 1094-4087 Google Scholar
S. H. Yun,
G. J. Tearney,
J. F. de Boer,
N. Iftimia, and
B. E. Bouma,
“High-speed optical frequency-domain imaging,”
Opt. Express, 11
(22), 2953
–2963
(2003). 1094-4087 Google Scholar
R. Huber,
M. Wojtkowski,
J. G. Fujimoto,
J. Y. Jiang, and
A. E. Cable,
“Three-dimensional and C-mode OCT imaging with a compact, frequency swept laser source at ,”
Opt. Express, 13
(26), 10523
–10538
(2005). https://doi.org/10.1364/OPEX.13.010523 1094-4087 Google Scholar
A. Mariampillai,
B. A. Standish,
N. R. Munce,
C. Randall,
G. Liu,
J. Y. Jiang,
A. E. Cable,
A. I. Vitkin, and
V. X. D. Yang,
“Doppler optical cardiogram gated 2D color flow imaging at and 4D in vivo visualization of embryonic heart at on a swept source OCT system,”
Opt. Express, 15
(4), 1627
–1638
(2007). https://doi.org/10.1364/OE.15.001627 1094-4087 Google Scholar
M. W. Jenkins,
D. C. Adler,
M. Gargesha,
R. Huber,
F. Rothenberg,
J. Belding,
M. Watanabe,
D. L. Wilson,
J. G. Fujimoto, and
A. M. Rollins,
“Ultrahigh-speed optical coherence tomography imaging and visualization of the embryonic avian heart using a buffered Fourier domain mode locked laser,”
Opt. Express, 15
(10), 6251
–6267
(2007). https://doi.org/10.1364/OE.15.006251 1094-4087 Google Scholar
S. H. Yun,
G. J. Tearney,
J. F. de Boer, and
B. E. Bouma,
“Removing the depth-degeneracy in optical frequency domain imaging with frequency shifting,”
Opt. Express, 12
(20), 4822
–4828
(2004). https://doi.org/10.1364/OPEX.12.004822 1094-4087 Google Scholar
W. Y. Oh,
S. H. Yun,
G. J. Tearney, and
B. E. Bouma,
“Wide tuning range wavelength-swept laser with two semiconductor optical amplifiers,”
IEEE Photonics Technol. Lett., 17
(3), 678
–680
(2005). https://doi.org/10.1109/LPT.2004.841003 1041-1135 Google Scholar
A. Dubois,
G. Moneron,
K. Grieve, and
A. C. Boccara,
“Three-dimensional cellular-level imaging using full-field optical coherence tomography,”
Phys. Med. Biol., 49
(7), 1227
–1234
(2004). https://doi.org/10.1088/0031-9155/49/7/010 0031-9155 Google Scholar
R. R. Anderson and
J. A. Parrish,
“The optics of human skin,”
J. Invest. Dermatol., 77
(1), 13
–19
(1981). https://doi.org/10.1111/1523-1747.ep12479191 0022-202X Google Scholar
J. Newport and
M. Kirschner,
“A major development transition in early Xenopus embryos: l. Characterization and timing of cellular changes at the midblastula stage,”
Cell, 30 675
–686
(1982). https://doi.org/10.1016/0092-8674(82)90272-0 0092-8674 Google Scholar
P. D. Nieuwkoop and
J. Faber, Normal Table of Xenopus Laevis (Daudin),
(1967) Google Scholar
R. Yelin,
R. B. Schyr,
H. Kot,
S. Zins,
A. Frumkin,
G. Pillemer, and
A. Fainsod,
“Ethanol exposure affects gene expression in the embryonic organizer and reduces retinoic acid levels,”
Dev. Biol., 279
(1), 193
–204
(2005). 0012-1606 Google Scholar
A. M. Glauert,
“Fixation, dehydration and embedding of biological specimens,”
Practical Methods in Electron Microscopy,
(1986) Google Scholar
K. L. Clark,
K. E. Yutzey, and
D. W. Benson,
“Transcription factors and congenital heart defects,”
Annu. Rev. Physiol., 68 97
–121
(2006). https://doi.org/10.1146/annurev.physiol.68.040104.113828 0066-4278 Google Scholar
S. M. Mone,
M. W. Gillman,
T. L. Miller,
E. H. Herman, and
S. E. Lipshultz,
“Effects of environmental exposures on the cardiovascular system: prenatal period through adolescence,”
Pediatrics, 113
(4), 1058
–1069
(2004). 0031-4005 Google Scholar
J. D. Chaudhuri,
“Alcohol and the developing fetus—a review,”
Med. Sci. Monit., 6
(5), 1031
–1041
(2000). Google Scholar
K. L. Jones and
D. W. Smith,
“Recognition of the fetal alcohol syndrome in early infancy,”
Lancet, 2
(7836), 999
–1001
(1973). https://doi.org/10.1016/S0140-6736(73)91092-1 0140-6736 Google Scholar
E. L. Abel, Fetal Alcohol Syndrome, Medical Economics Books, Oradell, NJ
(1990). Google Scholar
D. L. Kraitchman,
A. W. Heldman,
E. Atalar,
L. C. Amado,
B. J. Martin,
M. F. Pittenger,
J. M. Hare, and
J. W. Bulte,
“In vivo magnetic resonance imaging of mesenchymal stem cells in myocardial infarction,”
Circulation, 107
(18), 2290
–2293
(2003). https://doi.org/10.1161/01.CIR.0000070931.62772.4E 0009-7322 Google Scholar
F. Wiesmann,
J. Ruff,
K. H. Hiller,
E. Rommel,
A. Haase, and
S. Neubauer,
“Developmental changes of cardiac function and mass assessed with MRI in neonatal, juvenile, and adult mice,”
Am. J. Physiol. Heart Circ. Physiol., 278
(2), H652
–657
(2000). 0363-6135 Google Scholar
N. M. Malyar,
M. Gossl,
P. E. Beighley, and
E. L. Ritman,
“Relationship between arterial diameter and perfused tissue volume in myocardial microcirculation: a micro-CT-based analysis,”
Am. J. Physiol. Heart Circ. Physiol., 286
(6), H2386
–2392
(2004). 0363-6135 Google Scholar
C. T. Badea,
B. Fubara,
L. W. Hedlund, and
G. A. Johnson,
“4-D micro-CT of the mouse heart,”
Mol. Imaging, 4
(2), 110
–116
(2005). 1535-3508 Google Scholar
S. Srinivasan,
H. S. Baldwin,
O. Aristizabal,
L. Kwee,
M. Labow,
M. Artman, and
D. H. Turnbull,
“Noninvasive, in utero imaging of mouse embryonic heart development with echocardiography,”
Circulation, 98
(9), 912
–918
(1998). 0009-7322 Google Scholar
L. W. Dobrucki and
A. J. Sinusas,
“Molecular imaging. A new approach to nuclear cardiology,”
Q. J. Nucl. Med. Mol. Imaging, 49
(1), 106
–115
(2005). 1824-4785 Google Scholar
L. Stegger,
K. P. Schafers,
U. Flogel,
L. Livieratos,
S. Hermann,
C. Jacoby,
P. Keul,
E. M. Conway,
O. Schober,
J. Schrader,
B. Levkau, and
M. Schafers,
“Monitoring left ventricular dilation in mice with PET,”
J. Nucl. Med., 46
(9), 1516
–1521
(2005). 0161-5505 Google Scholar
J. R. Hove,
R. W. Koster,
A. S. Forouhar,
G. Acevedo-Bolton,
S. E. Fraser, and
M. Gharib,
“Intracardiac fluid forces are an essential epigenetic factor for embryonic cardiogenesis,”
Nature (London), 421
(6919), 172
–177
(2003). https://doi.org/10.1038/nature01282 0028-0836 Google Scholar
S. A. Boppart,
G. J. Tearney,
B. E. Bouma,
J. F. Southern,
M. E. Brezinski, and
J. G. Fujimoto,
“Noninvasive assessment of the developing Xenopus cardiovascular system using optical coherence tomography,”
Proc. Natl. Acad. Sci. U.S.A., 94
(9), 4256
–4261
(1997). https://doi.org/10.1073/pnas.94.9.4256 0027-8424 Google Scholar
S. A. Boppart,
M. E. Brezinski,
B. E. Bouma,
G. J. Tearney, and
J. G. Fujimoto,
“Investigation of developing embryonic morphology using optical coherence tomography,”
Dev. Biol., 177
(1), 54
–63
(1996). https://doi.org/10.1006/dbio.1996.0144 0012-1606 Google Scholar
V. X. D. Yang,
M. L. Gordon,
E. Seng-Yue,
S. Lo,
B. Qi,
J. Pekar,
A. Mok,
B. C. Wilson, and
I. A. Vitkin,
“High speed, wide velocity dynamic range Doppler optical coherence tomography (part 2): Imaging in vivo cardiac dynamics of Xenopus laevis,”
Opt. Express, 11
(14), 1650
–1658
(2003). 1094-4087 Google Scholar
S. Yazdanfar,
M. D. Kulkarni, and
J. A. Izatt,
“High resolution imaging of in vivo cardiac dynamics using color Doppler optical coherence tomography,”
Opt. Express, 1
(13), 424
–431
(1997). 1094-4087 Google Scholar
T. M. Yelbuz,
M. A. Choma,
L. Thrane,
M. L. Kirby, and
J. A. Izatt,
“Optical coherence tomography: a new high-resolution imaging technology to study cardiac development in chick embryos,”
Circulation, 106
(22), 2771
–2774
(2002). https://doi.org/10.1161/01.CIR.0000042672.51054.7B 0009-7322 Google Scholar
M. W. Jenkins,
F. Rothenberg,
D. Roy,
V. P. Nikolski,
Z. Hu,
M. Watanabe,
D. L. Wilson,
I. R. Efimov, and
A. M. Rollins,
“4D embryonic cardiography using gated optical coherence tomography,”
Opt. Express, 14
(2), 736
–748
(2006). https://doi.org/10.1364/OPEX.14.000736 1094-4087 Google Scholar
M. Liebling,
A. S. Forouhar,
M. Gharib,
S. E. Fraser, and
M. E. Dickinson,
“Four-dimensional cardiac imaging in living embryos via postacquisition synchronization of nongated slice sequences,”
J. Biomed. Opt., 10
(5), 054001
(2005). https://doi.org/10.1117/1.2061567 1083-3668 Google Scholar
T. A. Cudd,
“Animal model systems for the study of alcohol teratology,”
Exp. Biol. Med., 230
(6), 389
–393
(2005). 0071-3384 Google Scholar
T. H. Dresser,
E. R. Rivera,
F. J. Hoffmann, and
R. A. Finch,
“Teratogenic assessment of four solvents using the frog embryo teratogenesis assay—xenopus (FETAX),”
J. Appl. Toxicol., 12
(1), 49
–56
(1992). https://doi.org/10.1002/jat.2550120111 0260-437X Google Scholar
N. Nakatsuji,
“Craniofacial malformation in Xenopus laevis tadpoles caused by the exposure of early embryos to ethanol,”
Teratology, 28
(2), 299
–305
(1983). 0040-3709 Google Scholar
J. Bilotta,
J. A. Barnett,
L. Hancock, and
S. Saszik,
“Ethanol exposure alters zebrafish development: a novel model of fetal alcohol syndrome,”
Neurotoxicol. Teratol., 26
(6), 737
–743
(2004). 0892-0362 Google Scholar
W. O. Twal and
M. H. Zile,
“Retinoic acid reverses ethanol-induced cardiovascular abnormalities in quail embryos,”
Alcohol Clin. Exp. Res., 21
(6), 1137
–1143
(1997). 0145-6008 Google Scholar
M. F. Cavieres and
S. M. Smith,
“Genetic and developmental modulation of cardiac deficits in prenatal alcohol exposure,”
Alcohol Clin. Exp. Res., 24
(1), 102
–109
(2000). 0145-6008 Google Scholar
X. Wang,
E. Williams,
M. L. Haasch, and
A. K. Dasmahapatra,
“Japanese medaka (Oryzias latipes): developmental model for the study of alcohol teratology,”
Birth Defects Res. B Dev. Reprod. Toxicol., 77
(1), 29
–39
(2006). Google Scholar
J. T. Motz,
D. Yelin,
B. J. Vakoc,
B. E. Bouma, and
G. J. Tearney,
“Spectral- and frequency-encoded fluorescence imaging,”
Opt. Lett., 30
(20), 2760
–2762
(2005). https://doi.org/10.1364/OL.30.002760 0146-9592 Google Scholar
S. A. Boppart,
A. L. Oldenburg,
C. Xu, and
D. L. Marks,
“Optical probes and techniques for molecular contrast enhancement in coherence imaging,”
J. Biomed. Opt., 10
(4), 41208
(2005). 1083-3668 Google Scholar
C. Yang,
“Molecular contrast optical coherence tomography: a review,”
Photochem. Photobiol., 81
(2), 215
–237
(2005). https://doi.org/10.1562/2004-08-06-IR-266.1 0031-8655 Google Scholar
|


