|
|
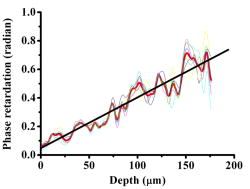
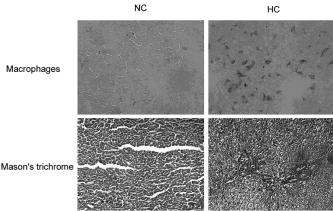
1.IntroductionOptical coherence tomography (OCT) has been widely used for high-resolution biological tissue imaging and fast scanning.1, 2, 3 It has been applied to scans of various portions of biological tissue, and used for the diagnosis of various diseases, including human mucosa,4 urinary bladder,5 retinal nerve fiber layer,6 and cornea.7 In many situations, such as the pathological process in tissue, changes in the sample scattering property are so small that measurement is difficult. Therefore, for clinical applications, imaging contrast enhancement is an important issue.8, 9, 10 Polarization-sensitive optical coherence tomography (PSOCT) combines the depth resolution of OCT with polarization-dependent scanning to image the optical birefringence of biological tissues. 6, 7, 8, 11, 12, 13, 14 Many biological tissues, such as myocardium, tendon, muscle, nerve, bone, and teeth, exhibit birefringence characters of their fibrous structures. PSOCT is used for probing samples with polarized incident light and polarization-sensitive detection of interference fringes, leading to the information of tissue birefringence and optical axis orientation. In the past few decades, hypercholesterolemia has emerged to be a major health threat in the developed world. While most related studies addressed vascular diseases, its impact on liver were overlooked. Liver is the central organ to handle cholesterol metabolism, and in experimental models, hypercholesterolemia resulted in significant liver steatosis. It has been reported that accumulation of excess cholesterol in the liver results in inflammation and fibrosis.15, 16 The diagnosis of chronic active inflammation in fatty liver relies on liver biopsy, since detection of inflammation in the presence of liver steatosis has been a challenge to currently available imaging methods including ultrasonography, computer-assisted tomography, and magnetic resonance imaging.17 Therefore, it is important to develop a novel imaging modality for such diagnosis. Pathologic features of steatohepatitis include portal fibrosis, balloon degeneration of hepatocytes, and increased infiltration of inflammatory cells, which collectively imply that structural inhomogeneities can be targets to detect the inflammatory activity in fatty liver.18 In this study, we evaluate tissue birefringence in the liver of hypercholesterolemic rats with the PSOCT technique through in vitro measurements of phase retardation and tissue depth. The birefringence of such a sample is usually due to delicate structures that cannot be resolved by a standard OCT system. From the histology images, anisotropic structures can be observed in hypercholesterolemic rat liver, which is quite different from the isotropic nature of healthy liver. 2.Experimental ProceduresThe PSOCT system is illustrated in Fig. 1 .11 We used a mode-locked Ti: sapphire laser centered at , with the spectral full width at half maximum of about , as the broadband light source. Light from the source passes through a half-wave plate (HWP) and a polarization beamsplitter (PBS1) to become a vertically polarized wave. It is then split into reference and sample arms with a polarization-insensitive beamsplitter (BS). A quarter-wave plate (QWP2) is placed in the reference arm with the slow axis oriented from the horizontal direction. The optical signal in the reference beam undergoes a round-trip half-wave shift through QWP2 and returns with a linear polarization tilted from the horizontal direction. In the sample arm, a quarter-wave plate (QWP1) is used to rotate the signal polarization from the vertical direction to provide circularly polarized light for scanning the sample. The backscattered light from the sample, generally elliptically polarized, passes through QWP1 again to receive a phase delay. The polarization beamsplitter (PBS2) splits the recombined reference and sample beams into two orthogonal linear polarization modes. They are detected with two photodetectors. The reference arm is equipped with a standard rapid scanning optical delay line for phase and group delays.19, 20, 21, 22 The distance between the grating and the lens and the grating orientation in the optical phase delay line are adjusted to compensate the dispersion.21, 22 Based on the spectral data of the light source, the theoretical value of the depth resolution is in air. However, because the system dispersion is not perfectly compensated, the actual depth resolution of our system is about in air, corresponding to a resolution of in tissue. The light spot size on the sample is about . About power is applied to the samples. The sensitivity of the PSOCT system is about . Fig. 1Schematic diagram of the PSOCT system. PBS: polarization beam splitter; BS: beam splitter; HWP: half-wave plate; QWP: quarter-wave plate; D: detector. 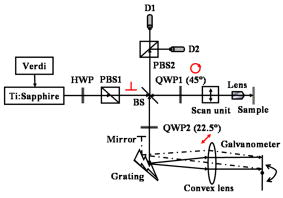 Sample preparation was performed in accordance with the China Animal Protection Law (Scientific Application of Animals), 1998. Rats were divided into a normal control (NC) group and a high-cholesterol (HC) diet group. We fed NC rats with standard rodent chow and water. The high-cholesterol diet contained 4% cholesterol. Rats were sacrificed postfeeding after three weeks. To harvest the livers, a lethal dose of sodium pentobarbital was administered. The animals were retrogradely perfused with heparinized phosphate buffered saline (PBS) for . The livers were then quickly removed and fixed onto the translation stage of the PSOCT system. 3.Optical Coherence Tomography Scanning ResultsThe phase retardation of the sample is defined as23 Here, is the depth in the sample, and and denote the signal amplitudes of the horizontal and vertical channels, respectively. The birefringence of the sample is given byHere, is the central wavelength of the light source. Note that Eq. 1 can be used for the evaluation of phase retardation for any relative orientation between the major axes of the birefringent tissue and the vertical/horizontal directions of the optical system.23 Figures 2a and 2b show the structure images of normal and hypercholesterolemic rat livers, respectively. In other words, these two OCT images show the data of . No clear features for differentiating the two liver samples can be seen, implying that the structure difference between normal and hypercholesterolemic rat livers cannot be distinguished with a standard OCT system.Fig. 2Structural images of (a) normal rat liver and (b) hypercholesterolemic rat liver, and phase retardation images of (c) normal rat liver and (d) hypercholesterolemic rat liver. One can see the almost identical images between (a) and (b). However, (c) and (d) are quite different, indicating the birefringence nature in hypercholesterolemic rat liver. 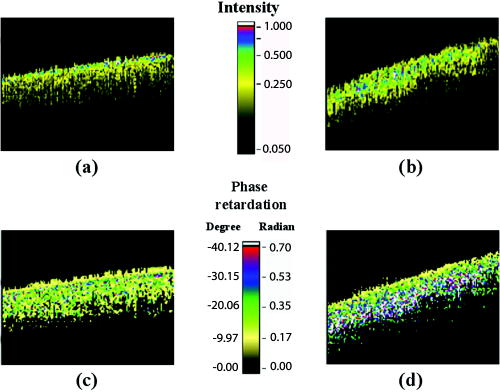 However, as shown in Figs. 2c and 2d, the phase retardation images of the normal [Fig. 2a] and hypercholesterolemic [Fig. 2d] rat livers show distinct features. One can see that phase retardation of the normal rat liver is almost constant due to its isotropic nature. However, the phase retardation image of the hypercholesterolemic rat liver shows the gradient variation along the sample depth. Such a variation feature implies that the hypercholesterolemic rat liver possesses a certain birefringence character. To determine the birefringence value, we can take the average number of A-mode-scan profiles of phase retardation and fit the average result with a straight line. The slope of this straight line is related to the birefringence of the sample [see Eq. 2]. The number of A-mode-scan profiles for averaging depends on the convergence of the averaging process to a reasonable value. In Fig. 3 , we show the determination of the birefringence value of a healthy rat liver with the thick black slope line for fitting the average A-mode-scan profile of phase retardation (thick red curve), which is obtained by averaging 15 A-mode-scan results, as plotted in the light-color curves. The calculated birefringence value is . Another approach for calculating the birefringence value is to first obtain the fitting slope of each A-mode-scan profile and take the average of those 15 slopes. With this approach, based on the statistics of the 15 A-mode-scan results, the average of the birefringence value is and the standard deviation is . These two average birefringence values are about the same and are quite small when compared with those of the hypercholesterolemic rat liver (see next). Fig. 3Average birefringence of healthy rat liver shown with a thick black slope line for fitting the average A-mode-scan profile of phase retardation (thick red curve), which is obtained by averaging 15 A-mode-scan results, as plotted in the light-color curves. (Color online only.) 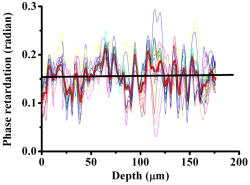 Figure 4 shows the same average process for the hypercholesterolemic rat liver. For this sample, we used seven A-mode-scan profiles for the average. The calculated birefringence value based on the average A-mode-scan profile for the hypercholesterolemic rat liver is . On the other hand, based on the approach of averaging individual slopes of the A-mode-scan profiles, the average birefringence value of the hypercholesterolemic rat liver is and the standard deviation is . Again, the two average values are about the same. The much smaller standard deviation, when compared with the average value, confirms that using fewer A-mode-scan profiles for the averaging process in this sample is appropriate. Those average values are more than 150 times larger than those obtained from Fig. 3 for healthy rat liver. With such a large contrast in the birefringence value, it is reasonable to conclude that the liver is transferred from isotropic in its optical property into an anisotropic nature after it becomes hypercholesterolemic, with a birefringence value in the order of . Note that in Figs. 3 and 4, at the tissue surface, the phase retardation is not exactly zero in either tissue sample. The slight deviations from zero, which are around or for the healthy liver (see the thick red curve in Fig. 3) and around or for the hypercholesterolemic liver, are attributed to the system inaccuracy, which is quite small. 4.Origin of Tissue Birefringence in the Hypercholesterolemic LiverTo identify the source of tissue birefringence, formalin-fixed liver samples were processed into sections (with a thickness of ) and stained with the immunohistochemical and Mason’s trichrome staining methods. Representative micrographs are shown in Fig. 5 . For immunohistochemistry, sections were incubated with a monoclonal primary antibody against ED1 (a marker for infiltrating macrophages) in 1:100 dilutions at room temperature for . The sections were then incubated with a detection secondary antibody for and developed with a substrate-chromogen solution. Images were acquired magnification, and the cell density was counted in three animals in each group. In the NC group, little inflammatory cells were present (density: cells per field, images from three animals). However, we found the presence of infiltrating ED1 positive macrophages in the livers of the HC group (density: cells per field, compared with NC, images from three animals). We speculate that the increased macrophage density might contribute to the altered tissue birefringence based on the following two evidences. First, macrophages are visible under OCT in a cell culture system.24 Second, it has been reported that OCT has been applied to detect macrophages and lipid-laden foamy cells in atherosclerotic plaques.25 Therefore, the presence of macrophages in liver parenchyma may produce optical inhomogeneity and result in the behavior of birefringence. With Mason’s trichrome staining, the tissue structure was mostly anisotropic in the NC group. In contrast, steatosis of hepatocytes, portal proliferation and periportal fibrosis in the HC group disrupted the anisotropy. Since collagen is a major source of tissue birefringence, we also measured the tissue contents of hydroxyproline, which is an amino acid only present in the collagen molecule. Hydrolysis of liver samples was carried out in 6N HCl at for . After evaporating under a vacuum, hydroxyproline was measured using the colorimetric method described by Stegemann and Stalder.26 The absorbance was measured by a spectrophotometer at . As a result, hydroxyproline concentration was significantly higher in the liver of the HC group compared with the NC group versus liver, , in each group). From these evidences, one can conclude that the infiltration of macrophages and increased collagen deposition (especially in the periportal area) perturbed the structure of the normal liver and contributed to the tissue birefringence in hypercholesterolemic liver. 5.ConclusionsIn summary, we measure in vitro tissue birefringence in the liver of hypercholesterolemic rats with PSOCT. Tissue birefringence is evaluated through the measurement of phase retardation. Birefringence is calculated to give an order of magnitude of in hypercholesterolemic rat liver. The infiltration of macrophages and increased collagen deposition are the major causes for tissue birefringence in hypercholesterolemic liver. For in vivo application of the PSOCT system for hypercholesterolemic liver diagnosis, a needle-shaped catheter with an outer diameter in the range of is needed. To fabricate such a catheter, a small scanning mirror based on the microelectromechanical optics technique is useful.27 Meanwhile, because liver tissue is a highly scattering medium, an OCT system with a central wavelength of light source around can penetrate deeper into liver tissue. A swept-source spectral-domain OCT system with a central wavelength around can be a better tool for further studying the optical properties of abnormal livers. AcknowledgmentThis research was sponsored by the National Health Research Institute, the Republic of China in Taiwan, under grant of NHRI-EX94-9220EI. ReferencesD. Huang,
E. A. Swanson,
C. P. Lin,
J. S. Schuman,
W. G. Stinson,
W. Chang,
M. R. Hee,
T. Flotte,
C. A. Puliafito, and
J. G. Fujimoto,
“Optical coherence tomography,”
Science, 254 1178
–1181
(1991). https://doi.org/10.1126/science.1957169 0036-8075 Google Scholar
B. Povazay,
K. Bizheva,
A. Unterhuber,
B. Hermann,
H. Sattmann,
A. F. Fercher, and
W. Drexler,
“Submicrometer axial resolution optical coherence tomography,”
Opt. Lett., 27 1800
–1802
(2002). https://doi.org/10.1364/OL.27.001800 0146-9592 Google Scholar
S. H. Yun,
G. J. Tearney,
B. E. Bouma,
B. H. Park, and
J. F. de Boer,
“High-speed spectral-domain optical coherence tomography at wavelength,”
Opt. Express, 11 3598
–3604
(2003). 1094-4087 Google Scholar
A. Sergeev,
V. Gelikonov,
G. Gelikonov,
F. Feldchtein,
R. Kuranov,
N. Gladkova,
N. Shakhova,
L. Snopova,
A. Shakhov,
I. Kuznetzova,
A. Denisenko,
V. Pochinko,
Y. Chumakov, and
O. Streltzova,
“In vivo endoscopic OCT imaging of precancer and cancer states of human mucosa,”
Opt. Express, 1 432
–440
(1997). 1094-4087 Google Scholar
T. Xie,
M. Zeidel, and
Y. Pan,
“Detection of tumorigenesis in urinary bladder with optical coherence tomography: optical characterization of morphological changes,”
Opt. Express, 10 1431
–1443
(2002). 1094-4087 Google Scholar
B. Cense,
T. C. Chen,
B. H. Park,
M. C. Pierce, and
J. F. de Boer,
“In vivo depth-resolved birefringence measurements of the human retinal nerve fiber layer by polarization-sensitive optical coherence tomography,”
Opt. Lett., 27 1610
–1612
(2002). https://doi.org/10.1364/OL.27.001610 0146-9592 Google Scholar
E. Goetzinger,
M. Pircher,
M. Sticker,
A. F. Fercher, and
C. K. Hitzenberger,
“Measurement and imaging of birefringent properties of the human cornea with phase-resolved polarization-sensitive optical coherence tomography,”
J. Biomed. Opt., 9
(1), 94
–102
(2004). https://doi.org/10.1117/1.1629308 1083-3668 Google Scholar
M. J. Everett,
K. Schoenenberger, B. W. Colston Jr., L. B. Da Silva,
“Birefringence characterization of biological tissue by use of optical coherence tomography,”
Opt. Lett., 23 228
–230
(1998). 0146-9592 Google Scholar
Y. Jiang,
I. V. Tomov,
Y. Wang, and
Z. P. Chen,
“High-resolution second-harmonic optical coherence tomography of collagen in rat-tail tendon,”
Appl. Phys. Lett., 86 133901
(2005). https://doi.org/10.1063/1.1894607 0003-6951 Google Scholar
Z. P. Chen,
T. E. Milner,
D. Dave, and
J. S. Nelson,
“Optical Doppler tomographic imaging of fluid flow velocity in highly scattering media,”
Opt. Lett., 22 64
–66
(1997). 0146-9592 Google Scholar
M. R. Hee,
D. Huang,
E. A. Swanson, and
J. G. Fujimoto,
“Polarization-sensitive low-coherence reflectometer for birefringence characterization and ranging,”
J. Opt. Soc. Am. B, 9 903
–908
(1992). 0740-3224 Google Scholar
J. de Boer,
T. Milner,
M. van Gemert, and
J. Nelson,
“Two-dimensional birefringence imaging in biological tissue by polarization-sensitive optical coherence tomography,”
Opt. Lett., 22 934
–936
(1997). 0146-9592 Google Scholar
J. J. Pasquesi,
S. C. Schlachter,
M. D. Boppart,
E. Chaney,
S. J. Kaufman, and
S. A. Boppart,
“In vivo detection of exercise-induced ultrastructural changes in genetically-altered murine skeletal muscle using polarization-sensitive optical coherence tomography,”
Opt. Express, 14 1547
–1556
(2006). https://doi.org/10.1364/OE.14.001547 1094-4087 Google Scholar
M. C. Pierce,
J. Strasswimmer,
B. H. Park,
B. Cense, J. F. deBoer,
“Birefringence measurements in human skin using polarization-sensitive optical coherence tomography,”
J. Biomed. Opt., 9
(2), 287
–291
(2004). https://doi.org/10.1117/1.1645797 1083-3668 Google Scholar
W. I. Jeong,
D. H. Jeong,
S. H. Do,
Y. K. Kim,
H. Y. Park, and
O. D. Kwon,
“Mild hepatic fibrosis in cholesterol and sodium cholate diet-fed rats,”
J. Vet. Med. Sci., 67 235
–242
(2005). 0916-7250 Google Scholar
I. R. Wanless,
J. Belgiorno, and
P. M. Huet,
“Hepatic sinusoidal fibrosis induced by cholesterol and stilbestrol in the rabbit: 1. Morphology and inhibition of fibrogenesis by dipyridamole,”
Hepatology (Philadelphia, PA, U. S.), 24 855
–864
(1996). 0270-9139 Google Scholar
S. Saadeh,
Z. M. Younossi,
E. M. Remer,
T. Gramlich,
J. P. Ong,
M. Hurley,
K. D. Mullen,
J. N. Cooper, and
M. J. Sheridan,
“The utility of radiological imaging in nonalcoholic fatty liver disease,”
Gastroenterology, 123 745
–750
(2002). 0016-5085 Google Scholar
T. Gramlich,
D. E. Kleiner,
A. J. McCullough,
C. A. Matteoni,
N. Boparai, and
Z. M. Younossi,
“Pathologic features associated with fibrosis in non-alcoholic fatty liver disease,”
Hum. Pathol., 35 196
–199
(2004). 0046-8177 Google Scholar
G. J. Tearney,
B. E. Bouma, and
J. G. Fujimoto,
“High-speed phase- and group-delay scanning with a grating-based phase control delay line,”
Opt. Lett., 22 1811
–1813
(1997). 0146-9592 Google Scholar
A. M. Rollins,
M. D. Kulkarni,
S. Yazdanfar,
R. Ung-arunyawee, and
J. A. Izatt,
“In vivo video rate optical coherence tomography,”
Opt. Express, 3 219
–229
(1998). 1094-4087 Google Scholar
W. K. Niblack,
J. O. Schenk,
B. Liu, and
M. E. Brezinski,
“Dispersion in a grating-based optical delay line for optical coherence tomography,”
Appl. Opt., 42 4115
–4118
(2003). 0003-6935 Google Scholar
E. D. J. Smith,
A. V. Zvyagin, and
D. D. Sampson,
“Real-time dispersion compensation in scanning interferometry,”
Opt. Lett., 27 1998
–2000
(2002). 0146-9592 Google Scholar
K. Schoenenberger, B. W. Colston Jr., D. J. Maitland,
L. B. D. Silva, and
M. J. Everett,
“Mapping of birefringence and thermal damage in tissue by use of polarization-sensitive optical coherence tomography,”
Appl. Opt., 37 6026
–6036
(1998). 0003-6935 Google Scholar
A. L. Oldenburg,
J. R. Gunther, and
S. A. Boppart,
“Imaging magnetically labeled cells with magnetomotive optical coherence tomography,”
Opt. Lett., 30 747
–749
(2005). https://doi.org/10.1364/OL.30.000747 0146-9592 Google Scholar
G. J. Tearney,
H. Yabushita,
S. L. Houser,
H. T. Aretz,
I. K. Jang,
K. H. Schlendorf,
C. R. Kauffman,
M. Shishkov,
E. F. Halpern, and
B. E. Bouma,
“Quantification of macrophage content in atherosclerotic plaques by optical coherence tomography,”
Circulation, 107 113
–119
(2003). https://doi.org/10.1161/01.CIR.0000044384.41037.43 0009-7322 Google Scholar
H. Stegemann and
K. Stalder,
“Determination of hydroxyproline,”
Clin. Chim. Acta, 18 267
–273
(1967). https://doi.org/10.1016/0009-8981(67)90167-2 0009-8981 Google Scholar
W. Jung,
J. Zhang,
L. Wang,
P. Wilder-Smith, and
Z. Chen,
“Three-dimensional optical coherence tomography employing a 2-axis microelectromechanical scanning mirror,”
IEEE J. Sel. Top. Quantum Electron., 11 806
–810
(2005). 1077-260X Google Scholar
|

