
|
|
1.IntroductionRheumatoid arthritis (RA) is one of the most common autoimmune inflammatory diseases and affects small and large joints, causing severe pain, functional impairment, and ultimately destruction of the affected joints. Currently available treatments for RA fail to cure the disease, and many have pronounced systemic side effects.1, 2 Gene and cellular gene therapy approaches have the potential to provide specific treatment leading to sustained alleviation of the symptoms or a cure for RA. Various gene and cellular gene therapy approaches for targeting antiinflammatory proteins to inflamed joints have been described.3, 4, 5 Dendritic cells (DC) carrying tumor necrosis factor (TNF)-related apoptosis inducing ligand have been used to inhibit the development of collagen-Induced arthritis (CIA) in mice.6 DC expressing IL-4 have been shown to effectively treat established CIA.7, 8 T cells and hybridomas have also been used for the delivery of immunoregulatory proteins to the inflamed joints of CIA mice.9, 10, 11 Our goal was to develop quantitative and clinically applicable methods for monitoring the trafficking of therapeutic T cells in living subjects. To achieve this goal, we employed a multimodality reporter gene (RG) imaging approach previously developed in our laboratories.12, 13, 14 We also used a replication deficient lentivirus15 to incorporate the triple fusion reporter (TFR) gene construct14 into collagen type II (C-II)-specific T cell hybridomas.10 We selected the TFR construct containing a humanized renilla luciferase (hRluc) gene, a monomeric red fluorescent protein (mRFP) gene, and a mutant truncated herpes simplex virus 1 thymidine kinase (HSV1-tsr39tk) positron emission tomography (PET) RG. This TFR construct was chosen as opposed to the other available TFR constructs (with different combinations of reporter genes) due to its relatively high HSV1-tsr39TK activity.14 Two C-II-specific T-cell hybridomas were transduced with the previous construct and analyzed for trafficking in CIA mice. 1. A2 cells had been produced in our laboratory several years ago and had inhibited formation of inflammation in the paws of CIA mice, when they had been transduced with a retroviral vector to express the IL12-p40 transgene and adoptively transferred.9 2. AG6 cells, an additional C-II-specific T-cell hybridoma, were generated later. We set out to answer the following questions with this study. 1. Approximately how many cells have trafficked to the paws at a specific time point after injection? 2. How will the number of cells injected into the mouse affect the number of cells trafficking to the paws? 3. In CIA mice, how does the observed degree of inflammation affect the number of cells accumulating in the paws? 2.Materials and Methods2.1.Induction of ArthritisAll animal experiments were approved by the Stanford University Animal Research Internal Review Board. DBA1/J mice were purchased from Jackson Laboratories (Bar Harbor, Maine). Bovine type II collagen dissolved at in acetic acid was purchased from Chondrex. Complete Freund’s Adjuvant (CFA) (Sigma, St. Louis, Missouri), containing 2-mg/ml inactivated M. tuberculosis and collagen were mixed to produce a thick emulsion. 8 to 10 weeks old DBA1/J mice were injected with of the collagen/CFA emulsion subcutaneously from the base of the tail. After 21 days, these mice were boosted subcutaneously with of an emulsion containing equal volumes of Incomplete Freund’s Adjuvant and collagen at the base of the tail. The incidence of inflammation was then synchronized by injecting of lipopolysaccharide (LPS) intraperitoneally, 3 days after the boost. Within a week, 80 to 100% of the mice developed paw inflammation. 2.2.Lentiviral Vectors and Reporter Gene ConstructsThe lentiviral vector pHR1 was generated by replacing eGFP in (provided by Breckpot15) with a new multiple cloning site. The triple fusion gene hrLuc-mRFP-HSV1-tsr39tk (TFR)14 was subcloned from pcDNA3.1 to pHR1. For virus production, cells were plated at cells per flask in complete Iscove's Modified Dulbecco's Medium (IMDM) [containing 10% fetal calf serum (FCS), penicillin/streptomycin, and L-glutamine]. After , they were transfected by calcium/phosphate method ( of lentiviral vector pHR, of packaging vector , and of vesticular stomatitis virus G (VSVG)-encoding vector per flask) in the presence of chloroquine ( , Sigma). After 8 to , the transfection medium was replaced with normal complete IMDM medium. The virus-containing supernatant was harvested 24 to later, filtered through a polyethersulphone (PES) filter, and ultra-centrifuged for and at . Viral particles were resuspended in a small volume of plain IMDM medium and frozen at C. Viral titer was estimated using dilutions of the virus on cells and flow cytometry analysis of cells two days after infection. 2.3.T-Cell Hybridomas and Stable Reporter Gene TransductionT-cell hybridomas and AG6 were obtained by fusion of BW5147 TCR negative thymoma cells with an equal number of freshly activated T cells from collagen type II-specific TCR-transgenic mice,16 in presence of PEG 1500 (Roche, manufacturer’s protocol) and selected for 3 weeks in presence of sodium hypoxanthine, aminopterin, and thymidine (HAT) (Gibco, Carlsbad, California) and 2 weeks in presence of sodium hypoxanthine and thymidine (HT) (Sigma). A2 and AG6 were two of many clones isolated by cell sorting (FACStar, BD, Franklin Lakes, New Jersey). Cells were then infected with TFR virus at MOI of 10 in presence of protamine sulfate . cells were repeatedly purified by cell sorting. 2.4.In Vitro Humanized Renilla Luciferase Activity AssayT-cell hybridomas were harvested and live cells were counted by Trypan blue exclusion. A known number of pelleted cells were lysed with passive lysis buffer (Promega) and incubated at room temperature for . The lysate was then centrifuged at 13,000 RPM for and the protein concentration of lysate supernatant was measured. The amount of lysate, equivalent to of protein, was added to phosphate buffered saline (PBS) (total volume= ) and hRluc activity was measured with a luminometer immediately after addition of coelenterazine. Based on the measurements, the in vitro hRluc activity per cell was calculated. Two different luminometers were used for the studies described in this work. At the time the trafficking of A2-TFR cells was being studied, the luminometer Turner Designs model 2020 was available in our laboratory. At the time the trafficking of AG6-TFR cells was being studied, the luminometer Turner Biosystems model 2030-001 was available at our laboratory. Comparing the measurements from both systems, model 2030-001 was on average 1444 times higher than model 2020. 2.5.Bioluminescence Imaging of Collagen-Induced Arthritic MiceCIA mice were anesthetized initially with 2% isofluorane and then by of a ketamine and xylazine solution. Once anesthetized, CIA mice paws were spread and taped down with transparent scotch tape on black cardboard. Coelenterazine, a bioluminescent substrate of the Rluc enzyme, was dissolved in a 1:1 solution of ethanol:polyethylene glycol at a concentration of , and was aliquoted in amber microcentrifuge tubes, stored at C. Just prior to injection into each mouse, the coelenterazine stock solution in each tube was diluted by adding of sterile . of coelenterazine was injected through a lateral tail vein of the mice before scanning with a Xenogen IVIS-100 charge-coupled device (CCD) camera for , immediately after injection. 2.6.Micro-Positron Emission Tomography Imaging of Collagen-Induced Arthritic Mice9-[4- fluoro-3–(hydroxymethyl)butyl]guanine ( FHBG), the PET reporter probe (PRP) substrate of the HSV1-sr39TK enzyme, was used to detect intravenously injected TFR expressing T-cell hybridomas in CIA mice with a microPET R4 scanner (Siemens, Malverne, Pennsylvania). The synthesis, specific activity, and radiochemical purity of in our laboratory has been described by Yaghoubi 17 Approximately of was injected into the lateral tail veins of CIA mice, two hours prior to the microPET scan. Mice were conscious for the two-hour period. Prior to the scan, the investigator emptied each mouse’s bladder as much as possible by exerting pressure on the bladder. Then the mice were anesthetized with 2.5% isoflurane. The entire body of each mouse was scanned for for activity using a R4 microPET system (Siemens). This system generates images with approximate resolution of . Images were reconstructed using the ordered subsets expectation maximization (OSEM) algorithm and analyzed with AMIDE software.18 2.7.Assays to Determine a Mathematical Relationship between the Number of Cells in the Inflamed Paws and Light Intensity from Bioluminescence ImagesTo derive equations that could estimate the number of cells in the paws of CIA mice from bioluminescence images, we needed to determine the amount of light detected by the bioluminescence camera from a known number of cells implanted in the paws. Cultured A2-TFR or AG6-TFR cells were harvested and counted on the day of injection. Various numbers of cells, ranging from 1000 to 800,000, were resuspended in of sterile PBS in microcentrifuge tubes. The harvested cells were also assayed in vitro for the level of hRluc activity (RLU) per of protein and per cell. DBA1/J mice were anesthetized, injected with coelenterazine, and scanned with the bioluminescence camera to acquire a background scan. Afterward, of thawed Matrigel was mixed with the predetermined number of cells in PBS and implanted subcutaneously in the paws of the DBA1/J mice . Up to of ketamine /xylazine had been injected into each mouse to make sure they stayed completely unconscious during the entire procedure. The same mice, which had background scans and implanted cells, were again scanned with the bioluminescence imaging camera following injection of coelenterazine. Approximately elapsed between the time of cell implantation and the second bioluminescence scan. These procedures were repeated by injecting known quantities of cells deeper into the paws of a limited number of deeply anesthetized DBA1/J mice to assess the effect of tissue depth on signal intensities. Mice were sacrificed prior to regaining consciousness. Regions of interest were drawn, including the entire paw on each image, to measure the total light flux and maximum radiance from each paw. The measurements in the ROI of each paw from pre-cell injection images were subtracted from the measurements in the ROI of the same paws from the post-cell injection images to obtain net total light flux or maximum radiance due to the presence of the cells. The levels of luciferase activity per cell were not the same during all cell trafficking imaging experiments, because the cells were not being expanded from a single clone of transduced T-cell hybridomas and TFR gene expression is only relatively stable. Therefore, we decided to relate the total light flux or maximum radiance from each paw to the total in vitro RLU, which equals the number of cells implanted in the paw times in vitro luciferase activity per cell. In this manner, one is able to derive linear equations from the correlation between total light flux or maximum radiance and total in vitro RLU. Also, these linear equations should be generally useful for all cells expressing the hRluc transgene as long as the hRluc activity of the cells does not vary significantly from the in vitro activity once the cells are inside mice. 2.8.Quantitative Cell Trafficking Imaging StudiesWithin 1 to 2 weeks after sorting, A2-TFR or AG6-TFR cells that had been grown in culture were harvested and counted in preparation for intravenous injection into CIA mice. Approximately 1 million cells were assayed for in vitro hRluc activity. Known quantities of the cells (A2-TFR: , , , , and ; AG6-TFR: , , , and ), resuspended in PBS, were injected into a lateral tail vein of CIA mice, within 1 week after the LPS boost. All of the mice (A2-TFR injected: ; AG6-TFR injected: ) were scanned with a bioluminescence imaging camera following injection of coelenterazine on days 1 and 3. AG6-TFR injected mice were also scanned on day 6. Before scanning, every paw of each mouse was scored for the degree of inflammation [0=no inflammation; 1=only fingers inflamed; 2=mild inflammation of the entire paw (ankle not swollen); 3=moderate inflammation of the entire paw with possible swollen ankle; 4=severe inflammation of the entire paw, including ankle]. CIA mice with various degrees of inflammation in their paws, which had either been injected with various quantities of A2 or AG6 cells or no cells, were also scanned to obtain average background total light flux and maximum radiance in paws with 0, 1, 2, 3, or 4 inflammation scores. ROIs were drawn over each of the paws and total photon flux and maximum radiance of the entire paw was measured. Net total light flux and maximum radiance were calculated by subtracting the average background measurements. The number of cells in each paw was calculated, using the equations derived through procedures in Sec. 2.7 (Table 1 ). Some of the A2-TFR and AG6-TFR injected CIA mice were scanned also by microPET as described in Sec. 2.6 for activity in the paws. Mice injected with control T-cell hybridomas (not expressing the TFR transgene) were also scanned by microPET to determine the background activity of in the paws with different inflammation scores. The objective of these preliminary microPET studies was to determine whether the average activity was significantly higher than the background in the inflamed paws of A2-TFR and AG6-TFR injected CIA mice. 3.Results3.1.Derivation of Linear Equations for Calculating the Number of Cells from Bioluminescence Images of Mice PawsEight different linear equations (Table 1) were derived to relate bioluminescence signal intensities from the paws of CIA mice to the total RLU (based on in vitro measurement), four for A2-TFR and four for AG6-TFR cells, because a different luminometer had been used during the trafficking analysis of each of these cells, as discussed in Sec. 2.4. For each cell line, two of the equations related total light flux to total RLU, and two of the equations related maximum radiance to total RLU. The same data were used to derive the equations for A2-TFR and AG6-TFR; hence the only difference between their equations is the slope of the lines. The difference in the slope of the lines is due to the fact that the total RLUs of AG6-TFR cells are 1444 times higher than A2-TFR, since different luminometers were used to measure in vitro hRluc activity per cell. The total light flux is the sum of all photons in every pixel of the image included in the ROI; whereas maximum radiance is the maximum photon intensity found in a pixel of the ROI. For example, if an equal number of cells traffic to each of two paws, in the paw where cells are more spread out, the maximum radiance may be lower than the other paw in which cells concentrate in specific locations of the paw; whereas the total light flux of both paws may be similar. The linear regression lines illustrating the correlation between total light flux and total RLU and maximum radiance and total RLU for A2-TFR cells are shown in Figs. 1a, 1b, 1c, 1d . As illustrated, for each parameter relationship, linear regressions were calculated for two ranges of total RLU. Figures 1a and 1c include the entire range of total RLU studied (1,598 to 318,005); whereas Figs. 1b and 1d include a shorter range of total RLU (1,598 to 15,983), respectively. Despite the fact that values are higher when the entire total RLU range is included, equations for the shorter range of total RLU were necessary, because when cells were injected intravenously, the signal intensities observed corresponded to the shorter range of total RLU. Therefore, for the remainder of the study, we only use the equations for the shorter range of total RLU to calculate the number of cells trafficking to the paws (Table 1). Statistical analysis indicates that the relationships expressed as linear equations between the total RLU and bioluminescence image signal intensities were significant (Table 1). Once total RLUs are calculated from image signal intensities, the number of cells in the paws can be estimated by dividing with the in vitro hRluc activity per cell. The range of in vitro hRluc activity was 0.23 to 1.73 RLU/cell for A2-TFR (as measured with the model 2020 luminometer), and 1980 to 2926 RLU/cell for AG6-TFR (as measured with model 2030-001). Fig. 1Relationship between net image signal intensity in the paws of mice injected with various known quantities of A2-TFR cells and the total RLU of A2-TFR cells. (a) and (b) relate total light flux to total RLU. (c) and (d) relate max radiance to total RLU. The range of total RLU in (a) and (c) is 1598 to 318,005, and in (b) and (d) is 1598 to 15,983. Data are averages of two measurements SEM.  We also wanted to address the effect of tissue depth on the signals emitted from the paws. In additional studies, we anesthetized three DBA1/J mice with a high dose of ketamine /xylazine and made sure they were deeply unconscious before injecting the same known quantities of AG6-TFR cells intra-articularly, as had been injected in the other mice subcutaneously. On average, the measured net light intensities after injecting cells deeper into the paws were not lower than the net light intensities from the paws injected the same number of cells subcutaneously. This may be due to the fact that even when cells are injected subcutaneously, some of them end up at the bottom of the paw and some at the top, such that the light emitted from some of the cells must still penetrate about of tissue and is highly attenuated. There was also a very high variation between measurements from the paws that were injected deeply. For example, the average total light flux from two paws injected with 10,000 cells was 154,865, but the standard error of the mean (SEM) was 102,003. More variations were expected because intra-articular injections are technically more challenging; thus the subcutaneous method may be the most reliable technically feasible method. 3.2.Quantitative Analysis of Antigen Specific T-Cell Hybridoma Trafficking to the Paws of Collagen-Induced Arthritic MiceDBA1/J mice had been induced and boosted with bovine collagen type II and then further boosted with LPS, resulting in the appearance of inflammation in at least one paw in 80 to 90% of the mice. Various numbers of A2-TFR or AG6-TFR cells were then injected through a lateral tail vein of each CIA mouse to study their trafficking to the paws by bioluminescence imaging. For quantitative analysis, we had determined the in vitro RLU/cell of the cells on the day of intravenous (IV) injection. Each mouse was then scanned for bioluminescence following coelenterazine injection, 1 and 3 (and also 6 days for AG6-TFR injected mice) days after IV injection of the cells to determine the amount of light emitted from the paws due to A2-TFR or AG6-TFR cells. To determine the amount of signal specifically due to the cells, we needed to subtract the background signal in the paws. The level of background varied slightly due to the degree of inflammation and whether it was the front or hind paw. Therefore, we measured coelenterazine signals in the paws of CIA mice, who had either been injected with control A2 or AG6 cells or not been injected with any cells, and averaged the measured total light flux or maximum radiance in the front or hind paws with the same inflammation scores [Figs. 2a and 2b ]. These average background signals were subtracted to determine the net total light flux or maximum radiance due to A2-TFR or AG6-TFR cells. Then the number of cells present in each paw was estimated from the total light flux and maximum radiance measurements in each paw, using the equations derived in Sec. 3.1 [Figs. 1b and 1d or Table 1]. Fig. 2Average background (a) total light flux and (b) max radiance in the hind and front paws of CIA with different inflammation scores.  Data presented in Figs. 3a and 3b illustrate the average number of A2-TFR cells estimated to be present in the paws with different degrees of inflammation on days 1 and 3 following intravenous injection of various numbers of these cells, based on the total light flux measurements in paw ROIs. Data presented in Figs. 3c and 3d illustrate estimates of the same based on maximum radiance measurements in paw ROIs. In general, the maximum radiance measurements and conversion formula yielded higher cell number estimates. As illustrated by data presented in Figs. 3a, 3b, 3c, 3d, injecting greater quantities of A2-TFR cells did not always result in a greater number of A2-TFR cells in the paws on days 1 and 3. Also, we cannot conclude based on the averages that a significantly greater number of A2-TFR cells consistently accumulated in the paws with higher inflammation scores on days 1 and 3. Although in some paws with higher degrees of inflammation, more A2-TFR cells accumulated on day 3 than on day 1 [Compare Fig. 3a and 3b and 3c and 3d]. Fig. 3Average number of A2-TFR cells accumulating in the paws (with different inflammation scores of CIA mice 1 (a) and (c) and 3 (b) and (d) days following injection of various quantities of A2-TFR cells intravenously. Averages in (a) and (b) were calculated based on total light flux, and (c) and (d) were calculated based on max radiance. Error bars are SEM.  Data presented in Figs. 4a, 4b, 4c , illustrate the average number of AG6-TFR cells estimated to be present in the paws with different degrees of inflammation on days 1, 3, and 6 following intravenous injection of various numbers of these cells, based on the total light flux measurements in paw ROIs. Data in Figs. 4d, 4e, 4f illustrate estimates of the same based on maximum radiance measurements in paw ROIs. Comparing the data in Figs. 3a, 3b, 3c, 3d with those in Figs. 4a, 4b, 4c, 4d, 4e, 4f, in general fewer number of cells were present in the paws of CIA mice, injected with AG6-TFR cells IV. Again, injection of more AG6-TFR cells did not result in increased accumulation of these cells into the paws on days 1, 3, and 6. Based on the averages, we also cannot conclude that paws with higher degrees of inflammation accumulate a greater number of AG6-TFR cells on days 1, 3, and 6. The one difference observed between the trafficking trends of A2-TFR and AG6-TFR cells was that on average, greater numbers of AG6-TFR cells do not appear to accumulate in the paws from day 1 to 3 and 6. Finally, the AG6-TFR cell estimates based on maximum radiance measurements have lower SEM than those based on total light flux. Fig. 4Average number of AG6-TFR cells accumulating in the paws (with different inflammation scores of CIA mice 1 (a) and (d), 3 (b) and (e), and 6 (c) and (f) days following injection of various quantities of A2-TFR cells intravenously. Averages in (a), (b), and (c) were calculated based on total light flux, and (d), (e), and (f) were calculated based on max radiance. Error bars are SEM. 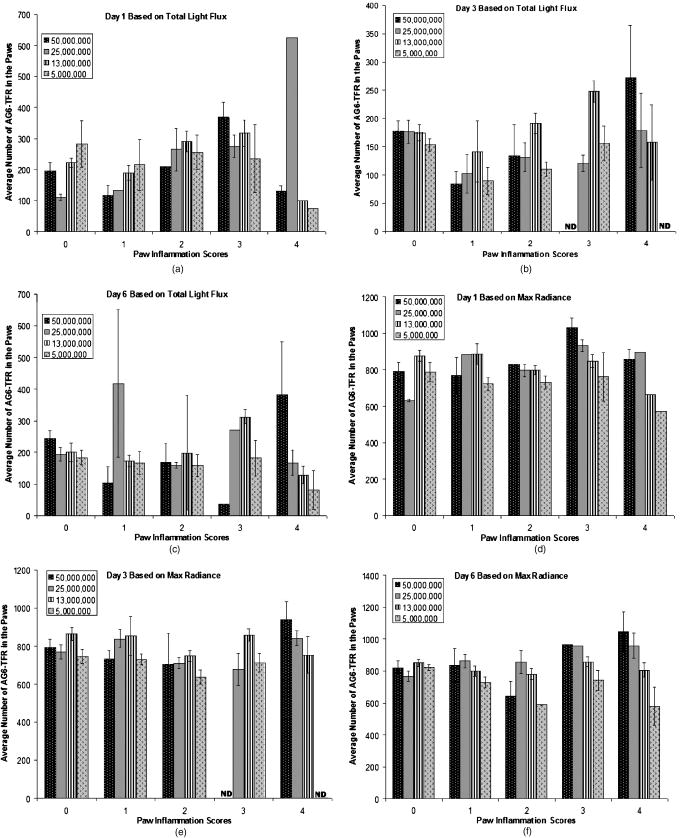 3.3.Micro-Positron Emission Tomography Imaging of Collagen-Induced Arthritic Mice after Intravenous Injection of A2 and AG6-Triple Fusion Reporter Gene TFR CellsSince A2 and AG6-TFR cells also express the HSV1-tsr39tk PRG, we also scanned the mice for activity, using a microPET, on various days following intravenous injection of the cells. Figure 5 illustrates microPET and bioluminescence (coelenterazine) imaging of a mouse injected with A2 cells as a control, and another mouse injected with the same number of A2-TFR cells, one day after intravenous injection. Above background activity as well as bioluminescent signal was observed in the inflamed paws of the A2-TFR injected mouse, whereas only background activities were observed from the inflamed paws of the A2 injected mouse. Based on the background subtracted total light flux measurements, 775 cells were present in the left front paw, 1015 cells were present in the right front paw, 1887 cells were present in the left hind paw, and 2626 cells were present in the right hind paw. PET has different sensitivity and background levels than bioluminescence. As a result, when very few cells accumulated, we were unable to detect above background activity in the paws of several mice, despite above background hRluc activity, and thus were unable to establish an accurate correlation between bioluminescence and microPET images. The level of activity was also higher in the thorax and leg joints of the A2-TFR mouse, even though bioluminescence signal (image threshold to background) at those sites was below background. This could be due to the presence of A2-TFR cells in the lungs and liver that are not detected by bioluminescence imaging, because of deep tissue attenuation, but can better be detected by the microPET. In fact, we have confirmed by ex-vivo biodistribution assays (measuring tissue hRluc activity ex vivo) that hRluc activity is above background in the lung, liver, spleen, and several lymph nodes, as well as inflamed paws of CIA mice (data not shown). Furthermore, when these mice were kept for about one month after AG6-TFR injections, some of the mice developed tumors in their livers, lungs, and inflamed paws. These tumors emitted saturating bioluminescence following coelenterazine injection and accumulated significant amounts of . Fig. 5MicroPET (top) and bioluminescence (bottom) images of a CIA mouse injected with A2 (left) and another mouse injected with A2-TFR (right) cells intravenously. Images were acquired one day following cell injections. For the A2-TFR mouse, the inflammation score of the left front paw was 0, the right front paw was 4, the left hind paw was 2, and the right hind paw was 4. For the A2 mouse, the inflammation score of the left hind paw was 2, the right hind paw was 2, the right front paw was 4, and the left front paw was 2. 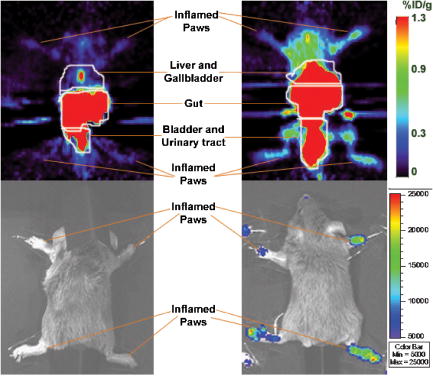 Table 1Linear equations for the estimation of cell numbers in the paws of CIA mice from bioluminescence images.
4.DiscussionsImaging of adoptively transferred cells in living research animals allows monitoring of their trafficking in the same animal at multiple time points, thus providing more complete information about the cell kinetics. However, quantifying the number of cells in different tissues, especially the target tissue, based on the images at each imaging time point allows better analysis of imaging data from all studies combined. This helps in understanding the cell trafficking trends and avoids arriving at false conclusions based on subjective observations of a few images. Quantification of PET RG labeled cells based on region of interest analysis on PET images has been described.19 However, cell number quantification based on bioluminescence images of mice has not been reported yet, and is complicated by several factors. First, the intensity of optical signal is affected by the depth of tissue from which the light emanates. The second factor is differential background signal from some sites, such as the abdominal area. In this study, we took advantage of the fact that inflamed joints are in extremities and tissue depth is minimal. Meanwhile, we realized that inflammation could affect the background coelenterazine signal. Therefore, we first determined the average background signal from paws with different degrees of inflammation. Second, we determined the average signal in the paws with different degrees of inflammation after injecting various known quantities of TFR-transduced T-cell hybridomas. However, since the level of TFR expression per cell varies from time to time, we related the paw signals to the number of cells multiplied by the in vitro bioluminescence activity per cell. For example, the hrLuc activity of A2-TFR cells at different study times varied from 0.23 to 1.73 RLU/cell. This in vitro cell activity was measured just prior to injection of the cells into the mice, and was the best measure of cell activity we could technically obtain. The equations we have derived in this study are estimates, and errors can arise due to several factors. 1. Variations in the attenuation of light emanating from each cell in the paws can affect the actual total light flux or maximum radiance, resulting in either overestimation or underestimation of light signal from cells trafficking to the joints. To obtain the equations relating total light flux or maximum radiance to the number of cells, various numbers of cells were injected subcutaneously into the tops of the paws in 80- volumes. When cells were injected in this manner, they went under the skin around the joints, muscles, and bones of the paws. When the mice were imaged post-injection, the orientation of the paws were varied; thus lights from cells located in different regions of the paws were attenuated by various degrees. For example, when the top of the paw was facing the camera, the light from the cells in the top region was less attenuated, as their light only needs to pass the skin, whereas light from the cells at the bottom is attenuated more, as their light will pass through some denser tissue (bone), muscle, or cartilage in addition to skin. This variation in attenuation should help make the averages closer to what happens when cells traffic to the paws through blood vessels. 2. Reporter gene expression of the cells may vary from the in vitro measurement at different time points after injection of the cells into mice. Our experience with cultured A2-TFR and AG6-TFR cells is that TFR expression would decrease over time in culture. If hRluc expression per cell declines on days 1, 3, or 6 after injection, then our equations would underestimate the number of cells in the paws. However, the hRluc expression may also increase once the cells are injected into mice. We observed in culture that administration of phorbol 12–myristate 13–acetate (PMA)/ionomycin increased hRluc activity by several fold. An increase in hRluc activity per cell once they interact with their specific collagen-derived peptide in vivo would result in an overestimation of the number of cells in the paws. 3. A portion of cells injected may die after injection through the syringe needle. Although this would affect the accuracy of the equations, the same would likely be true of cells injected intravenously. Furthermore, we tested the effect on cells after passage through even a 30-gauge needle and observed that approximately 90% of cells were still alive after passage through the needle. 4. Some of the cells injected subcutaneously may migrate out of the paws, and the signal observed may be due to fewer cells than actually injected. To avoid this, the cells were injected using Matrigel to keep them at the site of injection. Furthermore, post-injection imaging was done as soon as possible (approximately ) after cell injection. In fact, even with Matrigel some of the cells flowed out of the paws, because we observed that when the mice were imaged 1 or later, the signal intensities were 8- or 17-fold less, respectively. Another reason for imaging mice immediately following cell injections is that T-cell hybridomas are proliferating cells. 5. The presence of Matrigel may also have an attenuation effect, which would lead to the underestimation of cell numbers. However, that affects absolute cell number quantification and not relative cell number estimation. It has been suggested that the bioluminescence signal in the paws may not be due to T-cell hybridomas in the paws, but instead due to the released TFR protein in circulation. First, previous studies from our laboratory have demonstrated the presence of A2 cells within the inflamed paw joints, through RT-PCR analysis for the yellow fluorescent protein (YFP) transgene transduced into those cells.9, 10 Second, released TFR in circulation would also be detected from other less furry sites of the mouse body, such as the ear and more consistently in every paw. Third, above background signal, observed in the inflamed paws with high bioluminescence signals, requires the presence of viable cells, since once phosphorylated by the HSV1-sr39TK enzyme, it gets trapped within the cells. Finally, we observed tumor formation in an inflamed paw of a mouse that had been alive for 30 days after T-cell hybridoma injection. Above background bioluminescence signal had been observed in this paw on days 1, 3, and 6, and the tumor had a high bioluminescence signal and activity. This evidence indicates presence of T-cell hybridomas within the paws. A final confirmation of T-cell hybridoma presence can be obtained by histology in future studies. Quantitative analysis of bioluminescent reporter gene imaging is complicated by several factors. 1. Varying tissue depths can significantly affect the amount of light emanating from the mouse. In this respect, mice paws may be relatively more suitable for quantification than other tissues, because of their approximate depth. We still expect significant attenuation of light emanating from cells inside the joints, due to muscles, bones, and cartilage, which would cause an underestimation. However, as discussed before, light from some of the cells injected subcutaneously that are pushed to the bottom of the paw is also subject to bone, muscle, and collagen attenuation. Finally, inflammation increases the size of the paws and introduces more red blood cells into the paws, which may increase attenuation. 2. Substrate delivery affects the image signal. This is actually a significant problem from using coelenterazine, because the amount one can inject is not saturating and coelenterazine has flash kinetics. For this reason, we increased the injected dose to , though this is still not a saturating dose. From a technical standpoint, how well an investigator injects coelenterazine into the tail vein of mice can significantly affect substrate delivery. Furthermore, an investigator must keep the time between injection and imaging constant. Both of these technical factors may explain some of the variability we observed in our data. Finally, inflammation may affect substrate delivery and oxidation. Hence, we reasoned that it was necessary to measure average backgrounds for paws with different inflammation scores separately. Future quantification studies may employ newer analogs of coelenterazine, such as Endurin (Promega)20 or use firefly luciferase (Fluc) and D-luciferin as bioluminescent reporter genes and probes. In this study, we did the quantitative analysis with hRluc, because the TFR construct had the highest level of HSV1-sr39tk expression, increasing the chances of detecting the cells with PET. Furthermore, Endurin was not tested and available at the time of our study. Endurin is a more stable substrate that will not be oxidized in the blood and can be injected intraperitoneally. D-luciferin is administered at a saturating dose ( per mouse) also intraperitoneally. Both of these substrates do not have flash kinetics. However, new linear equations must be derived for other substrates or bioluminescent reporter genes. The linear equations derived in this study were used to answer the three questions proposed in the introduction, following intravenous administration of two different collagen-specific T-cell hybridoma clones. Using the linear equations listed in Table 1, we were able to estimate the number of cells in all of the paws of each mouse that had been injected with various quantities of A2-TFR and AG6-TFR cells intravenously. For reasons previously stated, these numbers may not reflect the actual number of cells. Nevertheless, they allow relative comparison of cell number accumulation in the paws on different days of imaging experiments and with varying inputs. A concern with reporter gene imaging studies is the possibility of decreased or even increased reporter gene expression per cell once they have been trafficking in mice for certain durations. This may affect the accuracy of quantification, leading to either underestimation or overestimation of the absolute cell number, without affecting relative analysis. Unlike syngeneic primary T cells, T-cell hybridomas are usually rejected by recipient mice. In rare cases when the cells persisted as tumor, we have observed hRluc and HSV1-sr39tk expression for at least 30 days, indicating low likelihood of reporter gene shutdown. Overall, based on the average cell numbers in the paws, we could not conclude that either AG6-TFR or A2-TFR cells consistently accumulate in greater numbers in the paws with higher inflammation scores. Furthermore, in the range of 5 to A2-TFR and AG6-TFR cells, injecting more cells does not necessarily result in a greater number of cells accumulating in the paws. In general, fewer AG6-TFR cells than A2-TFR cells accumulated in the paws of CIA mice and, whereas A2-TFR accumulation seemed to rise from day 1 to 3, the same was not observed with AG6-TFR cells. Using a triple fusion construct also allowed us to detect TFR-expressing hybridomas in at least some mice with microPET. An advantage of microPET imaging in RA mouse models is that the paws are among the lowest background tissues for accumulation [on average less than 0.1% injected dose (ID) total activity per paw]. The inflammation increased the average background accumulation in score 4 paws to up to 0.18 % ID per paw. Additional PET reporter gene trafficking imaging studies are needed to initiate long-term clinical therapeutic cell trafficking studies in RA patients. The linear equations derived from this study can be used to analyze the trafficking of other cells expressing the hRluc transgene to the paws of CIA mice, because they take into account different levels of hRluc gene expression. The same procedures can be used to derive linear equations for determining the quantity of cells expressing other bioluminescent reporter genes, such as Fluc, in the paws of CIA mice. New linear equations will also be needed for quantitative bioluminescent reporter gene imaging studies in other RA mouse models, especially if they have different skin pigmentation. Finally, these approaches can possibly be extended to estimate cell quantities in other organs, if cells can be consistently injected into the same sites of the organ. AcknowledgmentThe authors acknowledge funding sources from a RSNA Postdoctoral Fellowship in Basic Radiological Sciences (Yaghoubi); and NIH grants NCI ICMIC P50 CA114747, SAIRP R24 CA92865, P50 CA86306, and R01 CA82214-01 (Gambhir); and R33 AI55468-03, 2 PO1 AI 36535-09 (Fathman). We appreciate assistance provided by Cariel B. Taylor, Neil Lineberry, Manish Patel, Joerg Ermann, Bill Robinson, Tim Doyle, and Shay Karen. ReferencesM. H. Weisman,
“What are the risks of biologic therapy in rheumatoid arthritis? An update on safety,”
J. Rheumatol., Suppl., 65 33
–38
(2002). 0380-0903 Google Scholar
R. Singh,
D. B. Robinson, and
H. S. El-Gabalawy,
“Emerging biologic therapies in rheumatoid arthritis: cell targets and cytokines,”
Curr. Opin. Rheumatol., 17 274
–279
(2005). 1040-8711 Google Scholar
I. H. Tarner and
C. G. Fathman,
“The potential for gene therapy in the treatment of autoimmune disease,”
Clin. Immunol., 104 204
–216
(2002). Google Scholar
P. D. Robbins,
C. H. Evans, and
Y. Chernjovsky,
“Gene therapy for arthritis,”
Gene Ther., 10 902
–911
(2003). 0969-7128 Google Scholar
M. C. Boissier and
N. Bessis,
“Therapeutic gene transfer for rheumatoid arthritis,”
Reumatismo, 56-N 51
–61
(2004). 0048-7449 Google Scholar
Z. Liu,
X. Xu,
H. Hsu,
A. Tousson,
P. Yang,
Q. Wu,
C. Liu,
S. Yu,
H. Zhang, and
J. D. Mountz,
“CII-DC-AdTRAIL cell gene therapy inhibits infiltration of CII-reactive T cells and CII-induced arthritis,”
J. Clin. Invest., 112 1332
–1341
(2003). 0021-9738 Google Scholar
S. H. Kim,
S. Kim,
C. H. Evans,
S. C. Ghivizzani,
T. Oligino, and
P. D. Robbins,
“Effective treatment of established murine collagen-induced arthritis by systemic administration of dendritic cells genetically modified to express IL-4,”
J. Immunol., 166 3499
–3505
(2001). 0022-1767 Google Scholar
Y. Morita,
J. Yang,
R. Gupta,
K. Shimizu,
E. A. Shelden,
J. Endres,
J. J. Mule,
K. T. McDonagh, and
D. A. Fox,
“Dendritic cells genetically engineered to express IL-4 inhibit murine collagen-induced arthritis,”
J. Clin. Invest., 107 1275
–1284
(2001). 0021-9738 Google Scholar
A. Nakajima,
C. M. Seroogy,
M. R. Sandora,
I. H. Tarner,
G. L. Costa,
C. Taylor-Edwards,
M. H. Bachmann,
C. Contag, and
C. G. Fathman,
“Antigen-specific T-cell-mediated gene therapy in collagen-induced arthritis,”
J. Clin. Invest., 107 1293
–1301
(2001). 0021-9738 Google Scholar
I. H. Tarner,
A. Nakajima,
C. M. Seroogy,
J. Ermann,
A. Levicnik,
C. Contag, and
C. G. Fathman,
“Retroviral gene therapy of collagen-induced arthritis by local delivery of IL-4,”
Clin. Immunol., 105 304
–314
(2002). Google Scholar
R. Smith,
I. H. Tarner,
M. Hollenhorst,
C. Lin,
A. Levicnik,
C. G. Fathman, and
G. P. Nolan,
“Localized expression of an anti-TNF single-chain antibody prevents development of collagen-induced arthritis,”
Gene Ther., 10 1248
–1257
(2003). 0969-7128 Google Scholar
R. G. Blasberg,
“In vivo molecular-genetic imaging: multimodality nuclear and optical combinations,”
Nucl. Med. Biol., 30 879
–888
(2003). https://doi.org/10.1016/S0969-8051(03)00115-X 0969-8051 Google Scholar
P. Ray,
A. M. Wu, and
S. S. Gambhir,
“Optical bioluminescence and positron emission tomography imaging of a novel fusion reporter gene in tumor xenografts of living mice,”
Cancer Res., 63 1160
–1165
(2003). 0008-5472 Google Scholar
P. Ray,
A. De,
J. Min,
R. Y. Tsien, and
S. S. Gambhir,
“Imaging tri-fusion multimodality reporter gene expression in living subjects,”
Cancer Res., 64 1323
–1330
(2004). https://doi.org/10.1158/0008-5472.CAN-03-1816 0008-5472 Google Scholar
K. Breckpot,
M. Dullaers,
A. Bonehill,
S. Van Meirvenne,
C. Heirman,
C. De Greef,
P. Van Der Bruggen, and
K. Thielemans,
“Lentivirally transduced dendritic cells as a tool for cancer immunotherapy,”
J. Gene Med., 5 654
–667
(2003). Google Scholar
G. E. Osman,
S. Cheunsuk,
S. E. Allen,
E. Chi,
H. D. Liggitt,
L. E. Hood, and
W. C. Ladiges,
“Expression of a type II collagen-specific TCR transgene accelerates the onset of arthritis in mice,”
Int. Immunol., 10 1613
–1622
(1998). 0953-8178 Google Scholar
S. S. Yaghoubi,
J. R. Barrio,
M. Dahlbom,
M. Iyer,
M. Namavari,
N. Satyamurthy,
R. Goldman,
H. R. Herschman,
M. E. Phelps, and
S. S. Gambhir,
“Human pharmacokinetic and dosimetry studies of : A reporter probe for imaging herpes simplex virus type-1 thymidine kinase reporter gene expression,”
J. Nucl. Med., 42 1225
–1234
(2001). 0161-5505 Google Scholar
A. M. Loening and
S. S. Gambhir,
“AMIDE: a free software tool for multimodality medical image analysis,”
Mol. Imaging, 2 131
–137
(2003). https://doi.org/10.1162/153535003322556877 1535-3508 Google Scholar
H. Su,
A. Forbes,
S. S. Gambhir, and
J. Braun,
“Quantitation of cell number by a positron emission tomography reporter gene strategy,”
Mol. Imag. Biol., 6 139
–148
(2004). Google Scholar
M. Otto-Duessel,
V. Khankaldyyan,
I. Gonzalez-Gomez,
M. C. Jensen,
W. E. Laug, and
M. Rosol,
“In vivo testing of Renilla Luciferase substrate analogs in an orthotopic murine model of human glioblastoma,”
Mol. Imaging, 5 57
–64
(2006). 1535-3508 Google Scholar
|
|||||||||||||||||||||||||||||||||||||||||||||||||||||||


