
|
|
1.IntroductionIn recent years, laser therapeutic applications have increasingly moved toward less-invasive techniques. Utilizing selective absorption of tissue,1 modern laser therapeutic applications aim to selectively target a specific tissue. Avoiding collateral damage to neighboring tissue structures becomes especially interesting in organs where the targeted tissue is in close proximity to a neural tissue. To ensure selective damage to the target, monitoring of the treatment outcome and understanding of the damage mechanism become crucial. Laser treatment of retinal diseases of the eye is an important example, where collateral thermal damage due to nonselective laser exposure adversely affects the visual acuity of the patient. In this paper, we describe a method that potentially can allow monitoring the irradiation success during selective laser targeting of retinal pigment epithelium (RPE) cells in the retina. The retina is a visual organ of about in thickness and is located in the back of the eye. The RPE is a monolayer of cells that is interposed between the sensory retina and the choroid.2 A single RPE cell measures about in diameter, and its nucleus is shielded by 150 to 300 melanin granules. The RPE absorbs, due to its high melanosome content, about 50 to 60% of incident green light, as opposed to 7 to 10% absorbed in the neural retina.3 The RPE supplies the photoreceptors with nutrients from the choroid by active transport. Likewise, metabolic end-products from the photoreceptors are removed or digested by the RPE. The functionality of the RPE slows with age or a systemic disease (such as diabetes).4 Retinal laser photocoagulation, one of the most widely used laser procedures in medicine and the established modality for the treatment of a variety of retinal disorders, can prevent or slow vision loss in many patients. However, since the pulse duration of the photocoagulator is longer than the thermal relaxation time of RPE ( few ), heat diffuses away from the absorbing RPE layer. A zone of coagulation that extends through the full thickness of the retina is produced, resulting in a permanent blind region in the laser-irradiated area (laser scotoma).5 Treatment near the fovea is especially dangerous since it can cause foveal burn and permanent loss of central vision. Recent evidence demonstrates that selective targeting of the RPE layer that avoids collateral damage to the photoreceptors is the appropriate treatment modality for diseases originating from dysfunction of the RPE, such as drusen in age-related macular degeneration (AMD), diabetic macular edema (DME), or central serous retinopathy (CSR).6, 7, 8 Since the first demonstration of selective RPE targeting (SRT) in rabbits,9 many preclinical and clinical studies have shown that SRT is an attractive method for treatment of retinal disorders that are associated with dysfunctional RPE. 6, 7, 8, 9, 10, 11, 12, 13, 14 SRT is based on the hypothesis that:
To minimize heat diffusion from the RPE and to achieve selectivity, it is necessary to employ pulses with durations on the order of the RPE’s thermal relaxation time. Short exposure times can also be realized by rapidly scanning a continuous-wave (cw) laser beam across the target tissue; while pulsed SRT is currently undergoing clinical trials, the scanning approach is under development. Scanning selective targeting was demonstrated ex vivo by Brinkmann using a multimode fiber coupled argon laser.15 We have demonstrated using a slit lamp adapted laser scanner that SRT can also be achieved in vivo in rabbits by scanning the spot (diameter of about one RPE cell) of a cw laser across the retina so as to produce microsecond-short exposure at each targeted RPE cell.16, 17 However, accurate dosimetry in a clinical setting will be complicated partly because the absorption coefficient of ocular melanosomes is not well described; available values in the literature 18, 19, 20, 21, 22 vary from about to . Furthermore, the number of absorbing melanosomes per RPE cell differs among individuals and is not necessarily uniformly distributed within an individual eye. Thus, a single threshold value (in ) that equally applies to all individuals and to all locations within one eye cannot be found.23 Consequently, dosimetry becomes a crucial step that is required to avoid irreversible damage to the photoreceptors. Currently, treatment outcome in SRT is assessed after irradiation by fluorescein angiography (FLA), where a fluorescent dye pools into the ocular space in areas with laser-induced RPE damage. This is necessary because the selective RPE damage is not visible by ophthalmoscopic examination. 6, 7, 8, 9, 10, 11, 12, 13, 14, 15, 16, 17 Thus, no feedback is available during irradiation. In this study, we investigate the possibility for an alternative feedback method that will allow monitoring of the treatment outcome (i.e., selective RPE cell damage) during the irradiation. In order to detect cell death during treatment, it is necessary to understand the mechanism underlying the cell damage by microsecond pulses. Two distinct cell damage mechanisms have been proposed for the cause of RPE cell death: thermal denaturation and intracellular cavitation. Upon irradiation, the laser light is absorbed by melanosomes that are contained within the RPE, near the anterior portion of the cell. As described by the Arrhenius rate integral, an RPE cell can be killed thermally when it is exposed to a temperature higher than body temperature for a certain time. This thermal rate process is the predominant cell damage mechanism for millisecond pulses.24, 25, 26 For exposures on the order of the thermal relaxation time, the laser-induced temperature around the melanosomes is much higher than in any other retinal layer because of their strong absorption in the visible spectrum.21, 22 This localized heating can induce rapid vaporization of a thin layer of cytoplasm in contact with the melanosomes, raising the vapor pressure high enough to overcome the surface tension of the fluid and creating an intracellular cavitation bubble around each granule. 21, 22, 27, 28, 29 The mechanical stress associated with the rapid expansion and subsequent collapse of these bubbles can induce damage to the membrane or intracellular organelles of the RPE cell (intracellular cavitation-induced cell damage).30 Previous studies have suggested that the transition from cavitation-induced to thermal damage is expected to take place somewhere within the microsecond regime.31, 32 It was shown that RPE cell death coincides with bubble formation for 3-, 5-, and pulses,31, 32 while RPE cells were damaged without cavitation formation for pulses.32 However, these reports did not examine pulse durations between 5 and , a critical parameter range for scanning selective targeting of the RPE. In order to be able to utilize cavitation formation as an immediate feedback mechanism, our study is designed to closely examine the dependence of RPE cell death mechanism on pulse duration, in the clinically relevant microsecond range ( to ). We hypothesize that optical monitoring of the formation of intracellular cavitation can be a valuable tool for dosimetry in individual irradiation spots, if RPE cells are damaged due to cavitation formation. The beam diameter on the RPE was adjusted to about the size of a single RPE cell so that the cavitation signal could be correlated with individual cell death. During the laser pulse, the variation of the backscattered irradiation light from the target was monitored, and intracellular cavitation was detected as a transient increase in backscattering of the treatment beam. The threshold radiant exposures for cell death and cavitation were compared for different pulse durations. The percentage of cell death associated with cavitation was measured as a function of pulse duration and radiant exposure. We discuss the potential for real-time monitoring of treatment outcome during SRT based on the monitoring of backscattered light of the treatment laser beam. 2.Materials and Methods2.1.Experimental SetupAn irradiation system was set up to monitor light backscattered during the irradiation of RPE cells. The schematic diagram of the experimental setup is shown in Fig. 1 . A cw laser running at a power of ( ; VERDI, Coherent, Santa Clara, California) with linear polarization served as a laser source for the irradiation. In order to produce pulses with various durations ( to ), the cw laser output was gated using an acousto-optic modulator (AOM; AOMO 3080-120, Crystal Technology, Palo Alto, California), which was controlled by a function generator. The radiant power was controlled by adjusting the RF level of the AOM. An acousto-optic deflector (AOD; 2DS-100-35-.532, Brimrose, Baltimore, Maryland) was employed to scan the gated laser pulses to discrete locations along a line scan. For the current study, the AOD and AOM were modulated to create seven stationary spots in each scan line. The collection efficiency of the backscattered photons is limited by the numerical aperture (NA) of the focusing lens. The NA of the lens is determined by the active aperture of the AOD , which constrains the maximum collimated beam diameter, combined with the long working distance of the focusing best-form lens. The long working distance was implemented to simulate the conditions of our slit-lamp adapted laser scanner. In order to increase the NA for backscattering light (from 0.02 to 0.06), a telecentric beam expander was inserted between the AOD and the focusing lens. The diameter of the irradiation beam at the focus was determined to be using a slit scanning beam profiler (Beam Scan 1080, Photon, Inc., San Jose, California). The incident-forward and the backscattered propagation were separated by utilizing the principle of an optical isolator, consisting of a polarizer and a Faraday rotator (FR). By placing a polarizing beamsplitter (pBS) cube and an FR in the optical path between the AOM and the AOD, the polarization of the incident beam was rotated by . The returning signal (backscattered light) going back through the FR was rotated by an additional (the returning light is at to the incident polarization), enabling it to be deflected by the beam splitter cube. The deflected beam was focused by a focal length lens through a pinhole for confocal detection. The ratio of focusing lens of the scanner versus focusing lens of detector is 2.5. The pinhole, therefore, is about twice the diameter of the beam propagating through it. Confocal detection was needed in order to reject the signals from interfaces other than the RPE surface. A 10-MHz-bandwidth avalanche photodiode (APD; C5460, detector , Hamamatsu, Hamamatsu City, Japan) was placed directly behind the pinhole. The APD signal was sampled with a data acquisition card (Compuscope 1250, Gage Applied, Lachine, Quebec, Canada) interfaced to a PC. Fig. 1Schematic diagram of the experimental setup. The cw laser was modulated using an acousto-optic modulator (AOM) and scanned with 2-D–acousto–optic deflector (2D-AOD). A post-scanning telecentric beam expander was inserted to increase collection efficiency. Backscattered light was detected confocally with a 10-MHz avalanche photodiode (APD). Fluorescence images were taken using a custom-built compound fluorescence microscope that was built vertically on top of the sample stage. Two LEDs were used for fluorescence and reflectance illumination .  For aiming and navigation on the sample, a compound microscope ( , infinity corrected) was erected on top of the sample stage. The microscope was set up such that the focal plane of the scanner coincided with the object plane of the microscope. To illuminate the sample, a red light emitting diode (LED) was used to obtain a reflectance image. A blue LED at a wavelength of and a long-pass filter were incorporated into the microscope to excite calcein fluorescence that was used to assay viability of the RPE cells before and after the treatment. Images were captured using a CCD and a framegrabber-equipped PC. 2.2.Sample PreparationThe RPE explants were prepared from fresh, young bovine eyes. During transport, the eyes were kept in a cooled solution that provides nutrients to the eye in order to avoid premature weakening of the RPE cells over time. The solution consisted of 1:1 Dulbecco’s phosphate buffered saline (PBS) enriched with cell culture medium RPMI 1640, 20% fetal bovine serum, 5% glutamine, and 1% penicillin-streptomycin. Thus, RPE cells remained viable for about after enucleation. Upon arrival, eyes were cut equatorially, and the anterior part and vitreous humor were removed. One sample of roughly 15-mm diam was prepared from the posterior segment of each eye. The neural retinal layer was carefully peeled off to expose the RPE. The RPE explants were incubated for in calcein-acetoxymethyl (calcein-AM; Molecular Probes, Eugene, Oregon) (3 to ) to stain viable cells. Calcein-AM is a nonfluorescent and nonpolar dye that can diffuse through the cell membrane into the cell plasma, where the AM-group is hydrolyzed by esterase. The resulting derivate calcein is fluorescent (excitation , emission ). Because calcein without the AM-group is polar, it is trapped within the cell, and fluorescence accumulates with incubation time. Thus, viable cells appear bright in fluorescence microscopy. Dead cells appear dark in fluorescence images, as the calcein leaks through the compromised cell membrane. For the experiments, samples were placed in a Petri dish filled with PBS. The dish was closed with a microscope cover glass. Irradiations typically began and were completed 4 to after enucleation. 2.3.Evaluation of Cell Viability and Cavitation FormationIrradiation was performed by scanning the chopped cw laser spot to seven discrete locations in a single line. Individual lesions were separated by about within the line. The sample was translated to target the tissue area for the application of the next line. The lines were separated by . The laser pulse duration was varied from to . For all pulse durations, the radiant exposure was varied in order to determine the for cell death and cavitation. A total of over 3900 cells (at least 574 cells for each exposure duration) were tested on 5 samples from different eyes. Fluorescence images were taken immediately before and after irradiation using the compound fluorescence microscope integrated in our setup. RPE cells that remained viable appeared fluorescent, while cells that lost viability were identified by loss of calcein fluorescence. The backscattering signal was recorded for every pulse applied. The signals were evaluated for cavitation formation based on examination of the raw traces. In addition, the maximum derivative of the raw trace aided the evaluation process. That is, the steepest slope measured during any single backscattering trace can guide the assessment by providing a measurable number. Cell viability was assessed based on the fluorescence images by individuals who had no knowledge of the backscattering signal traces. Likewise, the signal traces were interpreted as bubble/no bubble by a person who had no knowledge of the state of the corresponding cell after irradiation. For every pulse applied, the viability and cavitation assessments were matched and compared. The results of the respective counts were used to plot the probability of finding cell death and cavitation as a function of radiant exposure for the various exposure times. Furthermore, Probit analysis33, 34 was utilized to statistically determine the effective dose 50% for cell death (termed ) and the effective dose 50% for cavitation (termed ) for each exposure time. describes a radiant exposure that is required to damage 50% of irradiated cells. Likewise, defines a radiant exposure that induces cavitation in 50% of irradiated cells. For Probit analysis, the quantal response data were set equal to ‘1’ for every individual dead cell or cavitation event and equal to ‘0’ for every surviving cell or absence of cavitation, respectively. Beyond statistical determination of the 50% probability points for cell death and cavitation, we also evaluated the percentage of dead cells that underwent bubble formation and the percentage of cavitation events that did not result in cell death. 2.4.Temperature CalculationsThe temperature profile around a single melanosome was calculated using the model describing the heat distribution of a uniformly heated spherical particle that was developed by Goldenberg and Tranter.35 This model is widely used to determine the temperature distribution around laser-heated particles. Brinkmann and Neumann adapted this model for comprehensive temperature calculations in RPE cells.21, 22 For our calculations, the melanosome was assumed to be a spherical particle of diameter immersed in water. The particle was considered centered on our Gaussian irradiance profile (waste radius ), since the highest temperature is achieved in that location. As a source term, we considered the fraction of the cavitation threshold power that is incident on and absorbed by a particle of radius at the cavitation threshold: Here, the term in the first bracket is the fraction of the power of a Gaussian irradiance profile that intersects with a particle of radius . The term in the second bracket is the fraction absorbed by a spherical particle, as described in detail by Gerstman, 29 where is the melanosome absorption coefficient .21 Literature values for the thermal properties of melanosomes and water36, 37 were used for the calculations.2.5.Scattering CalculationsTo determine the smallest bubble size that can be detected with our system, we calculated the percentage of incident laser power that is backscattered into the system. The resulting detector voltage was estimated and used to determine the signal-to-noise ratio (SNR). 2.5.1.Scattering phase function for microcavitation bubblesThe scattering phase function for a growing cavitation was calculated to determine the fraction of an incident laser beam that is backscattered at the target tissue. The angular scattering phase function is described by Mie theory38 as whereare the associated Legendre functions, and and are the coefficients of the Mie series that depend on the wavelength , the size of the scattering body, and the relative refractive index . In the simulations, the following optical properties of the growing, nonabsorbing cavitation were used: , , and the diameter of the bubble was varied from to . To estimate the fraction of incident light that is backscattered within the field of view of our detector , we considered the ratio of [backscattering of within the NA] and [total scattering of into all angles]: where is the scattering efficiency, defined as the ratio of the scattering cross section to the geometric cross section.39 As the photon source, we again considered the fraction of power that is incident on a growing bubble that is centered on our Gaussian irradiance profile.2.5.2.Detector voltage as result from backscatteringTo determine the detector voltage due to backscattering, we used the measured cavitation power . To account for power losses in our setup, the transmission efficiency was measured through the confocal pinhole with a mirror placed in the sample plane. Last, the photoelectric sensitivity of our APD at was considered. Thus, the voltage resulting from cavitation-induced backscattering is 3.ResultsRPE explants were irradiated ex vivo using laser pulses at different pulse durations (1, 5, 10, 20, and ). In order to detect intracellular cavitation, the backscattering of the treatment laser was monitored using an APD. A typical backscattering signal with cavitation is shown in Fig. 2 together with fluorescence images of RPE cells before and after the laser pulse. Fluorescent, hexagonal RPE cells are clearly visible, indicating that all cells are viable prior to irradiation. After the laser pulse, the targeted cell turns dark, suggesting that it was killed by the pulse. In the trace of backscattered light, a baseline signal represents no pulse. The rectangular pedestal wave form was produced as the irradiation pulse is turned on. The spike occurring on top of the pedestal at the end of the pulse represents the increased reflectance at the vapor-liquid interface of the cavitation bubble. Fig. 2Fluorescence images and backscattering signal from calcein-stained bovine RPE irradiated with a pulse, , ( above ). Irradiation was performed approximately after enucleation of the eye. Hexagonal RPE cells are clearly visible and the cells are fluorescent, indicating that all cells are viable prior to irradiation (left). after the irradiation, the cell in the middle of the right image turns dark, suggesting that the cell was killed by the pulse. In the signal trace ( axis ; axis ), the spike occurring near the end of the pulse represents increased backscattering due to formation of a cavitation.  Figures 3 and 4 compare the fluorescence images after irradiation with 1- and pulses and their corresponding backscattering traces. Cavitation events are characterized by rapid, transient increase of the backscattering signals. At the cell damage threshold , the cavitation usually formed toward the end of the pulse, while the onset of cavitation occurred earlier with higher radiant exposure. All dead cells are associated with cavitation for pulse duration. Two cells survived the formation of cavitation, indicated by asterisks in Fig. 3. For pulses of duration, two cells were killed without cavitation near ; those cells are indicated by crosses in Fig. 4. With higher radiant exposure, cavitation was detected earlier in the pulse for almost all dead cells, and multiple dead cells were observed from a single laser spot. Fig. 3Fluorescence images after pulse irradiation with corresponding backscattering traces ( axis ; axis ). Samples were irradiated with seven discrete laser spots along a scan line. The beam was stationary during the irradiation. ‘*’ indicates a cavitation signal without cell death. In (a) , cells in positions 2, 3, and 4 are damaged, as indicated by a lack of fluorescence, and bubbles have been detected. Cells in positions 5, 6, and 7 survived the irradiation, and no bubbles have been detected. The cell in position 1 also has survived the irradiation, but a bubble has been detected. In panel (b) , all signal traces show bubble formation, and only the cell in position 7 survived.  Fig. 4Fluorescence images after pulse irradiation with corresponding backscattering traces ( axis ; axis ). Samples were irradiated with seven discrete laser spots along a scan line. The beam was stationary during the irradiation. ‘ ’ indicates cell death without a cavitation signal. In (a) , cavitation was detected at the end of the pulse in two cells, although four cells have died. In (b) , cavitation occurred significantly earlier during the exposure in all cells. Multiple dead cells are found in each spot location.  Judging the signal traces as positive or negative (as to whether there was a spike) was clear in the vast majority of irradiations (about 99% of all irradiated cells) by examination of the raw traces (Figs. 3 and 4). In addition, we differentiated the raw traces with respect to time in order to evaluate the steepest transient during the application of the pulse (in units of ). Plotting the maximum slope values versus radiant exposure, we observed for all pulse durations that slopes from traces without a clear spike are well-separated from traces of cavitation events. Figure 5 shows the typical distribution of slope maxima for 5- and pulses. Cavitation-induced spikes have slopes up to two orders of magnitude higher than slope maxima introduced by background noise (i.e., no cavitation). More than 99% of cavitation-induced spikes are three times higher than average noise. Thus, we observed that a threshold could be used to guide assessment of those few backscattering cases that were difficult to judge because the cavitation signal was barely above the noise floor. Figure 5 further shows that the threshold value was set to approximately two times higher than the average of noise level. Example traces corresponding to maxima near the threshold are shown as well. Fig. 5Maximum derivative calculated from the backscattering raw signals [c to g: axis ; axis ] for discrete radiant exposure relative to for (a) pulses and (b) pulses. Circled data points correspond to the raw signal traces (c) to (g). Traces (c) and (f) are negative as to bubble formation. Although an increase of signal can already be observed near the end of the pulse in the raw traces (d), (e), and (g), their peak derivative delivers a quantitative and objective measurement. The cavitation-induced spikes have up to two orders of magnitude steeper slopes than the noise signals and are typically larger than 3 times the average noise.  The cell damage probability (number of dead cells/total number of irradiated cells) and the cavitation probability (number of cells with cavitation/total number of irradiated cells) are compared as a function of radiant exposure (Fig. 6 ). For 1- and pulse durations, the probability of cavitation is higher than the probability of cell death over the entire range of radiant exposures because a significant number of cells survived the cavitation. For pulses, the two traces coincide for all tested radiant exposures. For pulses and longer, the cell death probability is higher than the cavitation probability, that is, cavitation occurs at a significantly higher radiant exposure than cell damage. The discrepancy further increases with pulse duration. Fig. 6Probability functions of cell death and cavitation as a function of radiant exposure acquired by counting dead cells and cavitation events versus the number of irradiated cells for exposure times to . Threshold radiant exposure increases for both cell damage and cavitation with exposure time. For 1- and pulse durations, the percentage of cavitation is higher than that of cell death for any given radiant exposure. For pulses, the two traces coincide for all tested radiant exposures. For pulses and longer, the cell death percentage is higher than cavitation percentage, and the discrepancy increases with pulse duration. The error bars represent the standard deviation; they are about the same size for all other points of the curve.  and were determined from the Probit analysis and plotted in Fig. 7 as a function of pulse duration. The error bars represent the upper (FUL) and lower (FLL) limits of the 95% fiducial confidence intervals. The radiant exposures, for both cavitation and cell death, were found to increase with increasing pulse duration (note that the power decreases with pulse duration). For 1- and pulses, the ( and , respectively) is higher than the ( and , respectively). The for cell death and cavitation were approximately equal for the pulses . For , the is lower than the , and the difference is larger with pulses. Fig. 7Radiant exposure thresholds for cell death and cavitation as a function of pulse duration. The error bars represent the upper (FUL) and lower (FLL) confidence limits (95% fiducial confidence intervals). For 1- and pulses, the ( and , respectively) is higher than ( and , respectively). The values for cell death and cavitation were approximately equal for pulses . For , the is lower than the , and the difference gets higher with pulses. This indicates that more and more cells are damaged without the influence of cavitation with increasing exposure time. ‘ ’ represents the number of data used for the analysis for each exposure time. 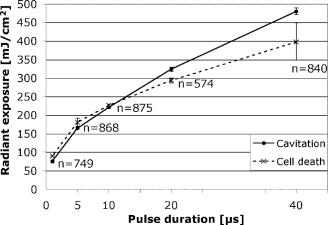 In Fig. 8a , the percentage of dead cells associated with cavitation (number of dead cells with cavitation/total number of dead cells) are plotted for radiant exposures at and higher. In the case of 1- to pulses, more than 95% of dead cells were associated with cavitation bubble formation regardless of the pulse energy. For pulses with 20- and duration, the majority of dead cells (more than 95%) were accompanied by cavitation at high pulse energy . However, cell damage without cavitation is increasingly observed, and the ratio near decreased to 65% and 45% for 20 and , respectively. Fig. 8Percentage of dead cells associated with cavitation (a) and percentage of viable cells with cavitation for different pulse duration (b). The error bars represent the standard deviation. The number of exposed cells per pulse duration is consistent with the sample size stated in Fig. 7. In (a), for 1- to pulses, more than 95% of dead cells were associated with cavitation formation at about cell damage threshold . The ratio decreased to 65% and 45% for 20 and , respectively. However, the majority of dead cells (more than 95%) were still accompanied by cavitation at 30% to 50% above even for pulse durations of 20 and . In (b), the percentage of cells surviving a cavitation decreases with increasing pulse duration. In the case of , cavitation in as many as 29% of viable cells was observed, while the percentage is close to zero for 20 and .  The percentage of surviving cells associated with cavitation (number of viable cells with cavitation/total number of irradiated cells) are presented in Fig. 8b for radiant exposures at 1.1 and higher. The percentage decreases with increasing pulse duration. In the case of , the percentage is as high as 29%, while cells surviving a cavitation event were rarely found for (3 out of 574 cases) or not found at all for exposures (0 out of 840 cases). 4.DiscussionIn order to investigate the cell damage mechanism, bovine RPE cells were irradiated with green laser pulses with various pulse durations. Intracellular cavitation was monitored and correlated with the cell death. Previous studies 21, 40, 41, 42 have used simultaneous high-speed imaging and light scattering experiments to investigate bubble formation around laser-heated melanosome particles. These studies cover the range of laser pulses from (Ref. 40) up to (Refs. 21, 41). These studies all show an abrupt drop in the forward-transmitted probe beam signal that coincides with the formation of microbubbles around the melanosomes as observed by high-speed imaging. In addition, interferometric measurements during RPE irradiation with pulses revealed that cavitation gives rise to a transient backscattered signal that is attributed to a rapidly moving interface formed when a bubble expands and collapses.42 These previous studies sufficiently demonstrated that formation of the cavitation bubble extends into the regime, and the onset of the cavitation causes an abrupt change in the forward and backward scattering of the probe beam. It has been also reported that the onset of the cavitation bubble takes place near the end of the irradiation pulse in the regime of pulse durations discussed here. 21, 31, 41, 42 In the current study, intracellular cavitation was monitored by detecting the backscattered light of the irradiation pulse because backscattering geometry is necessary for future in vivo detection. The enhanced backscattering at the interface of a cavitation bubble appears as a rapid, transient increase of the APD signal (Fig. 2). The signal contains the following distinct features:
The signal width is consistent with the previously reported lifetime of micrometer-size bubbles around laser-heated melanosomes.41 The reason for the multiple spikes is that many melanosomes are heated at once, creating multiple bubbles. In addition, when the laser pulse duration is longer than the bubble lifetime, individual melanosomes can be heated again after bubble collapse to produce additional bubbles. The derivative of the backscattering signal was utilized to distinguish the cavitation-induced signals from noise. The majority (more than 99%) of cavitation spikes produced a slope at least three times larger than the average noise level. This suggests that the derivative of the backscattering signal can serve as a good metric for the assessment of intracellular cavitation during SRT. At the radiant exposure for cavitation, the cavitation bubbles were detected at or near the end of the pulse. With higher radiant exposure, the cavitation threshold is reached sooner, resulting in an earlier cavitation signal. As expected, the for cavitation and cell death were found to increase with increasing pulse duration . It is notable that a significant number of surviving cells were associated with intracellular cavitation during short pulses. Previous studies have shown that it is possible to create cavitation without inducing endothelial cell30 and RPE cell death.32 It can be assumed that small cavitation bubbles are formed, but the resulting mechanical stress is not sufficient to cause cell death.30 The percentage of cells that survived a cavitation event decreased with increasing pulse duration. Near the threshold of cavitation, larger cavitation signals were observed with longer pulses.31 This was attributed to the higher threshold radiant exposure achieved with a longer pulse. During a long exposure time, a larger volume of surrounding fluid is heated as a result of heat diffusion from the absorbing melanosomes. This volumetric heat accumulation leads to a large bubble once the nucleation temperature is reached at the surface of melanosome. Smaller cavitation bubbles, produced by shorter pulses, can lead to a higher incidence of surviving cells with cavitation. That is, the stress imposed by a few small bubbles may not be sufficient to damage the cell. Cell death without cavitation signal, on the other hand, can be interpreted in two different ways: cavitation bubbles were formed but not detected, or cells were killed without cavitation. For short pulses (up to ), cavitation bubbles were detected in a significant number of surviving cells, indicating that the optical detection scheme is sensitive enough to pick up cavitation events that are insufficient to cause cell death. Consequently, the likelihood for missing cavitation bubbles leading to cell death is low. It is noted that an increasing number of cells died without a cavitation signal for longer pulse durations. If cavitation occurs, the bubble size is typically larger for longer pulse durations,32 making them easier to be detected. Consequently, the likelihood for missing the cavitation bubble should decrease with increasing pulse duration. The high sensitivity and higher number of cells without cavitation signal for long pulses suggest that the lack of bubble signal indicates lack of bubble formation. For pulse durations of and longer, the radiant exposure for cell death is lower than that of cavitation. As the pulse gets longer, the amount of heat diffusion away from the melanosomes into the cytoplasm becomes more significant. This outcome can be predicted considering the thermal relaxation time and the thermal diffusion length. The thermal relaxation time is proportional to the particle radius and inversely proportional to the thermal diffusivity of the medium: . For a melanosome of in diam that is embedded in water, [with ]. The thermal diffusion length is related to the pulse width: . In our experiments, the diffusion length increases with pulse duration from with pulses to for pulses, respectively. Thus, heat diffusion is confined to the vicinity of the particle for the shorter pulse durations. For the long pulse durations, the diffusion length exceeds the typical distance between neighboring melanosomes (about ). As a result of increased heat diffusion into the surrounding cell medium, the probability of thermally induced cell death increases with pulse duration, and the mechanism of cell damage undergoes a gradual transition from a purely mechanical to a thermal-mediated process.21, 32 The observation of multiple dead cells around a single laser spot (Fig. 4) provides further evidence of thermal conduction away from the absorbing melanosomes. With increasing heat dissipation, neighboring cells can be affected by diffusion into the periphery (if no bubble was detected) or by generation of larger bubbles in the targeted cell. These results are explained in more quantitative terms by examining the spatial temperature distribution and light scattering from small cavitation bubbles in the following two sections. 4.1.Temperature CalculationsFigure 9 shows the temperature distribution around a single melanosome for the measured in our experiments; the inset shows the results when the is used for the source term. values were taken from Fig. 6; occurs consistently at about 1.3 . According to this model, irradiation with 1- and pulses results in the same surface temperature ( at and at ), with the pulse resulting in the least amount of heat diffusion. The temperature in the cell medium at position (i.e., from the particle surface) is not elevated at the end of a pulse for either or . As a consequence, short pulses are more likely to result in bubble formation than longer pulses. Cavitation is observed in almost every dead cell [Fig. 8a], suggesting that these cells have been damaged mechanically. Fig. 9Spatial temperature distribution around a single melanosome of diameter with absorption coefficient of and the (inset: ). The traces are defined in terms of pulse duration, which represents the power that decreases from for pulses to for pulses. The -axis r/a describes the distance from the particle center; ‘1’ is the particle surface. The particle is outlined by the gray box.  With increasing pulse duration, heat diffusion becomes significant, leading to decreased temperature on the particle surface and increased temperature in the surrounding cell medium. The surface temperature is, in the most extreme case at , about 40% below the temperature of a pulse. Conversely, the medium temperature at a distance of from the particle is elevated, suggesting that significant amounts of heat energy are diffusing even from a single particle. Thus, heat diffusion leads to heating of both the surrounding cell medium and adjacent particles, because the spatial separation between neighboring melanosomes is typically about .21 In addition, the Gaussian irradiance profile with a diameter of is also incident on neighboring particles (even though those “see” a smaller fraction of incident power), further adding to the amount of heat energy that is absorbed and, subsequently, conducted into the cell medium. Thus, accumulating conduction during a pulse leads to heating of a cell volume that is significantly larger than that from a pulse, where heat is mostly confined to the immediate vicinity of the particle. Therefore, with long pulse durations, the probability for cells to be damaged thermally before the cavitation temperature is reached increases [Fig. 8a], resulting in a cell death threshold that is lower than the cavitation threshold.43 4.2.Detection sensitivityGiven that bubble formation accompanies RPE cell death in the majority of cells irradiated with short laser pulses, we next examine the sensitivity of optically detecting cavitation as a feedback mechanism during treatment. The following discussion is based on Mie scattering calculation of light scattering from spherical bubbles. According to Fig. 10 , at , approximately 0.0005% of a Gaussian laser beam incident on a bubble is backscattered. This extremely low fraction of backscattered light justifies the decision to detect the backscattered signal from the higher-power irradiation pulse itself, rather than from a separate, low-power probe beam. However, backscattering in this size regime is strongly dependent on the bubble diameter; thus, increasing the bubble diameter to results in a backscattering percentage that is about 5 times higher. Fig. 10Percentage of laser power backscattered by a growing cavitation into as a function of bubble diameter. For calculations, the bubble was assumed to be centered on a Gaussian irradiance distribution, since the highest temperature is most likely achieved in this location.  4.2.1.Detector voltage resulting from backscattering and signal-to-noise ratioConsidering the transmission efficiency of our system and the photoelectric sensitivity of our APD, a micron-size bubble during a pulse at the power results in a detector voltage on the order of . Due to lower incident laser power for pulses, backscattering from a micron-size bubble (at power) would result in a much lower detector signal of . However, since backscattering in this size regime is strongly dependent on the bubble diameter, a bubble that is only 5% larger leads to a signal that is almost twice as big (Fig. 11 ). Fig. 11Resulting voltage from backscattering for cavitation between 1 and in diameter. As in Fig. 9, power decreases from 1 to . Thus, the voltage as a result of backscattering scales with the available power. The smallest bubble leads to a signal of when probed with the of . Since scattering in this size regime is strongly size dependent, a slightly larger bubble yields a signal of .  A bubble can be detected only if the detector voltage due to backscattering is larger than the noise (voltage fluctuation). To estimate the detection sensitivity, the calculated cavitation-induced voltage was compared to the noise of our signal. The noise was determined for no light input between consecutive pulses (i.e., dark noise) and for the pedestal at and optical power ( at 1 and , respectively) by analyzing six acquired detector traces each. The standard deviation of the voltage fluctuation in the dark trace was . In the pedestals during irradiation, the mean voltage was typically about and the standard deviation was . A pulse resulted in a pedestal mean voltage of about and a standard deviation of . These numbers agree with the noise figures calculated from the noise spectral density, using data supplied by the manufacturer. Comparing these noise values with calculated voltage from Fig. 11, our system is capable of detecting micron-size spherical bubbles during both a and a pulse at . For a pulse, with a probe power of available, the SNR is 5 for the smallest cavitation of in diameter. The SNR is 1.5 for pulses when one standard deviation of noise is considered. With the bubble most likely expanding, the SNR rapidly increases to 3 for a slightly larger bubble. The post-scanning beam expander that triples the collection numerical aperture to made this detection sensitivity possible. Without the beam expander, the collection NA would have been equal to the forward NA of the scanner , resulting in a photon loss of about one order of magnitude. 4.2.2.Implications for current results and future in vivo workGiven the good detection efficiency of our setup, we must conclude that cells in fact were damaged thermally during long pulse durations and that bubble formation truly did not occur when cells appeared to have been damaged without bubble formation [Fig. 8a]. For pulse duration of , the scattering calculations furthermore demonstrate that our instrument is capable of detecting spherical bubbles that barely expand beyond the diameter of the particle. This observation suggests that sensitivity of the system is sufficient to detect bubbles that form around individual particles. At the short pulse durations, not every detected cavitation resulted in cell death [Fig. 8b]; it is conceivable that a single bubble that forms around one melanosome is insufficient to damage the cell. When bubbles were detected at during pulses, the transient bubble signal was significantly longer than in pulses. In Fig. 12 , we plot the detector voltage versus the width of several transient bubble signals for 1- and pulses. Detector signals that were cut off by the end of the pulse and multiple spikes were excluded from the analysis. As a result, the signal width (i.e., the bubble lifetime) is on the order of 100 to for pulses, while it extends to up to for pulses [Fig. 12a]. Higher voltage and steeper slope in the data are a result of higher probe power: data were taken at 30% above for and at for data. Therefore, in Fig. 12b, we estimate the bubble diameter that corresponds to the detector voltage, using the results of the Mie calculations (compare Sec. 2.5 and Figs. 10 and 11) and taking the different probe powers into account. The estimated bubble size is compared to a derivation of the Rayleigh equation,44, 45 which states that the bubble lifetime is proportional to the maximum bubble radius : . Using the mass density of water and a pressure difference across the bubble interface of , the resulting equation for the Rayleigh fit is . Thus, Fig. 12 demonstrates that long pulse durations generate larger bubbles than pulse durations on the order of the thermal relaxation time, as was previously reported.31 This observation in turn supports the notion of volumetric or interparticle heating (discussed in Sec. 4.1) that dominates during long pulse durations. Fig. 12Detector voltage above pedestal versus full width at half maximum of individual bubble spikes for 1- and pulse durations (a) and estimated size of the cavitation (b). (a) Bubble lifetimes are mostly between 100 to during pulses and have significantly longer lifetimes of up to for pulses. Note that these data were taken at 1.3 for pulses and for pulses. As a consequence of higher probe power, spherical bubbles of equivalent size will result in higher detector voltage during pulses. (b) Estimating the bubble diameter from Mie calculations and taking the difference in probe power into account confirms the trend that longer pulse durations result in larger bubbles. The solid line in (b) is the relation of bubble size versus lifetime as predicted by the Rayleigh equation.  Figure 12 furthermore shows the relationship of estimated bubble size to measured lifetime; the solid line is the prediction according to the Rayleigh equation. Two factors most likely contribute to the small discrepancy:
Due to these uncertainties, the scattering model can only approximate the bubble diameter; however, the trend that longer pulse durations result in larger bubbles is not affected by the uncertainties in the model. We are currently assembling a slit-lamp adapted scanner for in vivo experiments in rabbit eyes. The post-scanning optical system is comprised of the same beam expander that increases the collection NA to 0.06. The detection sensitivity is expected to be sufficient to monitor cell death during irradiation; the collection efficiency should be preserved, since the collection NA is significantly smaller than the NA of the eye ( with a dilated pupil). The sensitivity may decrease due to scattering in the ocular media; however, if or to what degree the sensitivity decreases will be the subject of future in vivo measurements. 4.3.Comparison to Alternative Detection SchemesSchüle employed two independent methods to detect intracellular cavitation on porcine RPE cells upon pulsed laser irradiation.32 One is an acoustic measurement method using a hydrophone, and the other is an optical backscattering measurement, which is similar to our monitoring scheme. The beam diameter on RPE was about , and thus 7 to 9 cells were exposed at a time. Their acoustic measurement demonstrated that cells were killed predominantly by cavitation during pulses and that thermal denaturation was the primary cause of cell death for pulses and longer. However, their optical measurement was not able to detect cavitation near threshold. We suspect that two reasons mainly contributed to this fact:
We performed more detailed measurements of the cell death mechanism in the crucial transition region between 1 and . In addition, we irradiated single cells with a single pulse in order to correlate every cavitation signal with individual cell death. We showed that the optical method is sensitive enough to detect even small cavitation bubbles that did not cause cell death. Our method has several advantages over the acoustic method. The acoustic transducer needs to maintain contact with the patient’s eye, whereas the backscattering method can be performed in a noncontact mode. Backscattering can monitor single cell death produced by a single pulse, while the acoustic approach provides an assessment only for pulses applied to a group of cells. Overall, our results are in agreement with the acoustic measurement of Schüle 32 For pulses shorter than , more than 95% of all cell deaths were associated with cavitation bubble formation. The high percentage of cell death associated with cavitation and the fact that is slightly lower than suggests that RPE damage is caused by the formation of intracellular cavitation for laser pulses up to . For pulses of and longer durations, radiant exposure for is lower than that of . Many cells were killed without cavitation at , suggesting that the probability of cell death by thermal mechanism gradually increases with pulse duration. 4.4.Proposed Application of Optical Detection of CavitationDuring in vivo irradiation, selective RPE lesions are not visible by slit-lamp examination, due to the absence of thermal coagulation of the sensory retina. In a clinical setting, it will be crucial to monitor the selective RPE death during the treatment in order to provide immediate feedback. As reported in this paper, monitoring the backscattering of the treatment laser beam is an attractive, noncontact method to detect intracellular cavitation in individual RPE cells for individual exposures. Alt and Framme have demonstrated that selective damage of the RPE can be achieved in rabbit eyes16, 17 by focusing the laser beam to approximately the size of a single RPE cell and rapidly scanning the spot so as to produce effective exposure durations in the microsecond domain. Thus, the ability to measure cell death at the single cell level is important in this treatment modality. Detection sensitivity can decrease when a Gaussian profile is continuously scanned across the retina because at the end of the exposure the irradiance maximum has passed the irradiation site. Thus, fewer photons are available for backscattering. Investigations to determine whether pulsed and scanning irradiation modes can be combined to optimize dosimetry are currently under way. Since the majority of cell death is accompanied by cavitation, the backscattered light can be used to monitor cell damage for exposure durations shorter than . Even for 20- and pulse durations, treatment outcome can be reliably assessed using the backscattered light for radiant exposure of 1.5 . A setting of is more likely to be used in the clinic than , since in most situations we want to ensure near 100% cell killing. Scanning irradiation at about 1.5 can be safe considering the large therapeutic window (i.e., safety range) of the scanning device.17 By monitoring cavitation in real-time during SRT, treatment parameters (radiant exposure and pulse duration) can be adjusted in order to ensure selectivity and efficiency in a clinical application as well as to avoid damage to the photoreceptors. 5.ConclusionThe RPE cell damage mechanism has been investigated by monitoring of the intracellular cavitation for various clinically crucial pulse durations from 1 to . The backscattering of the treatment laser beam was monitored to detect the cavitation. The derivative of backscattering signal can serve to distinguish the cavitation-induced increase from noise. The threshold radiant exposures for cell death and cavitation were found to increase with pulse duration. It was found that cells were killed predominantly by cavitation for pulses shorter than and that the percentage for thermally induced cell death gradually increases with pulse duration. We have demonstrated that the backscattering of treatment light can be used to monitor single cell viability during SRT for pulses shorter than ex vivo. In cases of and longer pulse durations, the backscattering signal allows monitoring of cell viability for radiant exposure of 1.5 and higher. Future research will show whether the laser radiant exposure and pulse duration can be adjusted by monitoring the treatment outcome using the backscattering signal. AcknowledgmentsThe authors thank Dr. A. Yaroslavsky of the Wellman Center for Photomedicine for providing the code for calculation of the scattering phase function. This work was supported by NIH Grant No. EY-12970. ReferencesR. R. Anderson and
J. A. Parrish,
“Selective photothermolysis: precise microsurgery by selective absorption of pulsed radiation,”
Science, 220 524
–527
(1983). https://doi.org/10.1126/science.6836297 0036-8075 Google Scholar
P. Tornquist,
A. Alm, and
A. Bill,
“Permeability of ocular vessels and transport across the blood-retinal-barrier,”
Eye, 4 303
–309
(1990). 0950-222X Google Scholar
V. P. Gabel,
R. Birngruber, and
F. Hillenkamp,
“Visible and near infrared light absorption in pigment epithelium and choroids,”
International Congress Series No. 450, XXIII Concilium Ophthalmologicum, Kyoto, 658
–662 1978). Google Scholar
I. Grierson,
P. Hiscott,
P. Hogg,
H. Robey,
A. Mazure, and
G. Larkin,
“Development, repair, and regeneration of the retinal pigment epithelium,”
Eye, 8 255
–262
(1994). 0950-222X Google Scholar
J. K. McBee,
K. Palczewski,
W. Baehr, and
D. R. Pepperberg,
“Confronting complexity: the interlink of phototransduction and retinoid metabolism in the vertebrate retina,”
Prog. Retin Eye Res., 20 469
–529
(2001). 1350-9462 Google Scholar
H. Elsner,
E. Pörksen,
C. Klatt,
A. Bunse,
D. Theisen-Kunde,
R. Brinkmann,
R. Birngruber,
H. Laqua, and
J. Roider,
“Selective retina therapy in patients with central serous chorioretinopathy,”
Graefe's Arch. Clin. Exp. Ophthalmol., 244 1638
–1645
(2006)
(0721-832X) Google Scholar
C. Klatt,
H. Elsner,
E. Pörksen,
R. Brinkmann,
A. Bunse,
R. Birngruber, and
J. Roider,
“Selective retina therapy in central serous retinopathy with RPE detachment,”
Ophthalmologe, 103 850
–855
(2006). https://doi.org/10.1007/s00347-006-1415-7 0941-293X Google Scholar
H. Elsner,
C. Klatt,
S. H. M. Liew,
E. Pörksen,
A. Bunse,
M. Rudolf,
R. Brinkmann,
R. P. Hamilton,
R. Birngruber,
H. Laqua, and
J. Roider,
“Selective retina therapy in diabetic maculopathy,”
Ophthalmologe, 103 856
–860
(2006). https://doi.org/10.1007/s00347-006-1414-8 0941-293X Google Scholar
J. Roider,
N. A. Michaud,
T. J. Flotte, and
R. Birngruber,
“Response of the retinal pigment epithelium to selective photocoagulation,”
Arch. Ophthalmol. (Chicago), 110 1786
–1792
(1992). 0003-9950 Google Scholar
J. Roider,
F. Hillenkamp,
T. J. Flotte, and
R. Birngruber,
“Microphotocoagulation: selective effects in biological tissue using repetitive short laser pulses,”
Proc. Natl. Acad. Sci. U.S.A., 90 8643
–8647
(1993). https://doi.org/10.1073/pnas.90.18.8643 0027-8424 Google Scholar
J. Roider,
R. Brinkmann,
C. Wirbelauer,
H. Laqua, and
R. Birngruber,
“Retinal sparing by selective retinal pigment epithelial photocoagulation,”
Arch. Ophthalmol. (Chicago), 117 1028
–1034
(1999). 0003-9950 Google Scholar
J. Roider,
“Laser treatment of retinal diseases by subthreshold laser effects,”
Semin Ophthalmol., 14 19
–26
(1999). 0882-0538 Google Scholar
J. Roider,
R. Brinkmann,
C. Wirbelauer,
H. Laqua, and
R. Birngruber,
“Subthreshold retinal pigment epithelium photocoagulation in macular diseases: a pilot study,”
Br. J. Ophthamol., 84 40
–47
(2000). https://doi.org/10.1136/bjo.84.1.40 0007-1161 Google Scholar
R. Brinkmann,
J. Roider, and
R. Birngruber,
“Selective retina treatment (SRT): a review on methods, techniques, preclinical and first clinical results,”
Bull. Soc. Belge Ophtalmol, 302 51
–69
(2006). 0081-0746 Google Scholar
R. Brinkmann,
N. Koop,
M. Özdemir,
C. Alt,
G. Schüle,
C. P. Lin, and
R. Birngruber,
“Targeting of the retinal pigment epithelium (RPE) by means of a rapidly scanned continuous wave (CW) laser beam,”
Lasers Surg. Med., 32 252
–264
(2003). https://doi.org/10.1002/lsm.10150 0196-8092 Google Scholar
C. Alt,
C. Framme,
S. Schnell,
G. Schuele,
H. Lee, and
C. P. Lin,
“Selective targeting of the retinal pigment epithelium using an acousto-optic laser-scanner,”
J. Biomed. Opt., 10 164014
(2005). https://doi.org/10.1117/1.2136314 1083-3668 Google Scholar
C. Framme,
C. Alt,
S. Schnell,
M. Sherwood,
R. Brinkmann, and
C. P. Lin,
“Selective targeting of the retinal pigment epithelium in rabbit eyes with a scanning laser beam,”
Invest. Ophthalmol. Visual Sci., 48 1782
–1792
(2007). https://doi.org/10.1167/iovs.06-0797 0146-0404 Google Scholar
M. A. Williams,
L. H. Pinto, and
J. Gherson,
“The retinal pigment epithelium of wild type and pearl mutant (C57BL/6J pe/pe) mice,”
Invest. Ophthalmol. Visual Sci., 26 657
–669
(1985). 0146-0404 Google Scholar
M. Strauss,
P. A. Amendt,
R. A. London,
D. J. Maitland,
M. E. Glinsky,
C. P. Lin, and
M. W. Kelly,
“Computational modeling of stress transients and bubble evolution in short pulse laser irradiated melanosome particles,”
Proc. SPIE, 2975 261
–270
(1997). https://doi.org/10.1117/12.275491 0277-786X Google Scholar
R. D. Glickman,
S. L. Jacques,
R. T. Hall, and
N. Kumar,
“Revisiting the internal absorption coefficient of the retinal pigment epithelium melanosomes,”
Proc. SPIE, 4257 134
–141
(2001). https://doi.org/10.1117/12.434697 0277-786X Google Scholar
R. Brinkmann,
G. Hüttmann,
J. Rogener,
J. Roider,
R. Birngruber, and
C. P. Lin,
“Origin of RPE-cell damage by pulsed laser irradiance in the ns to ms time regime,”
Lasers Surg. Med., 27 451
–464
(2000). https://doi.org/10.1002/1096-9101(2000)27:5<451::AID-LSM1006>3.0.CO;2-1 0196-8092 Google Scholar
J. Neumann and
R. Brinkmann,
“Boiling nucleation on melanosomes and microbeads transiently heated by nanosecond and microsecond laser pulses,”
J. Biomed. Opt., 10 024001
(2005). https://doi.org/10.1117/1.1896969 1083-3668 Google Scholar
D. Sliney,
J. Mellerio, and
K. Schulmeister,
“What is the meaning of thresholds in laser injury experiments,”
Health Phys., 82 335
–347
(2002). https://doi.org/10.1097/00004032-200203000-00006 0017-9078 Google Scholar
A. J. Welch and
M. J. D. Van Gemert, Optical-Thermal Response of Laser-Irradiated Tissue, 561
–606 Plenum Press, New York (1995). Google Scholar
D. H. Sliney and
M. L. Wolbarsht, Safety with Lasers and Other Optical Sources, Plenum Press, New York (1980). Google Scholar
R. Birngruber,
V. P. Gabel, and
F. Hillenkamp,
“Experimental studies of laser thermal retinal injury,”
Health Phys., 44 519
–531
(1983). https://doi.org/10.1097/00004032-198305000-00006 0017-9078 Google Scholar
M. W. Kelly and
C. P. Lin,
“Microcavitation and cell injury in RPE cells following short-pulsed laser irradiation,”
Proc. SPIE, 2975 174
–179
(1997). https://doi.org/10.1117/12.275473 0277-786X Google Scholar
C. P. Lin,
M. W. Kelly,
S. A. Sibayan,
M. A. Latina, and
R. R. Anderson,
“Selective cell killing by microparticle absorption of pulsed laser radiation,”
IEEE J. Sel. Top. Quantum Electron., 5 963
–968
(1999). https://doi.org/10.1109/2944.796318 1077-260X Google Scholar
B. S. Gerstman,
C. R. Thompson,
S. L. Jacques, and
M. E. Rogers,
“Laser induced bubble formation in the retina,”
Lasers Surg. Med., 18 10
–21
(1996). https://doi.org/10.1002/(SICI)1096-9101(1996)18:1<10::AID-LSM2>3.0.CO;2-U 0196-8092 Google Scholar
D. Leszczynski,
C. M. Pitsillides,
R. R. Anderson, and
C. P. Lin,
“Laser-beam-triggered microcavitation: a novel method for selective cell destruction,”
Radiat. Res., 156 399
–407
(2001). https://doi.org/10.1667/0033-7587(2001)156[0399:LBTMAN]2.0.CO;2 0033-7587 Google Scholar
J. Roegener,
R. Brinkmann, and
C. P. Lin,
“Pump-probe detection of laser-induced microbubble formation in retinal pigment epithelium cells,”
J. Biomed. Opt., 9 367
–371
(2004). https://doi.org/10.1117/1.1646413 1083-3668 Google Scholar
G. Schüle,
M. Rumohr,
G. Huettmann, and
R. Brinkmann,
“RPE damage thresholds and mechanisms for laser exposure in the microsecond-to-millisecond,”
Invest. Ophthalmol. Visual Sci., 46 714
–719
(2005). https://doi.org/10.1167/iovs.04-0136 0146-0404 Google Scholar
C. P. Cain,
G. D. Noojin, and
L. Manning,
“A comparison of various probit methods for analyzing yes/no data on a log scale,”
(1996). Google Scholar
D. J. Finney, Probit Analysis, 3rd ed.Cambridge University Press, London (1971). Google Scholar
H. Goldenberg and
C. J. Tranter,
“Heat flow in an infinite medium heated by a sphere,”
Br. J. Appl. Phys., 3 296
–298
(1952). https://doi.org/10.1088/0508-3443/3/9/307 0508-3443 Google Scholar
J. R. Hayes and
M. L. Wolbarsht, Modes in Pathology: Mechanism of Action of Laser Energy with Biological Tissues, Plenum Press, New York (1971). Google Scholar
(IAPWS), “Revised Release on the IAPS Formulation 1985 for the Thermal Conductivity of Ordinary Water Substance,”
(1998) www.IAWPS.org Google Scholar
G. Mie,
“Beiträge zur Optik trüber Medien speziell kolloidaler Metallösungen,”
Ann. Phys., 25 377
–445
(1908). https://doi.org/10.1002/andp.19083300302 0003-3804 Google Scholar
C. F. Bohren and
D. R. Huffman, Absorption and Scattering by Small Particles, Wiley-Interscience, New York (1983). Google Scholar
C. P. Lin and
M. W. Kelly,
“Cavitation and acoustic emission around laser-heated microparticles,”
Appl. Phys. Lett., 72 2800
–2802
(1998). https://doi.org/10.1063/1.121462 0003-6951 Google Scholar
J. Neumann and
R. Brinkmann,
“Microbubble dynamics around laser heated microparticles,”
Proc. SPIE, 5142 82
–87
(2003). https://doi.org/10.1117/12.499944 0277-786X Google Scholar
J. Neumann and
R. Brinkmann,
“Cell disintegration by laser-induced transient microbubbles and its simultaneous monitoring by interferometry,”
J. Biomed. Opt., 11 041112
(2006). https://doi.org/10.1117/1.2339815 1083-3668 Google Scholar
G. Hüttmann and
R. Birngruber,
“On the possibility of high-precision photothermal microeffects and measurement of fast thermal denaturation of proteins,”
IEEE J. Sel. Top. Quantum Electron., 5 954
–962
(1999). https://doi.org/10.1109/2944.796317 1077-260X Google Scholar
Lord Rayleigh,
“On the pressure developed in a liquid during the collapse of a spherical cavity,”
Philos. Mag., 34 94
–98
(1917). 0031-8086 Google Scholar
R. de la Torre,
“Intravascular laser induced cavitation: a study of the mechanics with possible detrimental and beneficial effects,”
Harvard-MIT Division of Health Sciences and Technology,
(1992). Google Scholar
|


