
|
|
|
Early patterning and polarity of mammalian embryos are fundamental and important in developmental biology. The early mammalian embryos have been thought to be highly regulative and many embryologists assume that there is no prepatterning during early development.1–3 However, recent studies have proposed that factors in early patterning such as pronuclei,4 zona pellucida (ZP),5 second polar body (2PB),6 the first, and second two cleavages,7–9 are associated with the polarity axis in several ways, but some of these findings are not consistent with each other. Whether these factors play decisive roles in the establishment of the polarity has yet to be defined. The controversies not only arise from the remarkable regulating capacity of embryos, but also from experimental methods used in the related investigations. Most of the studies involved dye-labeling techniques. Though some groups claimed that their labeling did not affect the normal development,4,6,9 this does not exclude the possibilities of latent disturbances to the normal processes. On the other hand, most of the current findings are based on 2D imaging methods, such as conventional microscope and differential interference contrast microscopy.5–8 In such investigations, spatial localizations of related factors can only be qualitatively analyzed but not correctly quantified. Also, most embryos are not well oriented;4 their relative positions are often a puzzle to observers. To solve the problem, a few groups utilized 3D imaging techniques such as confocal laser scanning microscopy and multi-photon excitation laser scanning microscopy,5,9,10 but they all required sample preprocessing and dye labeling. Furthermore, when using these systems, optical damage to the sample is not ignorable, as the optical power density is as high as to .11 Therefore, label-free 3D imaging techniques with low optical dose are in high demand in the study of early patterning and polarity. As an extension of optical coherence tomography (OCT), FF-OCT is an emerging technology for submicron-scale label-free 3D imaging.12–14 FF-OCT detects back-scattered light rather than fluorescence, requiring no labeling nor preprocessing. Equipped with broad-band light source and high N.A. microscope objectives, FF-OCT is capable of achieving 3D images with subcellular resolution in both longitudinal and transverse directions. Furthermore, the entire field of view is uniformly illuminated with the average optical power density only of , about 7 to 10 orders of magnitude lower than confocal imaging. Therefore, the sample receives much less optical dose, which is favorable for long-time and live observation. These unique characteristics make FF-OCT a powerful imaging methodology in biomedical studies.1518.–19 The potential of OCT in developmental biology has been successfully demonstrated using different animals including Xenopus laevis,20 Brachydanio rerio,21 embryonic avian heart,22,23 mouse, and rat.24,25 However, until now there have been no related live studies with mammalian embryos at the very beginning of their embryonic lives, which are important for understanding early patterning and polarity. This is because that the incubating condition and low optical dose requirement of the mammalian embryos during the first 3 to 4 days of embryonic life is critical for live imaging. Furthermore, imaging of the mammalian preimplantation embryos, which is relatively small in size, is technically more challenging. In this paper, FF-OCT was applied to image early patterning and polarity of preimplantation mouse live embryos and obtain label-free 3D subcellular structural images at various typical preimplantation stages, including zygote, two-cell, four-cell, and blastocyst stages. The schematic of FF-OCT setup is shown in Fig. 1(a). It was based on Linnik interference microscope with a tungsten-halogen lamp. The optical power was 0.5 mW, corresponding to an optical power density of . The interferograms were digitized by a charge-coupled device (CCD) camera (IMPERX, MDC-1004, , 48 Hz). Two identical water-immersion microscope objectives (Nikon , 0.5 N.A.) were utilized in both arms, achieving a transverse resolution of 0.7 µm. The central wavelength of the light source was 600 nm and the spectral bandwidth 180 nm, corresponding to a depth resolution of 0.7 µm in water. A polished YAG crystal was placed in the reference arm and attached to a piezoelectric transducer (PZT). PZT was used to extract enface tomographic signals of the sample.12 A motorized translation stage was placed in the sample arm to get a 3D volumetric image. To keep the embryos alive for live imaging, we integrated a custom-designed incubator on the translation stage providing 37°C, 5% . 3D reconstruction and the segmentation were performed with commercial software platform 3Dmed 3.0 and Amira 5.2.0. Fig. 1(a) Schematic diagram of FF-OCT based on the Linnik interference microscope. BS, beam splitter; MO, microscope objectives (water-immersion, , 0.4 NA); Lens (300 mm focal length); PZT, piezoelectric transducer; CCD, silicon charged-coupled device. (b) 3D reconstruction of a zygote stage embryo with FF-OCT. (c) Cross-section view of the same embryo. ZP, zygote, 2PB and three dark areas (DA1, DA2, and DA3) are clearly distinguishable. (d) 3D reconstruction of three dark areas. Three vertices of the triangle are 3D geometry centers of three dark areas and corresponding three lengths are 19.1, 44.0, and 25.7 µm. (e) 3D reconstruction of three nuclei (2PBN, FPN, and MPN) labeled with Hoechst 33342. Three vertices of the triangle are 3D fluorescence centers of the nuclei and three lengths are 19.1, 44.4, and 26.0 µm. 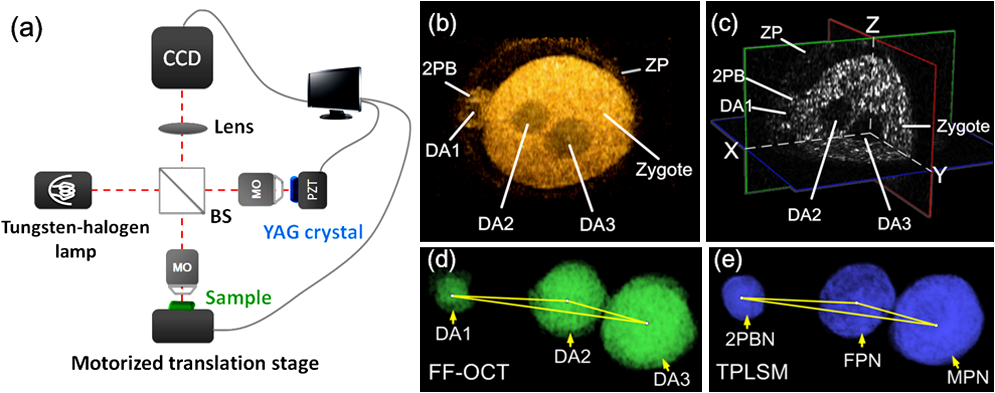 As the mouse is an excellent model to investigate early patterning and polarity of mammalian development, wild-type eight-week-old female ICR/CD1 mice (Laboratory Animal Facility, Tsinghua University, China) were used in our studies. Females were mated overnight with males and examined for vaginal plugs. The presence of a plug was taken as embryonic day 0.5 (E0.5 for short). Zygote, two-cell, four-cell, and blastocyst stage embryos were obtained at E0.5, early E1.5, late E1.5, and E3.5, respectively. Embryos were imaged in a droplet of human tubal fluid medium with 20% FBS (Hyclone, USA). For each embryo, about 70 optical slices were needed with a step of 1.2 µm. Using two phase-shifting modulation12 and averaging 30 images at the same depth, the total acquisition time for each embryo was about 90 s, with an imaging rate of 24 fps. Figure 1(b) shows 3D reconstruction of a zygote stage (E0.5) embryo, and the cross-section view in Fig. 1(c). Besides ZP, zygote, and 2PB, three relatively dark areas (DA1, DA2, and DA3) are also clearly visible. Two of them lie in the zygote and the third in the 2PB. 3D reconstruction of three dark areas segmented from the image stack is shown in Fig. 1(d). By the size, shape, and location, the dark areas were ascertained to be the nuclei. To confirm this, DNAs of the same embryo were stained with Hoechst 33342 and scanned with two-photon laser scanning microscopy (TPLSM). Figure 1(e) shows 3D reconstruction of three nuclei [from left to right, three nuclei are the nucleus of the 2PB (2PBN), female pronucleus (FPN), and male pronucleus (MPN), respectively].26 Owing to TPLSM’s capability of 3D quantitative measurement, a triangle, whose vertices are fluorescence centers of three nuclei, was characterized. The lengths of three sides were 19.1, 44.4 and 26.0 µm, respectively, shown in Fig. 1(e). In comparison, a similar triangle was also measured with FF-OCT. Its vertices were 3D geometry centers of the three dark areas in FF-OCT image, shown in Fig. 1(d). The corresponding side lengths of the triangle were measured to be 19.1, 44.0, and 25.7 µm, perfectly coincident with the TPLSM’s measurements with an accuracy of FF-OCT resolution. Furthermore, FF-OCT image gave essentially the same volumes of three dark areas as those of corresponding nuclei in TPLSM image. Therefore, we may affirm that the dark areas in the FF-OCT image are no other than the nuclei. On the other hand, chromatin is structurally loose during interphase, and its size is far below the wavelength of light. Therefore, the nucleus, whose main part is chromatin, has a low level of scattering signal and shows relatively dark in FF-OCT image. As different organelles have different scattering coefficients and thus give different grey-level signals, FF-OCT is also a functional imaging technique capable of distinguishing functional areas in a cell without any dye labeling. Fig. 2(a) A 2D image of a two-cell stage embryo with conventional 2D microscope. The first cleavage plane and BM2 do not clearly appear in the observation plane. (b) 3D reconstruction of the same embryo after rotational operation to the 3D dataset. Major structures are all clearly revealed. (c) 3D reconstruction of a four-cell stage embryo. Plane 1 where BM1 and BM2 contact with each other is observable. (d) At the opposite angle of view, Plane 2 where BM3 and BM4 contact with each other is observable. The two planes are nearly perpendicular to each other. (e) 3D reconstruction of a blastocyst (also shown in Video 1). (f) Cross-section view of the same blastocyst. Blastocoele, trophoblast, and ICM are clearly visible. (g) 3D reconstruction of the segmented nuclei of this blastocyst. Point O is the geometry center of the whole blastocyst and Point O′ is that of the ICM. Em-Ab axis is defined by the line which contains the two points O and O′. (Video 1, MOV, 3.7 MB). [URL: http://dx.doi.org/10.1117/1.JBO.17.7.070503.1].  Figure 2(a) shows a two-cell stage (early E1.5) embryo imaged by a conventional 2D microscope whose first cleavage plane, 2PB, and Blastomere 2 (BM2) do not clearly appear in the observation plane. However, FF-OCT can give a 3D digital dataset of an embryo. By some quantitative rotational operation to the 3D dataset, one can readily observe all the major structural information of two-cell embryo. The same embryo is shown in Fig. 2(b) with its ZP, 2PB, BM1, BM2, and the first cleavage plane clearly displayed. Therefore, no matter how the embryo orients in the observation plane, by FF-OCT imaging and image processing, one can make full use of all the sample embryos, without any exclusion of sample embryo due to improper orientation. 3D reconstruction of a four-cell stage (late E1.5) embryo is shown in Fig. 2(c) and 2(d). There are a total of six planes where cells contact with each other in this tetrahedral-shaped embryo. All six planes are able to be revealed at different angles of view, and one pair of them is shown in Fig. 2(c) and 2(d). The angle between these two planes is measured to be 87 deg, which is significant for normal embryonic development, because second two divisions have already decided the fates of blastomeres and the angle may be one of the reasons for this.7–9 Other parameters such as spatial locations, relative distances, and volumes of four blastomeres can also be precisely measured using the 3D dataset obtained with FF-OCT. 3D reconstruction of a blastocyst stage (E3.5) embryo is shown in Fig. 2(e), and the cross-section view in Fig. 2(f). The 3D view of the same embryo at different angles is demonstrated in Video 1. Besides blastocoele, the structure of inner cell mass (ICM), which is biologically defined as the mass of cells inside a blastocyst, and trophoblast, biologically defined as the cells forming the outer layer of a blastocyst, are also clearly visible. The segmented nuclei of ICM and trophoblast are shown in Fig. 2(g). The spatial locations of cells can be measured by calculating every center of the dark areas. The embryonic-abembryonic axis in Fig. 2(g) is then characterized by the line that contains the geometry centers of the whole blastocyst (marked with O) and inner cells (O′). Incorrect positioning of polarity axis due to the limitation of the traditional measurement may be one of the possible causes for the controversies in understanding early development, while accurate measurement of polarity axis with FF-OCT in this way is more reliable and may be the key to clarify them. In conclusion, FF-OCT, as a label-free 3D imaging technique, is demonstrated to image the mouse live embryos at various typical preimplantation stages with a spatial resolution of 0.7 µm and imaging rate of 24 fps. Factors that relate to early patterning and polarity such as pronuclei, ZP, 2PB, cleavage planes, and blastocyst axis are quantitatively measured. The angle between the two second cleavage planes is accurately measured to be 87 deg. FF-OCT offers a powerful methodology for the study of early patterning, polarity formation, and many other preimplantation-related research in the mammalian developmental biology. AcknowledgmentsThis work was sponsored in part by the Ministry of Science and Technology of China contracts 2006AA02Z472, 2007CB511904, 001CB510307 and 2009CB929400, by the National Natural Science Foundation of China Grants 90508001, 10676014 and 10574081, and by the Tsinghua Initiative Scientific Research Program 2010THZ01. ReferencesA. K. Tarkowski,
“Experiments on the development of isolated blastomeres of mouse eggs,”
Nature, 184
(4695), 1286
–1287
(1959). http://dx.doi.org/10.1038/1841286a0 NATUAS 0028-0836 Google Scholar
Y. TsunodaA. McLaren,
“Effect of various procedures on the viability of mouse embryos containing half the normal number of blastomeres,”
J. Reprod. Fertil., 69
(1), 315
–322
(1983). http://dx.doi.org/10.1530/jrf.0.0690315 JRPFA4 0022-4251 Google Scholar
M. A. CiemerychD. MesnardM. Zernicka-Goetz,
“Animal and vegetal poles of the mouse egg predict the polarity of the embryonic axis, yet are nonessential for development,”
Development, 127
(16), 3467
–3474
(2000). 68KCAI 0950-1991 Google Scholar
T. HiiragiD. Solter,
“First cleavage plane of the mouse egg is not predetermined but defined by the topology of the two apposing pronuclei,”
Nature, 430
(6997), 360
–364
(2004). http://dx.doi.org/10.1038/nature02595 NATUAS 0028-0836 Google Scholar
Y. Kurotakiet al.,
“Blastocyst axis is specified independently of early cell lineage but aligns with the ZP shape,”
Science, 316
(5825), 719
–723
(2007). http://dx.doi.org/10.1126/science.1138591 SCIEAS 0036-8075 Google Scholar
D. Grayet al.,
“First cleavage of the mouse embryos responds to change in egg shape at fertilisation,”
Curr. Biol., 14
(5), 397
–405
(2004). http://dx.doi.org/10.1016/j.cub.2004.02.031 CUBLE2 0960-9822 Google Scholar
K. PiotrowskaM. Zernicka-Goetz,
“Role for sperm in spatial patterning of early mouse embryos,”
Nature, 409
(6819), 517
–521
(2001). http://dx.doi.org/10.1038/35054069 NATUAS 0028-0836 Google Scholar
R. L. Gardner,
“Experimental analysis of second cleavage in the mouse,”
Hum. Reprod., 17
(12), 3178
–3189
(2002). http://dx.doi.org/10.1093/humrep/17.12.3178 HUREEE 0268-1161 Google Scholar
K. Piotrowskaet al.,
“Blastomeres arising from the first cleavage division have distinguishable fates in normal mouse development,”
Development, 128
(19), 3739
–3748
(2001). 68KCAI 0950-1991 Google Scholar
K. McDoleet al.,
“Lineage mapping the pre-implantation mouse embryo by two-photon microscopy, new insights into the segregation of cell fates,”
Dev. Biol., 355
(2), 239
–249
(2011). http://dx.doi.org/10.1016/j.ydbio.2011.04.024 DEBIAO 0012-1606 Google Scholar
M. Göppert-Mayer,
“Über Elementarakte mit zwei Quantensprüngen,”
Ann. Phys., 401
(3), 273
–294
(1931). http://dx.doi.org/10.1002/(ISSN)1521-3889 ANPYA2 0003-3804 Google Scholar
D. Sacchetet al.,
“Simultaneous dual-band ultra-high resolution full-field optical coherence tomography,”
Opt. Express, 16
(24), 19434
–19446
(2008). http://dx.doi.org/10.1364/OE.16.019434 OPEXFF 1094-4087 Google Scholar
W. Y. Ohet al.,
“Ultrahigh-resolution full-field optical coherence microscopy using InGaAs camera,”
Opt. Express, 14
(2), 726
–735
(2006). http://dx.doi.org/10.1364/OPEX.14.000726 OPEXFF 1094-4087 Google Scholar
A. Duboiset al.,
“Three-dimensional cellular-level imaging using full-field optical coherence tomography,”
Phys. Med. Biol., 49
(7), 1227
–1234
(2004). http://dx.doi.org/10.1088/0031-9155/49/7/010 PHMBA7 0031-9155 Google Scholar
K. Grieveet al.,
“In vivo anterior segment imaging in the rat eye with high speed white light full-field optical coherence tomography,”
Opt. Express, 13
(16), 6286
–6295
(2005). http://dx.doi.org/10.1364/OPEX.13.006286 OPEXFF 1094-4087 Google Scholar
K. Grieveet al.,
“Ocular tissue imaging using ultrahigh-resolution, full-field optical coherence tomography,”
Invest. Ophthalmol. Vis. Sci., 45
(11), 4126
–4131
(2004). http://dx.doi.org/10.1167/iovs.04-0584 IOVSDA 0146-0404 Google Scholar
A. Perea-Gomezet al.,
“Initiation of gastrulation in the mouse embryo is preceded by an apparent shift in the orientation of the anterior-posterior axis,”
Curr. Biol., 14
(3), 197
–207
(2004). CUBLE2 0960-9822 Google Scholar
A. Duboiset al.,
“Ultrahigh-resolution full-field optical coherence tomography,”
Appl. Opt., 43
(14), 2874
–2883
(2004). http://dx.doi.org/10.1364/AO.43.002874 APOPAI 0003-6935 Google Scholar
A. Dubois,
“Effects of phase change on reflection in phase-measuring interference microscopy,”
Appl. Opt., 43
(7), 1503
–1507
(2004). http://dx.doi.org/10.1364/AO.43.001503 APOPAI 0003-6935 Google Scholar
V. X. D. Yanget al.,
“High speed, wide velocity dynamic range Dopler Optical Coherence Tomography: imaging in vivo cardiac dynamics of Xenopus laevis,”
Opt. Express, 11
(14), 1650
–1658
(2003). http://dx.doi.org/10.1364/OE.11.001650 OPEXFF 1094-4087 Google Scholar
S. A. Boppartet al.,
“Investigation of developing embryonic morphology using optical coherence tomography,”
Dev. Biol., 177
(1), 54
–64
(1996). http://dx.doi.org/10.1006/dbio.1996.0144 0012-1606 Google Scholar
M. W. Jenkinset al.,
“Ultrahigh-speed optical coherence tomography imaging and visualization of the embryonic avian heart using a buffered Fourier Domain Mode Locked laser,”
Opt. Express, 15
(10), 6251
–6267
(2007). http://dx.doi.org/10.1364/OE.15.006251 OPEXFF 1094-4087 Google Scholar
M. W. Jenkinset al.,
“In vivo gated 4D imaging of the embryonic heart using optical coherence tomography,”
J. Biomed. Opt., 12
(3), 030505
(2007). http://dx.doi.org/10.1117/1.2747208 JBOPFO 1083-3668 Google Scholar
M. W. Jenkinset al.,
“4D embryonic cardiography using gated optical coherence tomography,”
Opt. Express, 14
(2), 736
–748
(2006). http://dx.doi.org/10.1364/OPEX.14.000736 OPEXFF 1094-4087 Google Scholar
I. V. Larinaet al.,
“Live imaging of rat embryos with Doppler swept-source optical coherence tomography,”
J. Biomed. Opt., 14
(5), 050506
(2009). http://dx.doi.org/10.1117/1.3241044 JBOPFO 1083-3668 Google Scholar
C. Bouniol-Balyet al.,
“Dynamic organization of DNA replication in one-cell mouse embryos: relationship to transcriptional activation,”
Exp. Cell Res., 236
(1), 201
–211
(1997). http://dx.doi.org/10.1006/excr.1997.3708 ECREAL 0014-4827 Google Scholar
|


