|
|
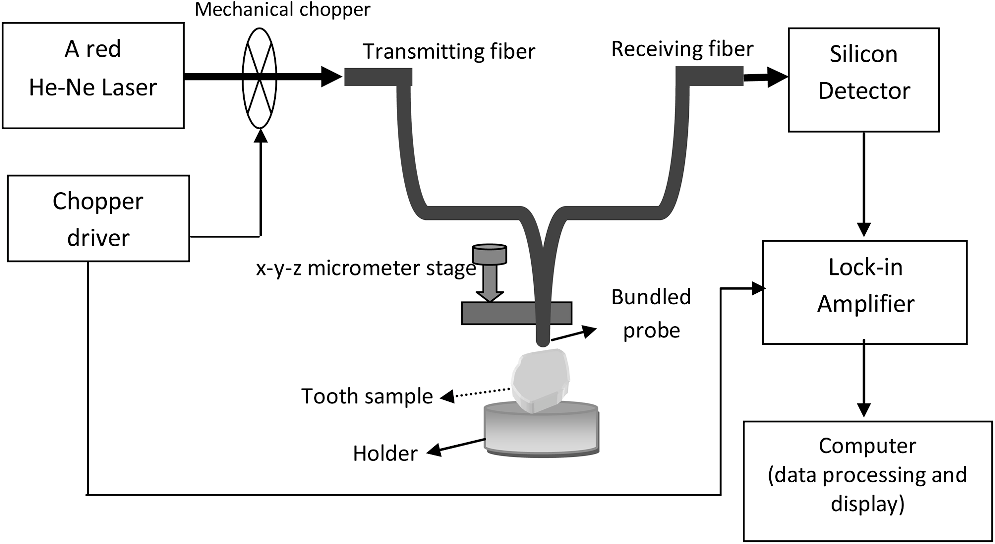
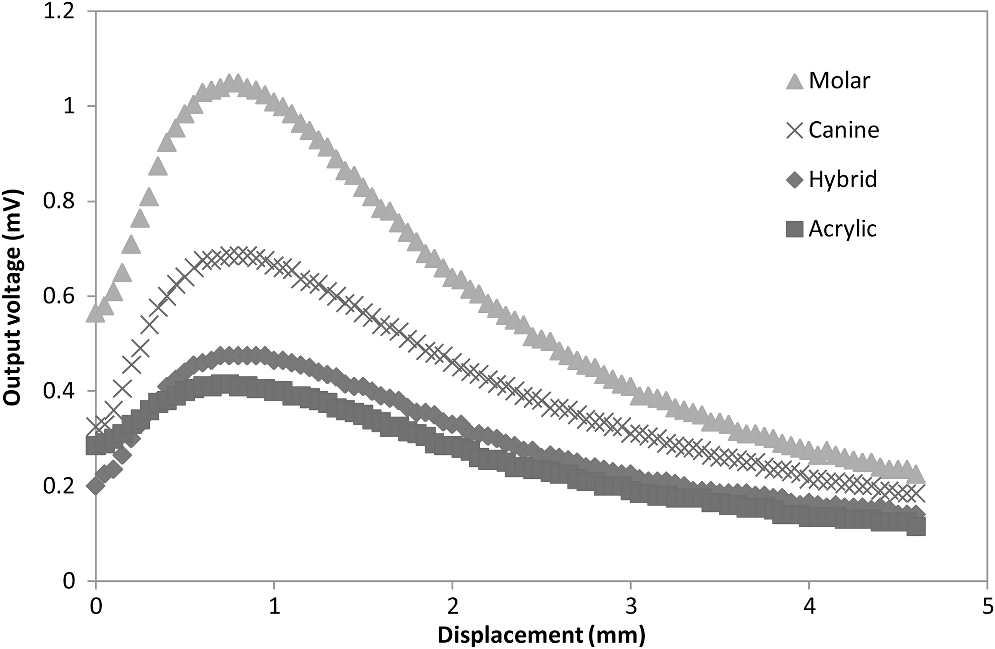
1.IntroductionIn dentistry, a successful restorative procedure depends strongly on the precise mapping of the shape of dental cavities. Impressional methods are often used for that purpose,1,2 but the impression material might suffer from shape and size deformity during the course of mapping, copying and storage, leading to defects in the process. This technique requires skilled workers, i.e., dental technicians to be able to fabricate precise restorations from the casts obtained by impression making. Several reports were made on the inherent impression inaccuracy and casting deficiency.3–5 In light of these significant constraints, there arises a need for a system and method for the digitization of the tooth surfaces which can be used for the restorations in a dental laboratory. Nowadays, most of the oral scanning devices for restorative dentistry are driven by noncontact optical technologies and principles. However, most of them are still under the clinical testing stages. One of the commercialized scanning devices uses the basic principles of confocal microscopy and active triangulation technique.6–8 Blue light-emitting diode (LED) is used to produce an illumination beam on the surface of the target object and a focusing system is used to focus the observation beam onto the image sensor. The system provides image stabilization systems and requires less than a minute to scan the surface of a tooth. Despite the advantages, the tooth surface needs to be coated with opportune powders before each scanning stage. Another commercialized technique employs a parallel confocal imaging technique and does not require coatings on the tooth surface due to the inclusion of a color wheel inside the acquisition unit which results in a larger scanner head compared to other systems.9,10 An entirely new method based on the principle of active wavefront sampling with structured light projection is employed in one of the recent scanning systems available. A highly complex optical system comprising of 22 lens systems and 192 blue light-emitting diode cells are used. The system allows the modeling of data in real time.9,11 Each of the foregoing systems suffer the drawback in which expensive specialized devices are required, hence hindering the widespread use of the systems, especially in developing countries. The aim of this work is to develop a methodology for an intensity modulated fiber optic displacement sensor (FODS) scanning system of tooth surface and apply it for the imaging of cavity. These type of sensors have been demonstrated to be efficient in different applications.12,13 They are inexpensive and simple to operate, hence opening the feasibility for enhancements in restorative dentistry to a wider international community. 2.Experimental SetupA scanning system was constructed as shown in Fig. 1. The system consists of a fiber optic transmitter, mechanical chopper, fiber optic probe, four teeth samples (consisting each of the molar, canine, hybrid composite resin, and acrylic sample), a silicon photodetector, lock-in amplifier and computer. The fiber optic probe was made of two 2 m long polymethyl methacrylate (PMMA) which consists of one transmitting fiber of 1 mm in diameter and 16 receiving fibers of 0.25 mm in diameter, numerical aperture of 0.5, core refractive index of 1.492, and cladding refractive index of 1.402. A red He-Ne laser () was used as the light source with an average output power of 5.5 mW, beam diameter of 0.80 mm, and beam divergence of 1.01 mRads. The photodetector used was a high speed silicon photodiode with an optical response extending from 400 to 1100 nm, making it compatible with a wide range of visible light including the 633 nm visible red He-Ne laser used in this set-up. The light source was modulated externally by a chopper with a frequency of 113 Hz as to avoid the harmonics from the line frequency which is about 50 to 60 Hz. The modulated light source was used in conjunction with a lock-in amplifier to reduce the dc drift and interference of ambient stray light. Two types of human teeth, namely molar and canine teeth were extracted and stored in water at room temperature one week prior to the experiments. In addition, acrylic resin teeth (GC Permacryl, Tokyo, Japan) and hybrid composite resin for anterior restoration (Light-Cured composite, GC Corporation, Tokyo, Japan) were also used as reflecting surfaces. Each of the teeth samples were drilled with holes to mimic dental cavities. In order to use this system for diameter quantification of the cavity, we exploited the differences in the reflected light between the cavity and surrounding tooth region. The displacement of the fiber optic probe was achieved by mounting it on a micrometer translation stage, which was rigidly attached to a vibration free table. Light from the fiber optic transmitter was coupled into the transmitting fiber. The signal from the receiving fiber was measured by moving the probe away from the zero point, where the flat reflective surface of the tooth and the probe are in close contact. The signal from the silicon photodetector was converted to voltage and was measured by a lock-in amplifier and computer via RS232 using a Delphi software. Each of the four teeth samples were used consecutively as the reflecting target while measuring the output intensity by changing the position of the fiber optic probe from 0 to 4.5 mm in a step of 0.05 mm. The probe was consequently fixed within the linear range of the displacement curve and the intensity of the collected light as a function of lateral movement ( and axis) of the tooth surface was recorded while being maintained in perpendicular and constant in axial position ( axis). The experiment was carried out with minimum successive steps of 0.5 mm for each of the tooth surface. Each of the samples were scanned two times, once before and once after the drilling of holes. Stability measurements were obtained by capturing a total of 100 output voltage readings continuously for 200 s while the fiber probe is fixed at a point on top of the surface. Lastly, the raw data were processed and transformed into two-dimensional (2-D) and three-dimensional (3-D) images using Matlab and were used for the detection of the tooth cavity. A total of 20 min were required to complete the scanning of the probe but the scanning time can be significantly reduced by the use of picomotor actuators. The experiment was repeated using all four different type of teeth surfaces. During the experiment, the temperature was kept constant at 25°C and the error due to this temperature variation is negligible. 3.Results and DiscussionsFigure 2 shows the reflected light intensity versus distance of the fiber optic probe from various reflecting teeth surfaces, namely molar, canine, hybrid composite resin, and acrylic. The displacement curves exhibit a maximum with a steep front slope while the back slope follows an almost inverse square law relationship. The signal is low at small distances, because the light cone does not reach the receiving fiber. When the displacement is increased, the size of the reflected cone of light at the plane of the fibers increases and starts overlapping with the core of the receiving fiber leading to a small detected output. Further increase in the displacement leads to large overlapping resulting in rapid increase in the output and reaches a maximum. The output after reaching the maximum starts decreasing for larger displacements due to large increase in the size of the light cone as the power density decreases with increase in the size of the cone of light. The received light intensity varies considerably among the various teeth surfaces due to the different reflectivity of the teeth surfaces. The reflectivity of molar, canine, hybrid composite resin, and acrylic teeth surfaces are obtained at 4.72%, 4.18%, 2.16%, and 1.82%, respectively, by comparing the powers of the light source before and after the reflecting surface. The features of the sensor for different teeth surfaces are summarized in Table 1. The sensitivity of the sensor is determined by a slope of straight line portion of the curves. As shown in Fig. 2, the sensor has two slopes; front and back slopes, with a higher sensitivity in the front slope. Based on the analysis of the front slope, the sensitivities and linear range for the molar, canine, hybrid composite resin, and acrylic surfaces are obtained at and 0.45 mm; and 0.4 mm; and 0.5 mm; and and 0.5 mm, respectively, with a good linearity of more than 99%. The peak voltages also decrease in the same order as the decrease in sensitivities which are 1.05, 0.685, 0.475, and 0.415 mV for the molar, canine, hybrid composite resin, and acrylic surfaces, respectively. The highest resolution of approximately 0.0025 mm (front slope) is obtained with the molar surface. The stability of the displacement sensor is also investigated and the measurement errors are observed to be less than 0.3%, 0.88%, 2.35%, and 0.67% for molar, canine, hybrid composite resin, and acrylic surfaces, respectively. Table 1The features of the fiber optic displacement (front slope) for various flat teeth surfaces.
2-D and 3-D imaging of the various teeth surface profiles were acquired by scanning the teeth surfaces at various lateral positions at a fixed distance of 0.25 mm between the fiber probe and the teeth surfaces. Figure 3(a) shows 2-D and 3-D views of the cavitated molar surface, which was obtained by lines of scanning along the row axis and column axis. The recorded signal from the cavity region is much more significantly reduced in amplitude than the surrounding region which occurs as result of a reduction in the reflected signal at that particular region. The intensity of the reflected light from the tooth surface depends upon the surface texture of the tooth and standoff distance between the surface and fiber tip. Thus, a smaller reflected signal amplitude is expected. The experiment is then repeated for canine, hybrid composite resin and acrylic surfaces with results as shown in Fig. 3(b)–3(d). The figures clearly show the difference in reflected amplitudes between the cavity region and the surrounding region, again verifying the imaging capabilities of the FODS on a tooth surface. Figure 4 shows the measured reflected signal taken along the same axis of a cavitated and uncavitated canine surface. The region of interest marked by the circle demonstrates the clear difference in the reflected signal between them. The diameter of the cavity is measured based on the total lateral displacements starting from the first occurrence of disparity in the reflected signals and ends with the coincidence of the signals. Taking into account the distance for each displacement which is 0.5 mm, the diameter is measured to be 2.5 mm, which is exactly the same value when measured with a micrometer. By using the same approach, the diameter of the cavity in the molar, hybrid composite resin, and acrylic surfaces are obtained to be 2.0, 2.5, and 2.0 mm, respectively, as summarized in Table 2. Fig. 32-D and 3-D surface profile of the (a) molar, (b) canine, (c) hybrid composite resin, and (d) acrylic surface showing a clear difference in the reflected signal between the cavity and its surrounding tooth region.  Table 2Diameter measurement of the cavity on the tooth surface using the fiber optic displacement sensor and micrometer.
These preliminary results indicate the capability of implementation of the displacement sensor for the imaging of dental cavity with an average error of less than 2.35%. Our results show that FODS scanning can simultaneously image the cavity of a tooth and measure its diameter in a sufficiently good enough resolution to be practical for clinical applications. In spite of the superior resolution and short scanning times of commercially available oral scanning devices for restorative dentistry,6–11 the majority of dental practitioners sort to the traditional way of making dental impressions for cavity restorations. This is due to the high equipment and maintenance cost involved in the devices. With the use of commercially available fiber, source and detector for the proposed technique, the set-up proves to be simple, sensitive, low cost and versatile, which can be readily adopted for computer-aided design/computer-aided manufacturing systems or used as master models for the restoration in a dental laboratory. Furthermore, the proposed system has the potential to determine the depth of a cavity since the output voltage varies accordingly with the distance between the probe and reflecting surface. The main weakness of the FODS scanning and imaging system in comparison with commercially available dental imaging is the comparatively longer scanning time. The displacements of the fiber probe were manually done hence resulting in approximately 20 min per complete scan. This however can be solved by the use of picomotor actuators which can significantly reduce the scanning time depending on the type used. The sensor proves to be simple and easy to be implemented. However, in order to cater for higher resolution requirements, additional computer vision techniques and algorithms need to be implemented for the matching computations at each position of the output disparity. The threshold for the output disparity need to be clearly defined based on extensive analysis of a larger amount of data with higher sampling rate. 4.ConclusionsA simple, low cost, and very efficient fiber optic scanning and imaging system is proposed. The system is based on intensity modulation technique and uses a multimode plastic bundled fiber as a probe and He-Ne laser as a light source. The sensitivities and linear range for the molar, canine, hybrid composite resin, and acrylic surfaces are obtained at and 0.45 mm; and 0.4 mm; and 0.5 mm; and and 0.5 mm, respectively, with a good linearity of more than 99%. The results prove that the FODS is a viable imaging mechanism of tooth cavity. With the use of commercially low cost components and equipment, the set-up proves to be simple and sensitive and may result in a more widespread use. The development of this technology has many potential applications in dentistry and may radically change diagnostic imaging for dental restorations. AcknowledgmentsThe authors are grateful to Dr. Suhaila Abdullah and Dr. Mohd Noor Fareezul Noor Shahidan for providing the human teeth samples used in this experiment. This work is financially supported by University of Malaya under PPP grant scheme (No.: PV033/2011A) and HIR-MOHE (No: D0000009-16001). ReferencesB. Y. JungK. W. Lee,
“Alternative impression technique for multiple abutments in difficult case to control,”
J. Adv. Prosthodont., 2
(1), 1
–3
(2010). Google Scholar
S. RaoR. ChowdharyS. Mahoorkar,
“A systematic review of impression technique for conventional complete denture,”
J. Indian Prosthodont. Soc., 10
(2), 105
–111
(2010). http://dx.doi.org/10.1007/s13191-010-0020-2 0972-4052 Google Scholar
R. W. WassellD. BarkerA. W. G. Walls,
“Crowns and other extra-coronal restorations: impression materials and technique,”
Br. Dent. J., 192
(12), 679
–690
(2002). http://dx.doi.org/10.1038/sj.bdj.4801456 Google Scholar
N. Sametet al.,
“A clinical evaluation of fixed partial denture impressions,”
J. Prosthet. Dent., 94
(2), 112
–117
(2005). http://dx.doi.org/10.1016/j.prosdent.2005.05.002 JPDEAT 0022-3913 Google Scholar
R. G. Luthardtet al.,
“Qualitative computer aided evaluation of dental impressions in vivo,”
Dent. Mater. J., 22
(1), 69
–76
(2006). DMJOD5 Google Scholar
N. S. Birnbaumet al.,
“3D digital scanners: a high-tech approach to more accurate dental impressions,”
Inside Dent., 5
(4), 70
–74
(2009). Google Scholar
S. W. Harunet al.,
“Estimation of metal surface roughness using fiber optic displacement sensor,”
Laser Phys. Lett., 20
(4), 904
–909
(2010). http://dx.doi.org/10.1134/S1054660X10070091 1612-2011 Google Scholar
M. Yasinet al.,
“Detection of tea concentration macerated onto the artificial teeth using fiber optic displacement sensor,”
J. Optoelectron. Biomed. Mater., 1
(1), 1
–4
(2010). Google Scholar
|