
|
|
1.IntroductionLung diseases, such as the acute respiratory distress syndrome (ARDS) or acute lung injury (ALI), lead to life-threatening conditions for patients. Although varying, the mortality rate is still between 30% and 70%,1 depending on the treatment. To overcome the lack of oxygenation, patients suffering from ARDS are artificially ventilated. So far this treatment is indispensable, but in return introduces further ventilator associated lung injury (VILI).2,3 Although there are several models, which describe the processes occurring in the lung during artificial ventilation of these patients,1,4,5 and several protective artificial ventilation techniques used in the clinics,6,7 the high mortality is a sign for the lack of understanding of basic mechanisms in lung dynamics on an alveolar level. Furthermore, understanding the fundamental processes would help to optimize ventilation settings for a protective treatment of patients with lung failure. Realistic descriptions of lung dynamics, dealing with conformational changes of the tissue and elastic components of the extra-cellular matrix (ECM), are still missing. In order to obtain insight into dynamic processes in the lung, we asked how structural and functional studies, including the distribution of elastic fibers within the lung parenchyma, can be performed minimal invasively. Noninvasive techniques for obtaining structural data of the lung are given on the one hand by computed tomography (CT) and magnetic resonance imaging (MRI).8 The resolution of these methodologies lies in the range of millimeters and is therefore not suited for alveolar tissue studies. On the other hand, three-dimensional (3-D) high-resolution techniques, such as μCT and electron microscopy, provide very good structural data of the alveolar walls.9,10 Unfortunately, these methods are restricted to the investigation of fixed samples and are therefore not applicable to dynamic studies under in vivo conditions. Recently, a very promising approach used nonlinear imaging techniques, such as two-photon excited fluorescence and second harmonic generation, to visualize fiber structures in fixed lung tissue within three dimensions.11 In this study, 3-D images are obtained with a scanning rate of 4 kHz. In vivo application is therefore hampered by the rather slow image acquisition, making dynamic studies challenging. The only method established so far, which is capable of real-time in vivo lung tissue dynamics visualization, is intravital microscopy (IVM). By dissecting the whole or part of the chest wall of the studied animal model, the alveolar dynamics can be monitored and tissue deformations are revealed in two-dimensional image sequences.12 Since this method offers a planar view onto the alveoli, the images are disturbed by movements during respiration, and the focus of the camera has to be readjusted to the plane, which is under observation. Furthermore, the monitored dynamics are restricted to two dimensions and can only be extrapolated to three dimensions by assuming isotropic expansion. IVM is therefore very suitable for real-time imaging but is restricted to two-dimensional (2-D) studies only. New approaches use optical coherence tomography for in vivo studies of lung mechanics.13 These attempts describe the lung’s alveolar structure within three dimensions. Furthermore, the fast imaging ability of OCT is potentially able to follow a whole ventilation cycle with up to 14 volumes per second.14 With this, the monitoring of 3-D real-time volume changes of alveoli becomes accessible. However, besides all its benefits, this technique still lacks functional information about the biological composition of the sample. Due to the unspecific imaging ability of OCT, elastic fibers, composed of distinct biomolecules, such as elastin and collagen, cannot be identified. Studying the interplay between the distribution of elastic components and the tissue distension is out of scope with this method alone. To overcome this limitation, combined setups were proposed using fluorescence signals from endogenous structures, as demonstrated in light induced fluorescence studies,15 or from endogenously expressed fluorescent molecules; for example, by utilizing green fluorescent protein (GFP).16 Commercially available instruments, like the Spectralis (Heidelberg Engineering, Germany), use confocal scanning laser ophthalmoscopy (SLO) to look e.g., at the fundus autofluorescence signal of the retina in combination with 3-D imaging via OCT.17 The above-mentioned techniques mainly obtained 2-D fluorescence data to improve diagnostics and orientation within the sample. Early setups combined two-photon microscopy and optical coherence microscopy (OCM), where the same light source was used for OCT imaging as well as fluorescence excitation.18 Both modalities deployed the same numerical aperture resulting, on the one hand, in a high lateral resolution, but, on the other hand, leading to a restricted imaging depth for the OCM. The benefit of a fast 3-D imaging technique was therefore exchanged for supplemental functional information. In this work we demonstrate a hybrid OCT and confocal fluorescence microscopy (CFM) system using a two-resolution approach for maintaining the high imaging depth of the OCT and the high lateral resolution for the fluorescence microscopy modality. Both methods work simultaneously by acquiring one 2-D confocal fluorescence image per 3-D OCT stack. Via subsequent axial displacement, using a piezo-driven microscope objective, the 3-D CFM information is generated. In a first case study, structural and functional 3-D data of lung tissue was derived for an in situ mouse model ventilated with different constant pressures. The volume changes as well as the elastic fiber distensions were quantified and discussed. By utilizing the fast imaging ability along the -axis of the OCT technique in combination with appropriate image processing, we aspire to reduce motion artifacts in the fluorescence images via sorting into the cross-sectional OCT images. This approach shall allow for respiration triggered 3-D structural and functional alveolar dynamics investigations and can also be extended to high-speed four-dimensional (4-D) imaging using faster OCT-Systems. 2.Materials and Methods2.1.Optical SetupThree-dimensional simultaneous optical coherence tomography and 2-D confocal fluorescence microscopy is provided in one setup. The design was chosen to be modular for flexible interchangeability and adjustment to suit different experimental demands. Three main parts can be specified (Fig. 1): first, the OCT light source and detection system; second, the scanner head; and third, the fluorescence excitation and detection setup. The expansion to a 3-D fluorescence image acquisition was done by introducing a piezo-driven objective stage to the scanner head. The system uses two distinct numerical apertures for the different imaging modalities to assure high depth of field in the case of OCT and sufficiently high resolution for fluorescence microscopy to resolve micrometer sized elastic fiber bundles in the lung tissue. Fig. 1Combined OCT and confocal fluorescence microscopy setup for simultaneous 3-D data acquisition. The system contains three major parts: OCT light source and spectrometer, the laser coupling and fluorescence detection system, and the scanner head. The OCT uses a light source centered at 843 nm and provides a 11.88 kHz A-scan rate due to the line scan rate of the CCD line detector. Fluorescence excitation is provided for dyes excitable at 488 and 561 nm utilizing diode-pumped solid-state (DPSS) lasers, where the detection channels are centered at 525 nm (BP1) and 641 nm (BP2) with a spectral bandwidth of 50 and 75 nm, respectively. The fluorescence signal is detected using avalanche photodiodes (APD). Near-infrared light from the super luminescent diode (SLD) as well as visible light from the DPSS lasers is combined within the scanner head at a dichroic mirror (DC2). For OCT, a Michelson interferometer, consisting of a beam splitter (BS) and a reference as well as sample arm, is inserted into the beam path. Data acquisition is performed simultaneously by using the same scanners (SC) and the sample beam path of the OCT modality. Within the zoomed area the utilization of two different numerical apertures (N.A.) is shown as a prerequisite for the combination of both imaging methods. Via underfilling of the objective’s back aperture, the OCT modality uses an N.A. of 0.08, resulting in an extended depth of field and therefore higher imaging depth than the CFM modality utilizing an N.A. of 0.45. The higher N.A. results in an increased resolution for the fluorescence system. Fluorescence light is recollected behind the dichroic mirror at the glass fiber, where the aperture of the fiber serves as a pinhole to establish the confocality of the CFM method. Abbreviations: APD (alanche photodiode), BP1 (band-pass emission filter ), BP2 (band-pass emission filter ), BS (beam splitter), C (circulator), CCD (line sensor), DC1 (dichroic mirror [long-pass 491 nm]), DC2 (dichroic mirror [short-pass 790 nm]), G (diffraction grating), GP (glass plates for dispersion adjustment), LP (long-pass mirror 585 nm), M1 (silver mirror), M2 (reference mirror), O (microscope objective), P (glass prisms for dispersion adjustment), PC (polychroic mirror with 488 and 561 nm reflection), PE (piezo element), S (sample), SC (-scanner), SLD (super luminescent diode at 840 nm and spectral width of 50 nm).  The OCT system is based on a spectral domain setup. Broadband near-infrared light at [center wavelength 843 nm, full-width-half-maximum (FWHM) bandwidth 50 nm] with a power of 1 mW is emitted by a superluminescent diode (Superlum Moscow, Russia) and coupled into a circulator. Behind the circulator, the light is guided via a connected single mode fiber to the scanner head. Passing a beam splitter, a separation occurs into a reference beam and a sample beam. The reference arm carries additional glass plates (N-BK7 of 5 mm thickness, SF6 of 6.35 mm thickness) and a prism box (N-BK7 of 13.95 mm thickness), allowing dispersion compensation for the optical components located in the sample arm. Since second-order dispersion decreases the axial resolution in an OCT system, the dispersion between the reference arm and the sample arm was balanced according to the minimization of the second-order derivative of the optical path difference between the two traveling paths.19 As mentioned before, this was carried out by inserting additional glass into the reference arm with suitable dispersion and thickness. Upon splitting, the sample beam gets reflected by a dichroic NIR/VIS mirror passes an -scanning unit and, after beam expansion through a telescope configuration of lenses, is imaged onto the sample using a N. A. objective (Olympus, Japan). Since the OCT beam radius amounts to 1.5 mm at the rear aperture of the objective, the N.A. used for this imaging modality is reduced to a value of 0.08, providing a slim focus and a high imaging depth. After reflection at the reference mirror and the sample, respectively, reference and sample light are recombined at the beam splitter where an interference of the two light beams takes place. Recollected at the single mode fiber, the light passes the circulator and is imaged onto a diffraction grating, which splits the light into its wavelength constituents. The interference spectrum is recorded using a CCD line scan detector (Teledyne Dalsa, Canada) with an A-scan rate of 11.88 kHz. For the confocal fluorescence imaging the light of two excitation lasers (Coherent, USA), 488 nm and 561 nm with each having a maximum power of 20 mW, is combined and coupled into a single mode fiber. At the scanner head it passes the NIR/VIS dichroic mirror and uses the same beam path as the OCT sample beam. The beam diameter for the fluorescence excitation amounts to 9 mm, thereby overfilling the rear aperture of the microscope objective and causing a full N.A. of 0.45. Fluorescence light is recollected, traverses the VIS/NIR mirror and is imaged onto the aperture of the single mode fiber, which is serving as a pinhole for establishing the confocal functionality. Behind the fiber the fluorescence signal is split into a red and green detection channel and is recorded via two avalanche photo diodes (Laser Components, Germany) where additional emission filters, with transmission from 500 to 550 nm and 603 to 679 nm, respectively, block additional stray light from the laser excitation. 2.2.Mouse ModelA recently developed mouse model introduced by Tabuchi et al.20 was used post mortem according to the guidelines of the local government’s animal care authorities. Briefly, mice were anesthetized and intravenously stained with 50 μl of a solution of sulforhodamine B (SRB) in saline water. The fluorescent dye SRB was previously shown to stain elastin fibers and is suited for future in vivo applications.21 After sacrificing the animal, a tracheal tube was introduced to the trachea for pressure-controlled ventilation. The chest was opened to gain access to the upper surface of the lung, thereby causing a collapse of the organ. To re-establish the physiological environment within the chest, an intrathoracic catheter was pushed from the inside to the outside of the thorax, and the previously opened chest was closed using a transparent wrapping film glued to the ribcage. Afterward, the negative pressure in the thorax was reconstituted by removal of excess air. For applying different pressure values to the mouse model, a 1 ml syringe was connected to one arm of a -piece tubing. The second arm carried a differential pressure sensor, and the third arm was connected to the trachea tube of the mouse. 2.3.Image Acquisition and ProcessingImage acquisition was performed using analogue to digital converters (DAQmx, National Instruments, USA) and custom-built software developed with LabVIEW 2009 (National Instruments, USA). The acquired spectrum was transformed to be linear in wavenumber (k) space since the light distribution on the CCD is approximately linear in wavelength space due to the diffraction grating and further influenced by the chromatic aberrations of the applied spectrometer optics. With an evenly -spaced spectrum applying fast Fourier transformation (FFT) is now possible.22 To reduce the side lobes of the Fourier transformed signal, the detected spectrum was shaped to a Hanning distribution by dividing the detected spectrum by the spectrum of the light source and multiplication with a Hanning window prior to the transformation. Subsequently the modified signal underwent the FFT revealing the intensity over depth profile for each scan. Fluorescence intensity images of the focal plane were recorded simultaneously. By driving the piezo objective stage in steps of 3 μm, subsequent planes were obtained to form a 3-D datacube. For both modalities the lateral step size is mainly determined by the lateral resolution of the fluorescence modality, the selected field of view and the desired scanning duration. The value was set to 1.2 μm of lateral displacement to investigate a tissue area within 9.5 s. SRB imaging was performed using the 561 nm laser at and a single detection channel in the red spectral range. To allow registration between OCT and fluorescence images, a correlation-based algorithm was applied sorting each single fluorescence plane into the 3-D OCT stack to the z position of maximum similarity between OCT en face and CFM slices. The algorithm was previously described for the mapping of OCT slices into the fluorescence stack of a static sample,23 but can be performed also vice versa. For this reason, the planes of fluorescence, which had a distance of 4.2 μm in tissue, which is approximately the OCT pixel size in depth, were sorted into the 3-D OCT stack, and an interpolation was done to allow pixel-by-pixel mapping between both modalities along the axial direction. After mapping, the CFM and OCT stacks were rescaled providing voxel sizes of . Further image processing and 3-D visualization was performed using ImageJ (National Institute of Health, USA). Alveolar volume segmentation was done via convolution of the data with a Kernel, setting of a defined threshold, which allows a delineation of the alveolar lumen [see results section], and utilizing the ImageJ plugin particle analysis calculating the air-filled space within the alveoli for every -position. The 3-D segmentation of fibers was performed using the ImageJ plugin simple neurite tracer.24 The images of the alveoli as well as the fibers, used for quantification, are displayed and discussed in the results section. 3.Results3.1.Setup EvaluationThe sensitivity of the OCT modality was measured using a silver mirror as a sample and a -14 dB attenuator in the sample arm. With a power of 260 μW at the focal position of the microscope objective, a signal-to-noise ratio of 62 dB was determined for a single A-Scan. Adding 28 dB of attenuation in the sample arm the sensitivity resulted in 90 dB. The imaging performance of the combined OCT and CFM setup was tested using an USAF-1951-target. Since this target has a micrometer-sized metalized pattern, the lateral OCT resolution can be determined according to the specified distance of the line pairs, which appear bright in the OCT image [Fig. 2(a)]. An intensity profile plot along the group 7 elements 4, 5, and 6 of the USAF-1951-target [Fig. 2(d), data of the left intensity scale] visualizes the resolvability of the line pairs. The three line pairs are distinguishable in elements 4 and 5 but not in element 6 of group 7. The line pairs of group 7 element 5, corresponding with a distance of 4.9 μm, therefore provide the limit for the lateral resolution of the OCT System. For determining the lateral resolution of the CFM modality, the USAF-target was laid upside-down onto a red fluorescence slide (Chroma, USA). Scanning with an excitation wavelength of 561 nm yields an absorption image where the pattern appears dark [Fig. 2(b)]. Merging both signals into an RGB image, OCT in the red channel and the inverted CFM image in the green channel, the overlay of both modalities is revealed by a yellow color [Fig. 2(c)]. Lateral mismatches between OCT and CFM were determined to be in the range of 3.6 μm [Fig. 2(e)]. Since this mismatch is smaller than the resolution of the OCT setup, the correlation algorithm, which is mapping the fluorescence slices into the 3-D OCT stack, can be applied without great disturbance. Fig. 2Lateral resolution determination using an USAF-1951-target. The OCT reflection image (a) as well as the fluorescence image (b) were obtained simultaneously by laying the target upside down onto a fluorescence slide. An RGB overlay with OCT in the red channel and the inverted CFM image in the green channel (c) showed good lateral alignment of both imaging modalities. For the determination of the lateral resolution the vertical lines of the group 7 elements 4, 5, and 6 were used to generate an intensity profile plot along these structures (d) for both OCT (left intensity scale) and CFM (right intensity scale). The resolution limit for OCT was determined by element 5, resulting in a resolution of 4.9 μm. For CFM a lateral resolution of better than 4.4 μm could be confirmed, since this is the smallest distance within the target. For a better evaluation of the lateral CFM resolution, the diffraction limited dimensions of 100 nm-sized fluorescent nanoparticles (Fig. 3) were additionally determined. A maximum lateral mismatch between both imaging modalities can be quantified within the group 6 element 1 structure shown in (c). An intensity profile plot perpendicular to the horizontal lines (e) reveals a line distance between OCT and CFM of 3.6 μm. Lines between the data points of (d) and (e) are guides to the eye. 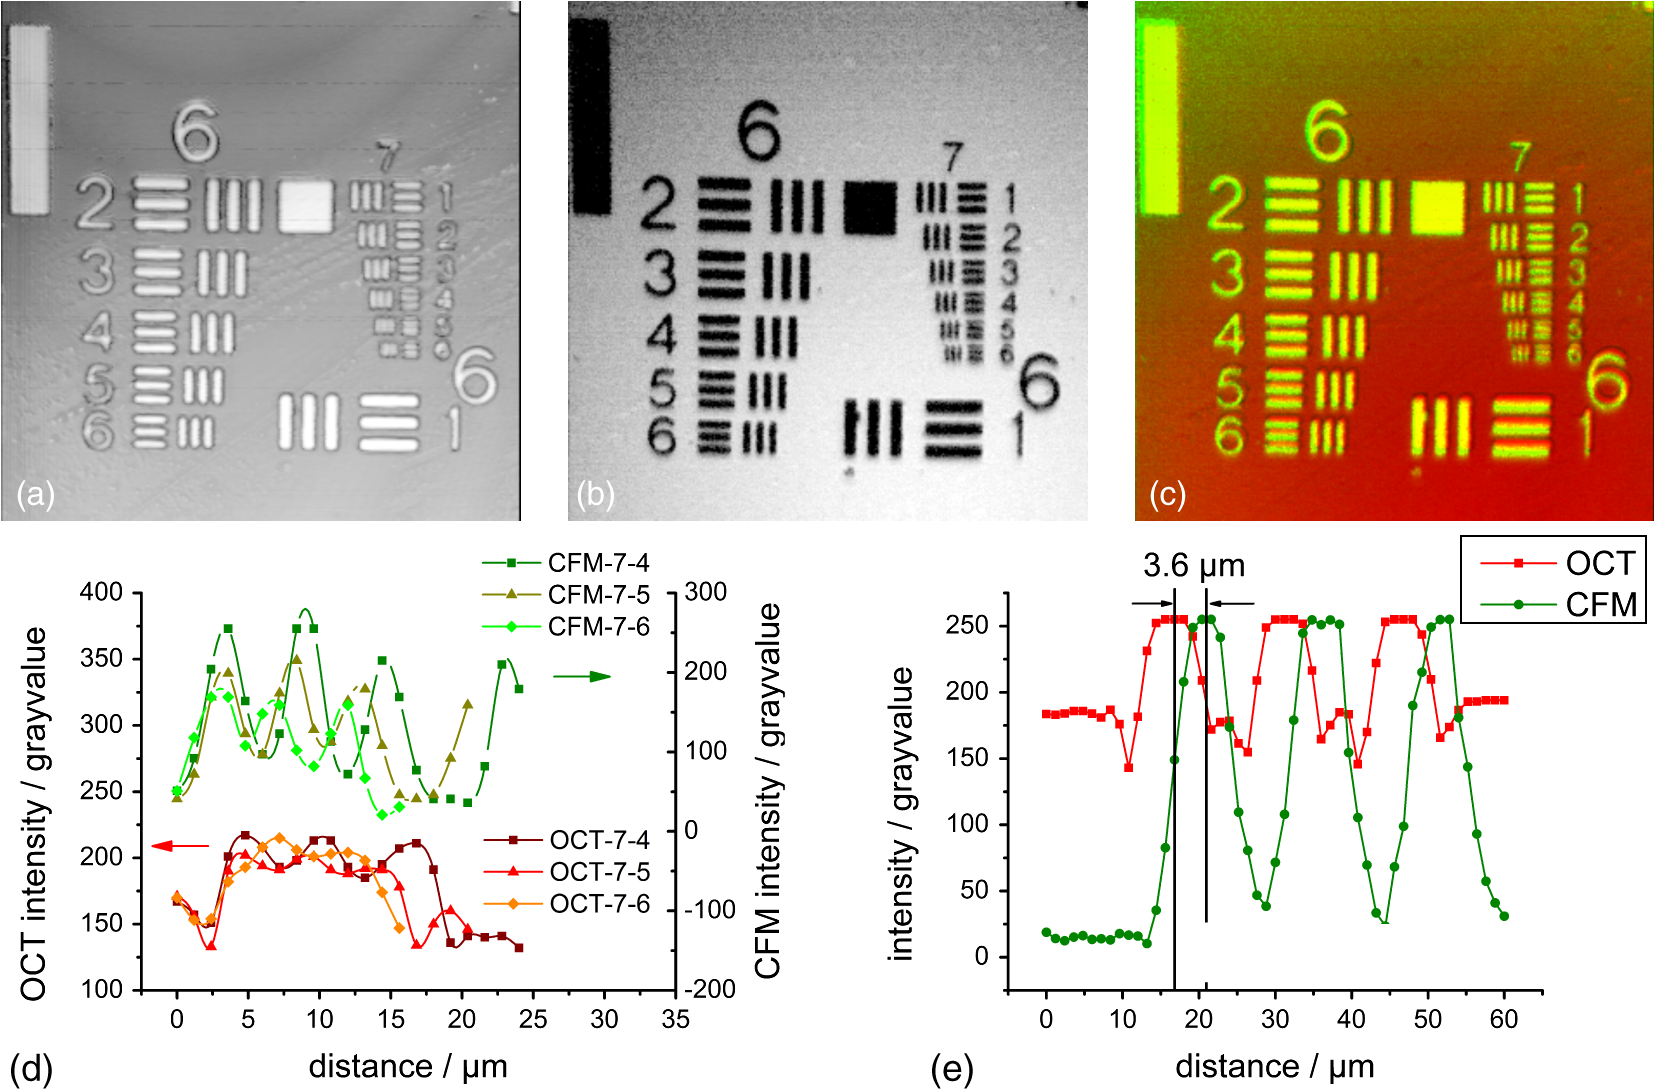 From the intensity profile plots of the fluorescence image [Fig. 2(d), data of the right intensity scale] the three smallest elements (group 7, elements 4, 5, and 6) could easily be resolved. The smallest structure corresponds with a line pair distance of 4.4 μm, the resolution capability of the target was therefore not sufficient for an exact estimate. Hence the point spread function of the CFM modality was determined using fluorescent nanoparticles (nano-screenMAG/R-ARA, Chemicell, Germany) with a diameter of 100 nm dried on a glass substrate [Fig. 3(a)]. The lateral and axial intensity profiles of 10 distinct nanoparticles were approximated by a Gaussian function revealing in average a lateral FWHM of and an axial FWHM of (errors expressed as SEM). Data are provided for one exemplary nanoparticle [Fig. 3(b) and 3(c)]. With this, the dual lateral resolution modality was verified, providing a large depth of field for OCT yielding higher imaging depth and a small depth of field but strong focusing for increased CFM resolution. Fig. 3Lateral and axial resolution determination of the CFM modality using fluorescent nanoparticles with a diameter of 100 nm. A monolayer of particles (a) was imaged three-dimensionally revealing a Gaussian intensity distribution into the lateral (b) and axial (c) direction, respectively. The lateral FWHM was determined to be 0.75 μm, the axial FWHM amounts to 5.9 μm. Data are shown for the nanoparticle surrounded by the white box in (a). for the large field of view of (a) and 1 μm for the enlarged region, respectively.  To determine the axial resolution, the OCT setup has been calibrated using a target with a single back reflection plane (glass plate with 5 mm thickness). By changing the focus and measuring the traveling distance, a scaling of 5.4 μm per depth pixel could be obtained. The full width at half maximum of the back reflection signal of the glass plate showed a value of approximately 2 pixels. The axial free space resolution therefore amounts to 10.8 μm. Taken into account the refractive index of lung tissue being close to water (1.333), the axial resolution in the tissue amounts to 7.5 μm for the OCT modality. 3.2.In Situ Imaging of Mouse LungTo monitor the dynamical behavior of the lung, we used the combined setup for simultaneous imaging of alveolar geometries and elastin fibers with SRB as a fluorescent marker. Figure 4 shows the 3-D data of the structure at an airway pressure of 6 mbar. OCT data is displayed as gray values whereas CFM data is false colored in red. Three-dimensional registration between OCT and CFM was performed using the above-mentioned mapping algorithm. In Fig. 4 a cross-sectional image of the alveolar tissue is demonstrated with the OCT modality whereas fiber distributions are given by the CFM. The upper serous membrane of the lung, the visceral pleura, is visible as a bright reflecting line. Subpleural alveoli are following underneath. For three distinct depth planes–0, 12, and 24 μm under the middle of the visceral pleura–the corresponding CFM, OCT, and overlay images were extracted, Fig. 4 right-hand side. The first depth (Fig. 4 first row) shows details of the visceral pleura. OCT data shows the bright reflex coming from the dense serous membrane whereas the confocal fluorescence microscopy reveals an intertwined meshwork of elastin fibers, which is covering the alveolar tissue. Approximately 12 μm under the pleura (Fig. 4 middle row) the alveolar structures become apparent in the optical coherence tomography image. The walls of the alveoli are intersected by elastin fibers, as it is visible in the fluorescence data. Furthermore, dense elastin concentrations appear at the edges of neighboring alveoli together with interconnecting fibers suggesting coiled elastin fibers, which could expand during the recruitment. In a depth of 24 μm the OCT still shows alveolar structures, where the CFM merely reveals blurred outlines of elastin fibers. Following analysis of fiber length, changes are therefore restricted to the pleural region and the upper half of subpleural alveoli. For analysis, 12 alveoli were chosen from every pressure step as well as 14 fibers surrounding those alveoli. The selection is displayed in Fig. 5(a) for the alveoli and 5(b) for the fibers, respectively. The quantification of the alveolar volume change and the fiber stretching during increase of ventilation pressure revealed a similar behavior for both parameters [Fig. 5(c)]. Data points of the volume change can be fitted with a sigmoid curve, which is found as a good approximation in studies of macroscopic lung function25 and intravital microscopy studies.5 Assuming similar behavior between the volume change and the fiber change, a sigmoid function can also be fitted to the fiber length distension data. The average alveolar volume at 0 mbar was determined as , the average fiber length as . By extracting the slope at the inflection point of the volume’s sigmoid function, a normalized alveolar compliance of 0.19 can be obtained. Fig. 4Visualization of the combined structural and functional data revealed through the new setup. Fluorescence data was acquired using sulforhodamine B as an elastin fiber staining dye. Left-hand side: A cross-sectional impression of a mouse lung tissue. OCT data is displayed in gray scale, CFM data in red. The blue lines indicate the positions of the extracted en face images shown on the right-hand side. Right-hand side: Extracted CFM, OCT, and overlay images (columns) for different horizontal planes of the lung tissue (rows) at 0, 12, and 24 μm under the middle of the visceral pleura. The first row is attributed to the pleura itself where OCT shows a bright reflection, whereas the fluorescence microscopy reveals a dense elastin meshwork. The second and third row indicates the geometrical features of the tissue, which was obtained using the OCT modality. Complementary to this, confocal fluorescence imaging reveals the distribution of elastin fibers lining the alveolar walls. .  Fig. 5Delineation for the analyzed alveoli (a) and starting as well as ending point for the fiber length segmentation of the surrounding fibers (b) at the empirically found threshold level shown exemplarily for one plane of the OCT stack (18 μm below the pleura) and one plane of the CFM stack (3.6 μm below the pleura) at 0 mbar pressure. The stacks were rotated to allow optical sectioning parallel to the pleural surface. After rotation, the view was resized to fit the whole volume where empty areas were filled black. Numbers indicate the alveoli and fibers taken for analysis. More than one fiber per alveolus is indicated as *.1 and *.2 etc. The alveoli and fibers were chosen according to their presence in every pressure step, since some were traveling out of the field of view due to the movement of the lung at higher-pressure values. (c) Alveolar volume change (gray dots with a scale on the right) and fiber stretching (black squares with a scale on the left) normalized to the value given at 0 mbar. During expansion of the tissue both parameters show the similar behavior of a sigmoid increase. Error bars are displayed as standard error of the mean for 10 alveoli and 14 fibers within the tissue of one mouse lung. (d) Double logarithmic representation of the relative volume change over the relative fiber-length change. Experimental data is shown as black squares; data from the fitted sigmoid functions is shown as a gray line. Isotropic expansion would lead to a linear function with a slope value of 3 (dashed line). Since neither the data nor the fit based interpolation correspond with the isotropic function, a homogeneous distension of the alveolar tissue is unlikely. . 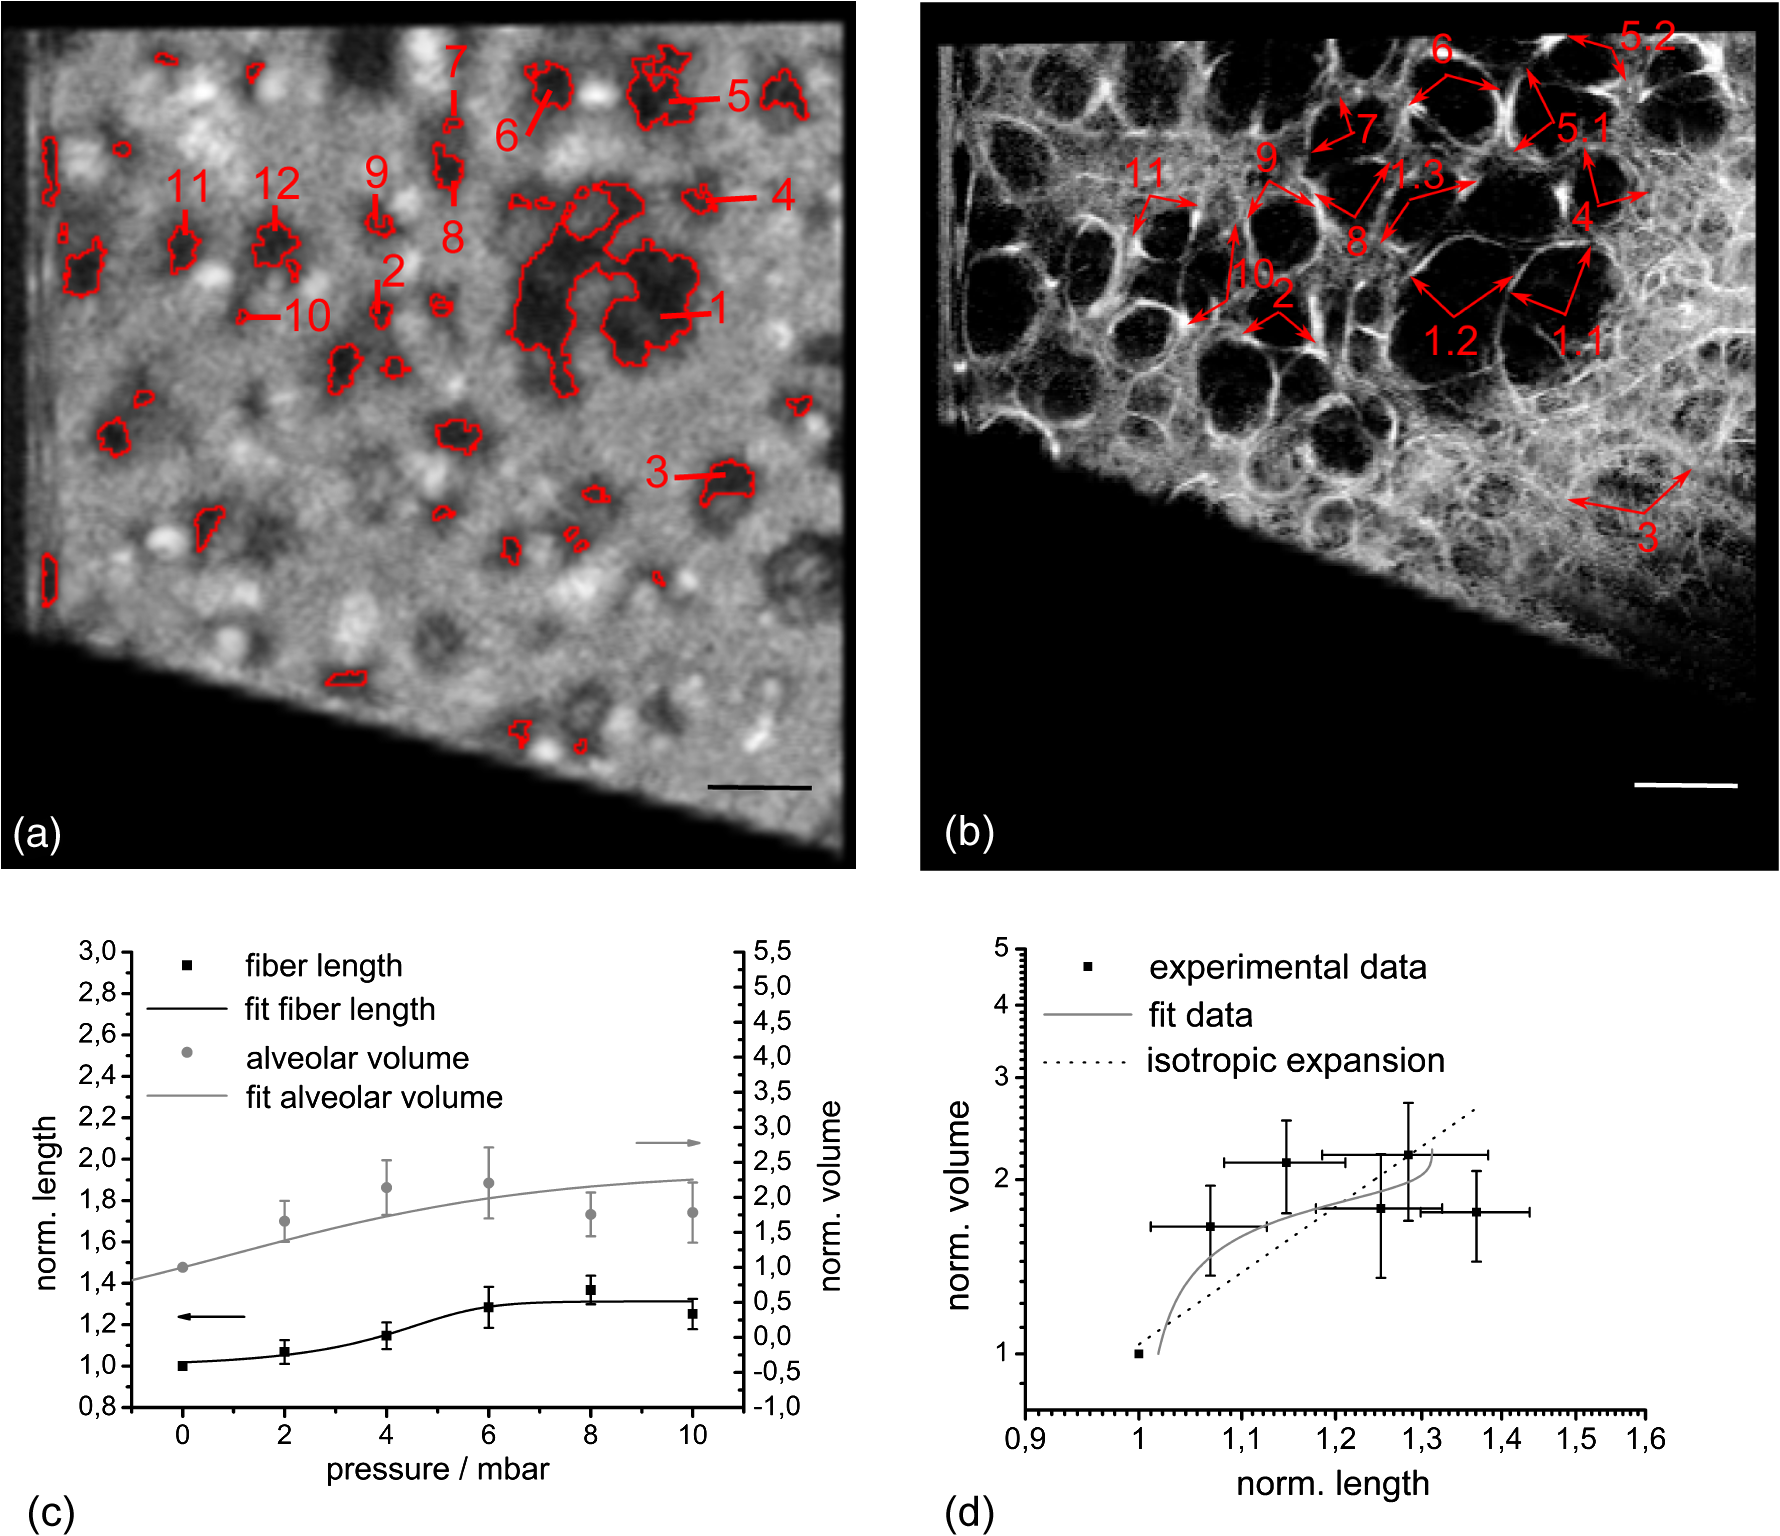 For an isotropic expansion one would suggest a cubic relationship between the fiber-length changes and the volume expansion, which would result in a linear function with a slope value of 3 in a double logarithmic plot [Fig. 5(d)]. Utilizing this illustration, the data as well as the interpolated data from the sigmoid fitting curves was compared with the theoretical linear function. Since both the data and the interpolated curve do not exhibit the theoretical linear behavior, the result indicates a heterogeneous expansion of the tissue, which is underlining the need for a three-dimensional investigation of the alveolar volume and fiber dynamics. 4.DiscussionIn this study we have demonstrated the combination of an optical coherence tomography and a confocal fluorescence microscopy system to monitor stepwise alveolar distension and elastin fiber stretching in an in situ mouse model. The use of different numerical apertures for the two optical imaging modalities led to a sufficient imaging depth for the OCT and, at the same time, a high lateral resolution for the CFM. Both modalities work simultaneously, where OCT provides a coarse geometrical information of the tissue, and CFM yields the localization of functional constituents within three dimensions. Using lung tissue as a sample, additional information is gained through the visualization of elastin fibers within the 3-D alveolar geometry. Due to the similarity of the OCT en face images and the fluorescence data, the axial registration of both modalities works well within the axial resolution limit of 7.5 μm (in tissue) for OCT, which can be seen from the accurate lining of the alveolus shown in the cross-sectional image of Fig. 4 on the left-hand side. Moreover, the positions of elastin fibers can serve as supplemental landmarks for the simulation of lung tissue where the distension behavior of distinct parts of the parenchyma can be modeled more precisely. The confocal fluorescence microscopy modality reveals the dense fiber network of the visceral pleura, the surrounding serous membrane of the lung. The imaging depth of this method amounts to approximately 20 μm, which can be concluded from the blurred CFM images at 24 μm depth (Fig. 4). This value only comprises the upper third of subpleural alveoli. Explanations for the limited imaging depth might be optical artifacts due to the index mismatch between the tissue and the air interface and, additionally, high absorption of visible light within the tissue. In former studies, the imaging artifacts in the air-filled lung were circumvent by filling the lumen with ethanol and thereby establishing an index matching, which is reducing the refraction and total internal reflection processes in the tissue.26 For in vivo applications, a liquid ventilation approach, as proposed by our group,27 can be used to allow up to three-times-higher imaging depths as compared with air-filled alveoli. Higher penetration for the fluorescence excitation can also be achieved by using a near-infrared femtosecond light source providing two-photon excitation. The lower absorption of the near-infrared light within the sample leads to a better signal for deeper tissue regions. Furthermore, imaging can be performed label-free by detection of auto-fluorescence of elastin fibers and second harmonic generation from collagen fibers.28 From the quantitative analysis of the lung distension studies in the in situ mouse model, the average alveolar volume of the tissue can be estimated. Since the individual alveoli differ much in size, and the average was only calculated for 10 different alveoli, the standard deviation of the mean alveolar volume is nearly as high as the average value itself. Compared with previous studies of alveolar volume sizes, which obtained ,29 the measured value at the corresponding pressure of 5 mbar, , is slightly smaller than in the stereology studies of the fixed mouse samples, but still fits within the error limits. In addition one has to consider the small resolution of the OCT system, revealing a slightly smaller volume estimate30 as well as the threshold parameter set during the image processing. The measured fiber length can be determined more precisely with a relative error of 9.2%. Qualitatively, the data for the alveolar volume change and the fiber stretching follows a sigmoid function, where the last data point lies slightly too low for the function. This outlier could be attributed to a rise of the intrathoracic pressure during the experiment. The value for the compliance measurement is comparable with former studies of lung function. Extrapolated to the whole lung, by multiplying with , the average number of alveoli measured for an adult mouse,29 a parenchymal compliance of can be determined, which corresponds well within one order of magnitude with the literature value of .31 Due to the high measurement error, the specified compliance value is just an estimate. Nevertheless, looking only at the order of magnitude, a significant contribution of alveolar compliance to the whole lung compliance can be derived from these measurements. According to the relationship between volume expansion and fiber stretching, a qualitative statement can be drawn, which is underlining the heterogeneous expansion of the tissue. An inhomogeneous distension of the alveolar tissue during ventilation was also discussed in former studies using intravital microscopy.5 Further studies have to reveal the physical nature of this stretching. 5.ConclusionIn this paper, we showed the successful establishment and evaluation of a combined optical coherence tomography and fluorescence microscopy system for minimal invasive 3-D visualization of subpleural alveoli. Coarse geometrical data of mouse lung tissue was obtained with OCT. Highly resolved elastin fibers, as functional constituents for the elasticity of the tissue, were imaged using confocal fluorescence microscopy together with the specific binding fluorescent dye sulforhodamine B. While lateral alignment is achieved by using the same scanning unit, axial registration is done using a correlation-based algorithm. This approach shall enable reduced motion artifacts for the slower CFM method due to OCT supported image processing. Imaging as well as first quantitative studies were performed in an in situ mouse model, where the typical sigmoid increase of the alveolar volume as well as the elastin fiber length was demonstrated. First studies suggest a significant contribution of the alveolar compliance to the whole lung compliance as well as a heterogeneous stretching behavior of the tissue. Future animal trials shall confirm these statements by better statistics. The discussed quantitative investigations prove the ability of the new combined system to monitor basic physical processes within the lung on a microscopic level. With this approach, a new tool for minimal-invasive analysis of 3-D lung dynamics was developed to elucidate basic mechanisms that govern the behavior of the lung during artificial ventilation. Using a combination with the novel FDML based OCT systems, future applications will concentrate on the realization of real-time volume investigations. AcknowledgmentsThe authors want to thank Maximiliano Cuevas, Stefan Geissler, Mirko Mehner, Julia Walther, Christian Schnabel, Anke Burkhardt, and Lars Kirsten for technical advice and discussion, Hannah T. Nickles for introduction into the mouse preparation as well as Dana Müller-Niegsch for proofreading of the manuscript. This research was supported by the German research foundation (DFG) protective artificial respiration (PAR) project number KO 1814/6-1 and 1814/6-2. ReferencesS. J. C. VerbruggeB. LachmannJ. Kesecioglu,
“Lung protective ventilator strategies in acute lung injury and acute respiratory distress syndrome: from experimental findings to clinical application,”
Clin. Phys. Funct. Im., 27
(2), 67
–90
(2007). http://dx.doi.org/10.1111/cpf.2007.27.issue-2 CPFICA 1475-0961 Google Scholar
J. Steinberget al.,
“Tidal volume increases do not affect alveolar mechanics in normal lung but cause alveolar overdistension and exacerbate alveolar instability after surfactant deactivation,”
Crit. Care Med., 30
(12), 2675
–2683
(2002). http://dx.doi.org/10.1097/00003246-200212000-00011 CCMDC7 0090-3493 Google Scholar
D. CarneyJ. DiRoccoG. Nieman,
“Dynamic alveolar mechanics and ventilator-induced lung injury,”
Crit. Care Med., 33
(Supplement), S122
–S128
(2005). http://dx.doi.org/10.1097/01.CCM.0000155928.95341.BC CCMDC7 0090-3493 Google Scholar
R. D. Hubmayr,
“Perspective on lung injury and recruitment: a skeptical look at the opening and collapse story,”
Am. J. Respir. Crit. Care Med., 165
(12), 1647
–1653
(2002). http://dx.doi.org/10.1164/rccm.2001080-01CP AJCMED 1073-449X Google Scholar
M. Mertenset al.,
“Alveolar dynamics in acute lung injury: heterogeneous distension rather than cyclic opening and collapse,”
Crit. Care Med., 37
(9), 2604
–2611
(2009). http://dx.doi.org/10.1097/CCM.0b013e3181a5544d CCMDC7 0090-3493 Google Scholar
M. B. P. Amatoet al.,
“Effect of a protective-ventilation strategy on mortality in the acute respiratory distress syndrome,”
New Engl. J. Med., 338
(6), 347
–354
(1998). NEJMBH Google Scholar
B. Lachmann,
“Open up the lung and keep the lung open,”
Intens. Care Med., 18
(6), 319
–321
(1992). http://dx.doi.org/10.1007/BF01694358 ICMED9 0342-4642 Google Scholar
R. Failoet al.,
“Lung morphology assessment using MRI: a robust ultra-short tr/te 2-D steady state free precession sequence used in cystic fibrosis patients,”
Mag. Reson. Med., 61
(2), 299
–306
(2009). http://dx.doi.org/10.1002/mrm.v61:2 MRMEEN 0740-3194 Google Scholar
J. C. SchittnyS. I. MundM. Stampanoni,
“Evidence and structural mechanism for late lung alveolarization,”
Am. J. Physiol. Lung Cell Mol. Physiol., 294
(2), L246
–L254
(2007). http://dx.doi.org/10.1152/ajplung.00296.2007 APLPE7 1040-0605 Google Scholar
H. BachofenS. Schürch,
“Alveolar surface forces and lung architecture,”
Comp. Biochem. Phys.—Part A: Molec. Integr. Physiol., 129
(1), 183
–193
(2001). http://dx.doi.org/10.1016/S1095-6433(01)00315-4 CBPAB5 1095-6433 Google Scholar
T. AbrahamJ. Hogg,
“Extracellular matrix remodeling of lung alveolar walls in three dimensional space identified using second harmonic generation and multiphoton excitation fluorescence,”
J. Struct. Bio., 171
(2), 189
–196
(2010). http://dx.doi.org/10.1016/j.jsb.2010.04.006 JSBIEM 1047-8477 Google Scholar
B. D. Dalyet al.,
“Dynamic alveolar mechanics as studied by videomicroscopy,”
Resp. Phys., 24
(2), 217
–232
(1975). http://dx.doi.org/10.1016/0034-5687(75)90115-2 RSPYAK 0034-5687 Google Scholar
S. Meissneret al.,
“Virtual four-dimensional imaging of lung parenchyma by optical coherence tomography in mice,”
J. Biomed. Opt., 15
(3), 036016
(2010). http://dx.doi.org/10.1117/1.3425654 JBOPFO 1083-3668 Google Scholar
L. Kirstenet al.,
“Four-dimensional imaging of murine subpleural alveoli using high-speed optical coherence tomography,”
J. Biophoton.,
(2012). http://dx.doi.org/10.1002/jbio.201200027 PSISDG 0277-786X Google Scholar
J. Barton,
“Dual modality instrument for simultaneous optical coherence tomography imaging and fluorescence spectroscopy,”
J. Biomed. Opt., 9
(3), 618
–623
(2004). http://dx.doi.org/10.1117/1.1695564 JBOPFO 1083-3668 Google Scholar
A. Braduet al.,
“Dual optical coherence tomography/fluorescence microscopy for monitoring of drosophila melanogaster larval heart,”
J. Biophot., 2
(6–7), 380
–388
(2009). http://dx.doi.org/10.1002/jbio.v2:6/7 JBOIBX 1864-063X Google Scholar
H.-M. Helbet al.,
“Clinical evaluation of simultaneous confocal scanning laser ophthalmoscopy imaging combined with high-resolution, spectral-domain optical coherence tomography,”
Acta Ophthalmologica, 88
(8), 842
–849
(2010). http://dx.doi.org/10.1111/aos.2010.88.issue-8 ACOPAT 0001-639X Google Scholar
E. Beaurepaireet al.,
“Combined scanning optical coherence and two-photon-excited fluorescence microscopy,”
Opt. Lett., 24
(14), 969
–971
(1999). http://dx.doi.org/10.1364/OL.24.000969 OPLEDP 0146-9592 Google Scholar
M. Gaertneret al.,
“combining optical coherence tomography with fluorescence microscopy: a closer look into tissue,”
Proc. SPIE, 7715 77152M
(2010). http://dx.doi.org/10.1117/12.854299 PSISDG 0277-786X Google Scholar
A. TabuchiA. R. PriesW. M. Kuebler,
“A new model for intravital microscopy of the murine pulmonary microcirculation,”
FASEB J., 20
(4), A285
–A286
(2006). Google Scholar
C. Ricardet al.,
“In vivo imaging of elastic fibers using sulforhodamine b.,”
J. Biomed. Opt., 12
(6), 064017
(2007). http://dx.doi.org/10.1117/1.2821421 JBOPFO 1083-3668 Google Scholar
M. Wojtkowskiet al.,
“In vivo human retinal imaging by Fourier domain optical coherence tomography,”
J. Biomed. Opt., 7
(3), 457
–463
(2002). http://dx.doi.org/10.1117/1.1482379 JBOPFO 1083-3668 Google Scholar
M. Gaertneret al.,
“Three-dimensional functional imaging of lung parenchyma using optical coherence tomography combined with confocal fluorescence microscopy,”
Proc. SPIE, 7889 78890C
(2011). http://dx.doi.org/10.1117/12.874795 PSISDG 0277-786X Google Scholar
M. H. LongairD. A. BakerJ. D. Armstrong,
“Simple neurite tracer: open source software for reconstruction, visualization and analysis of neuronal processes,”
Bioinformatics, 27
(17), 2453
–2454
(2011). http://dx.doi.org/10.1093/bioinformatics/btr390 BOINFP 1367-4803 Google Scholar
R. S. HarrisD. R. HessJ. G. Venegas,
“An objective analysis of the pressure-volume curve in the acute respiratory distress syndrome,”
Am. J. Respir. Crit. Care Med., 161
(2), 432
–439
(2000). AJCMED 1073-449X Google Scholar
S. MeissnerL. KnelsE. Koch,
“Improved three-dimensional Fourier domain optical coherence tomography by index matching in alveolar structures,”
J. Biomed. Opt., 14
(6), 064037
(2009). http://dx.doi.org/10.1117/1.3275472 JBOPFO 1083-3668 Google Scholar
C. SchnabelS. MeissnerE. Koch,
“Improved OCT imaging of lung tissue using a protojour for total liquid ventilation,”
Proc. SPIE, 8091 809116
(2011). http://dx.doi.org/10.1117/12.889463 PSISDG 0277-786X Google Scholar
A.-M. Penaet al.,
“Three-dimensional investigation and scoring of extracellular matrix remodeling during lung fibrosis using multiphoton microscopy,”
Micro. Res. Tech., 70
(2), 162
–170
(2007). http://dx.doi.org/10.1002/jemt.v70:2 MRTEEO 1059-910X Google Scholar
R. R. MercerM. L. RussellJ. D. Crapo,
“Alveolar septal structure in different species,”
J. Appl. Physiol., 77
(3), 1060
–1066
(1994). JAPIAU 0021-8979 Google Scholar
S. Meissner,
“Simultaneous three-dimensional optical coherence tomography and intravital microscopy for imaging subpleural pulmonary alveoli in isolated rabbit lungs,”
J. Biomed. Opt., 14
(5), 054020
(2009). http://dx.doi.org/10.1117/1.3247149 JBOPFO 1083-3668 Google Scholar
L. A. SchwarteC. J. ZuurbierC. Ince,
“Mechanical ventilation of mice,”
Basic Res. Card., 95
(6), 510
–520
(2000). http://dx.doi.org/10.1007/s003950070029 BRCAB7 0300-8428 Google Scholar
|


