|
|
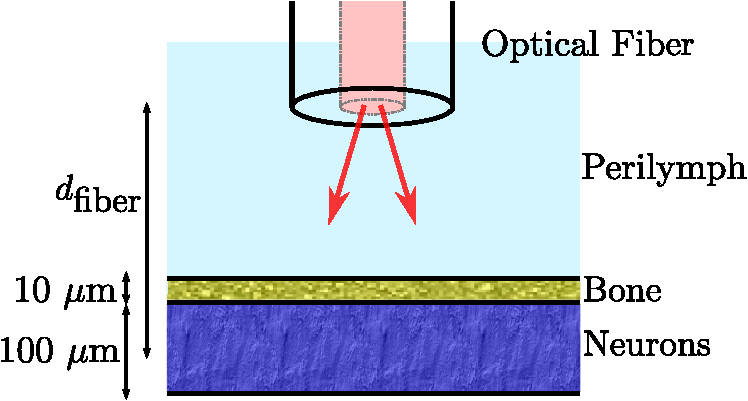
1.IntroductionThe use of infrared light to stimulate neural tissue has been demonstrated as an alternative to the well-known technique of electrical stimulation.1 Some of the potential advantages of infrared neural stimulation (INS) over traditional electrical stimulation include the avoidance of direct contact between the stimulation source (e.g. optical fiber) and nerves, the absence of an electrical stimulation artifact on recording devices and finer spatial selectivity of neurons. A range of wavelengths have been used for INS, including 1450 nm,2 1540 nm,2 1850 nm,3,4 1870 nm,3,4,5 1940 nm6 and 2120 nm.5,7 The detailed biophysical mechanism behind INS has been the subject of some discussion in the literature.1,5 However, recent work8 has indicated that infrared light excites cells by producing a rapid local increase in temperature that reversibly alters the electrical capacitance of the membrane. This process is mediated by water absorption of the light and may require a thermal gradient rather than just a transient increase in temperature. It has been shown that the effectiveness and energy required to achieve stimulation with these wavelengths varies based on the water absorption coefficient and the geometry involved. While simple methods of comparing stimulation wavelengths based on the optical penetration depth () have been used to compare feasibility for different geometries,3 a more rigorous understanding relying on energy absorption has yet to be reported. As a result, the behavior of the light in tissue, the thresholds required to obtain stimulation and the influence of light delivery techniques on stimulation are not well understood. One of the most common light delivery methods in optical nerve stimulation is via optical fibers. Stimulation thresholds reported in the literature vary greatly, depending not only on the type of nerve tissue, but also on the the type of optical fiber used and its location relative to the nerve. Thresholds are typically given as radiant exposure in ; however these units do not take into account any variations in the absorption between the fiber end and the neural tissue or the absorbed dose at different wavelengths. Monte Carlo methods refer to a set of techniques first proposed by Metropolis and Ulam9 and are now commonly used to simulate physical processes using a stochastic model. In related work, Wilson and Adam10 first introduced Monte Carlo methods to study the propagation of light in tissues due to an interest in photodynamic therapy (PDT). They presented a model using a homogeneous medium, with scattering and absorption coefficients of and respectively. The photons trace a randomly generated path with a mean free path length equal to , where is the sum of the scattering and absorption coefficients. This model was extended by Prahl et al.11 to include anisotropy in scattering and internal light reflection upon reaching the boundary of the medium. While providing for interfaces with external media, the algorithm provided by Prahl et al. is limited in that it only allows for one medium to be modeled and does not provide for multiple layers or more complex three-dimensional (3-D) structures. To account for this, Wang et al.12 extended the Monte Carlo models to allow for modeling of light transport in multi-layered tissues (MCML). While use of this methodology has been extended and applied to various light/tissue interactions, it has yet to be used to study optical stimulation of neural tissue. To better understand the physical mechanisms controlling the thresholds required to trigger neural tissue during INS, a Monte Carlo model based on the MCML model by Wang et al.12 was developed and used to simulate the absorbed dose of light when delivered to nerves by optical fibers. In this work, emphasis has been placed on the stimulation of nerves in the cochlea. A number of studies have examined INS of the cochlear nerves,1 as this system is known to respond well to implanted electrical stimulation devices.13 2.Monte Carlo Modeling of INSThe current model has been based on an approximation of the geometry relevant to the stimulation of cochlear nerves in the modiolus of a guinea pig cochlea, as shown in Fig. 1. This geometry simulates an arrangement where an optical fiber is inserted inside the cochlea through a cochleostomy to direct light toward the spiral ganglion cells, representative of the approach used by Richter et al.14 and Moreno et al.15 While only this geometry is considered in detail here, the technique can be readily extended to other arrangements. The 3-D geometry is made of slab layers of perilymph, bone and nerves. Clearly this geometry represents a considerable simplification of the complex 3-D structure,16 including the fact that bundles of the central processes of the spiral ganglion neurons are known to project through pores in the osseous spiral lamina on the modiolar side of Rosenthal’s Canal.17 However, this simplification is useful in understanding the general principles behind light delivery to this region. Fig. 2Example of a Monte Carlo simulation where an optical fiber is positioned 500 μm from the center of the nerve layer. Black vertical lines show the bone layer between 440 and 450 μm and the nerves between 450 and 550 μm (, , , , ).  Fig. 3Figure showing the FWHM and laser spot diameter and the absorbed energy dose in the nerve layer 500 μm from the fibre emitter, plotted against the NA of the fiber used (). 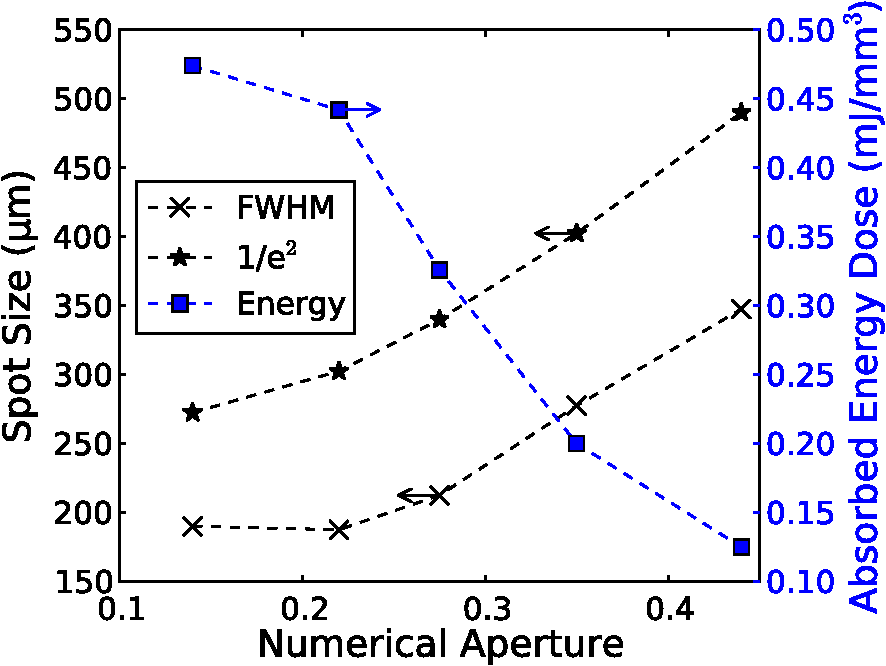 Fig. 4Figure showing the FWHM and laser spot diameter and the absorbed energy dose in the nerve layer 500 μm from the fiber emitter, plotted against the core diameter of fiber used (). 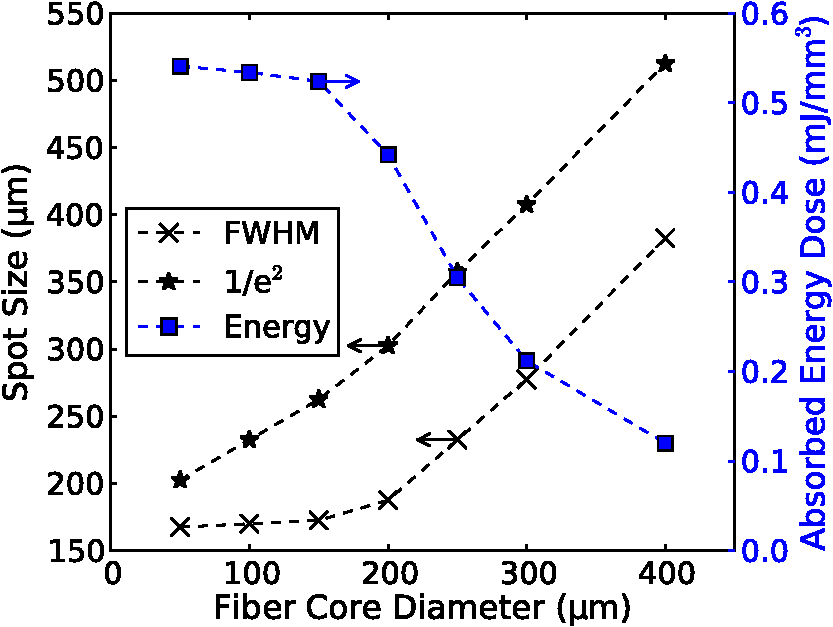 Fig. 5Energy absorbed in the nerve layer with the fiber positioned 250, 500, and 750 μm away, calculated over the wavelength range 1400 to 1900 nm.  Fig. 6Energy absorbed in the nerve layer with the fiber positioned 250, 500, and 750 μm away for a range of absorption values. The solid lines are a spline fitting curve to the data points calculated from the model.  Fig. 7Monte Carlo simulation with selective absorption in nerve and bone layers when the optical fiber is positioned 500 μm from nerves. Black vertical lines show the bone layer between 400 and 450 μm and the nerves between 450 and 550 μm (, , , , ).  Fig. 8Energy absorbed with and without increased absorption in the bone and nerve over the range wavelength range 1800 to 1900 nm. 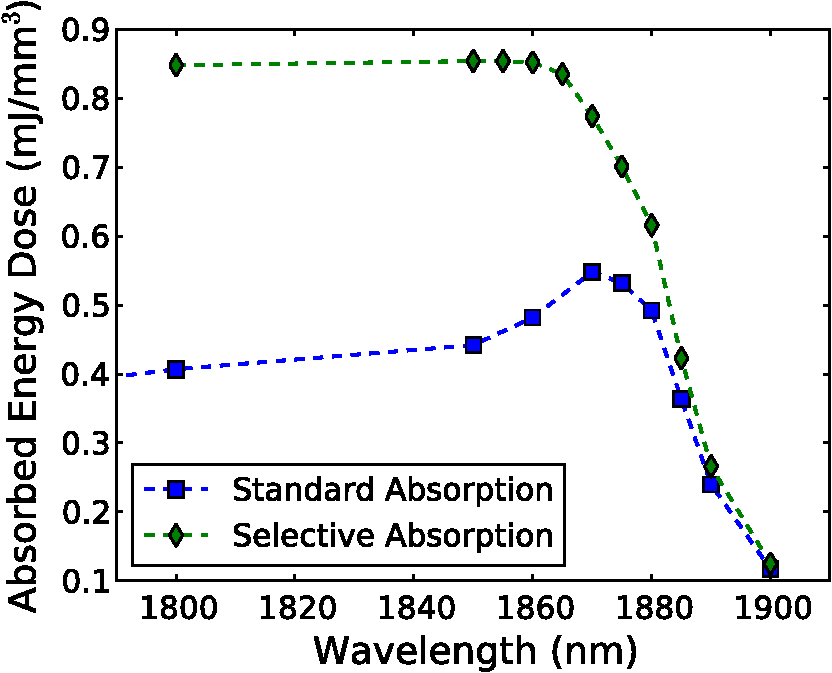 Fig. 9Simulation showing the temperature change due to a 25 μJ pulse at 1850 nm, from a 200 μm core fiber ().  Fig. 10Gradient in temperature for fiber positions at 250 500 and 750 μm over the range wavelength range 1400 to 1900 nm.  In the absence of detailed absorption and scattering data for the relevant tissues in the wavelength range of interest, values of scattering (), absorption () and anisotropy () are derived from information supplied in Refs. 18 and 19 and water absorption from Curcio et al.20 A summary of the parameters used is shown in Table 1, absorption () is taken to be water absorption, as absorption of infrared light in skin has been shown to follow water absorption.19 The anisotropy coefficient is 0.85, as values for typically range between 0.8 and 0.9 for tissue.19 Scattering () values of for bone and for neural tissue are selected to be in the range for tissue suggested by Troy et al.19 and bone is expected to be higher than neural tissue.21 A refractive index of water (1.33) is selected in absence of any precise data for these media over the wavelength range of interest. Table 1Parameters used for simulations when λ=1850 nm.
On each photon absorption interaction, the energy absorbed is saved in a 3-D array () with a resolution of 2.5 μm. For this work the MCML Monte Carlo model12 was used, modified to make use of the multi-threading capability of OpenMP is an industry standard API, the standards body is based at openmp.org/. Light output from the fiber is modeled using photons initialized with an even top hat distribution across the fiber end face. This is a valid approximation for a multi-mode fiber, as the normalized frequency for the smallest core fiber studied here is much greater than 1. The divergence of light from the core, given by the numerical aperture (NA), is simulated by an even spread of angles between 0 and the critical angle. The spread of light out of a multi-mode fiber is given by , where ,22 which is very close to an even distribution. While the NA quoted here is for the fiber in air, this is modified by the refractive index of the perilymph when the fiber is placed in the inner ear, reducing the effective NA; here we have assumed that the refractive index of perilymph is the same as that of water (). In a simulation each photon is allowed to propagate in a series of step sized as of size , where is a pseudo-random number uniformly distributed over the interval . Photons are then moved by a distance and a corresponding portion of the energy is absorbed and saved in the 3-D grid. The direction of the photon is changed by scattering and this continues until the photon’s weight falls below a threshold and the roulette technique11 is used to determine whether or not to terminate the photon. This continues until all photons have run. Figure 2 shows the typical characteristics of a two-dimensional (2-D) slice of a Monte Carlo simulation of light absorption in the model cochlear geometry. For this image, the total pulse energy launched was 25 μJ, equivalent to a radiant exposure of at 500 μm, roughly twice the threshold observed experimentally for a pulse 60 μs in duration.4 Other parameters used were: , , , . Black vertical lines show the bone layer between 440 and 450 μm and the nerves between 450 and 550 μm. Beyond 550 μm the medium has the coefficients of perilymph. From Fig. 2 it can be seen that for the geometry and parameters used here, scattering in the bone and nerve has a negligible effect on photon propagation compared to absorption. As the majority of wavelengths used for INS have an absorption coefficient similar to or exceeding the scattering coefficient, this behavior is expected to be consistent across all wavelengths used. 3.Modeling of Fiber PropertiesA range of different fiber types and diameters have been used for INS. Fibers used for INS studies have typically been selected to balance the ease of coupling of laser light into the core, maximizing the intensity of light at the emitting end and also minimizing the absorption of light in the core. As silica is strongly absorbing of wavelengths above 2000 nm, standard silica multi-mode fiber () is the most commonly used for INS.1 However, other fibers, such as hollow core fibers, have also been used7 in cases where the absorption in silica is too high at the wavelength chosen for the particular stimulation study. To investigate the effect of fiber NA and core size on the laser spot size in the region containing the nerves, a wavelength of 1850 nm was used with a pulse energy of 25 μJ. With the fiber positioned 500 μm from the center of the nerve, the spot size was calculated with both full-width half-maximum (FWHM) and of the maximum energy absorbed. The average energy absorbed over a region at the center of the nerve layer is also displayed on the right axis. Figure 3 shows the relationship between fiber NA and the laser spot size (). It is seen that as the NA almost increases the spot size increases linearly due to the increased divergence of the beam, while the FWHM spot size only increases with an NA greater than 0.22. This suggests a higher concentration of energy for NAs less than 0.22, as confirmed by the values for absorbed dose. Figure 4 shows the increase in spot size as the core diameter of the optical fiber increases (). As the core diameter increases the spot size also increases, however the FWHM spot size only increases with core diameters greater than . This suggests that at smaller core diameters the energy is spread out due to the divergence of the light from the core. These results suggest that an optical fiber with and core size of 150 to 200 μm is likely to deliver the highest intensity of light under the conditions considered in the model. With smaller core diameters the intensity close to the fiber will be very high and may risk delivering too much energy to the local tissue, possibly leading to damage. However, it should be noted that factors such as laser coupling efficiency may also need to be taken into account when selecting a fiber-delivery system. 4.Wavelength EffectsFigure 5 shows the results of simulations of the energy absorbed averaged over a region at the center of the nerve layer, with the fiber positioned at varying distances from the center of the nerve region, in the wavelength range 1400 to 1900 nm. A distance of 500 μm between the fiber and nerve region was again selected, as it is a common choice in the literature,3 250 and 750 μm were selected as a comparison for when the fiber is moved closer to and further away from the nerves. The wavelength range between 1800 and 1900 nm is shown with an expanded scale, to highlight changes observed in the range commonly used for optical stimulation. In general, higher levels of water absorption result in a higher amount of energy absorbed. However, for the highest levels of absorption considered here (for wavelengths above 1870 nm, where ), the energy absorbed in the nerve layer can be reduced, as much of the light is absorbed by the perilymph and bone before it reaches the nerves. Changing the fiber position causes the levels of the absorbed energy dose to have a different dependence on wavelength, due to different levels of absorption before reaching the nerve. For the largest spacing (750 μm) the absorbed energy dose is consistently reduced for high levels of absorption, i.e. around 1450 nm and for wavelengths above 1870 nm. The effects of changing the absorption parameter , which is determined by the wavelength chosen for use in stimulation, can be seen more clearly in Fig. 6. In this figure the -axis is plotted in terms of rather than wavelength, which has a non-linear change in absorption. All of the calculations are based on a 25 μJ laser pulse. When the fiber is positioned further from the nerve layer, the total energy absorbed in the nerves is lower, as expected due to energy being absorbed in the perilymph before the nerve. It also shows that when the absorption constant () is increased (for example due to the wavelength used), a point is reached where the energy absorbed will decrease, as much of the laser energy is absorbed before it reaches the nerve layer. When the fiber is positioned further away, this turning point in the nerve's absorbed energy is reached at lower levels of absorption. Maximum absorbed dose is at for 250 μm, for 500 μm and for 750 μm. This shows that the wavelengths used for different geometries need to be carefully considered to optimize the energy delivered at the target region. In the wavelength range most commonly used for optical stimulation (1800 to 1900 nm), these results show that the energy absorbed in the nerve with a fiber positioned 500 μm away from the nerve layer increases from to a maximum at . This may be compared to the experimental results of Izzo et al.,3 who varied the wavelength between 1844 and 1873 nm and found that the response reduced at 1860 nm and was minimal at 1873 nm (with the optical fiber emitter positioned 500 μm from the nerve). This suggests that either the absorption or scatter due to differences in geometry is important and needs to be considered by the model; or the distance between the fiber and target neurons reported by Izzo et al.3 was inaccurate; or the assumed absorption coefficient used in this modeling is incorrect; or that there is another mechanism behind INS in some cases. While it is unlikely that single-tissue chromophores can significantly enhance light absorption and hence promote INS,5 it is possible that absorption in the tissues is higher than the water-dominated level we have assumed here. For example, data for light absorption in water and both oxygenated and deoxygenated blood from Roggan et al.23 shows an increase in the absorption coefficient of 0.5 to in blood compared to water around a wavelength of 1850 nm. As the composition of bone and nerve tissues differs considerably from that of perilymph, which is primarily composed of water and has similar optical properties to water, it suggests that the light may be more strongly absorbed in the bone and nerve tissue rather than the perilymph. In Fig. 7, the absorption coefficient in the bone and nerve has been increased by to simulate selective absorption, with the other parameters remaining the same as Fig. 2. The resulting energy absorbed with a fiber distance of 500 μm can be seen as a function of wavelength in Fig. 8. With selective absorption there is a decrease from a plateau in energy absorbed between 1800 and 1850 nm as the wavelength increases beyond 1860 nm, similar to the results shown by Izzo et al.3 While selective absorption is not necessary for INS, as it is dominated by water absorption,8 it may enhance the process in specific cases. It is also possible that the scattering coefficients assumed in the model so far are not representative of tissue at the wavelengths of interest. To consider this possibility, further modeling was performed in which the scattering of the nerve and bone was changed and the effect on energy absorbed was calculated. When the scattering in the bone and nerve is changed, minimal change in energy absorbed is observed until where a 1.5% reduction is observed. When is increased further the energy absorbed continues to reduce, with a 10% reduction for . At the scattering levels considered in the model (), varying the anisotropy () has a minimal effect on the energy absorbed in the nerve. 5.Temperature ChangesBy using the specific heat capacity of water (), the absorbed energy can be converted to a shift in temperature, according to While this does not take into account changes due to heat conduction, it provides a reasonable estimate of the change in temperature, as the thermal penetration depth () during a 60 μs pulse is only 5.8 μm (where is the thermal conductivity constant for water and is approximately the same for liquid water and most tissues).24Tissue has a range of specific heat capacity, primarily depending on the water content of the tissue. An approximation for most tissues is given by: where is the overall tissue density and is density of the water content in the tissue.24 For simplicity the specific heat capacity of water is used in the present model, however, the temperature increase could be 1.29 times higher if the nerve’s water content was 60%.An estimation of the accuracy of the Monte Carlo simulations and conversion to temperature increases can be made by comparing results measured by Wells et al.5 Simulating a 600 μm core fiber with a wavelength of 2120 nm and a 1.13 mJ pulse (corresponding to a exposure), was found to create an average temperature rise of , similar in magnitude to the 3.66°C average rise measured experimentally by Wells et al. Another comparison can be drawn from Shapiro et al.8 who used a 1889-nm laser coupled into a 400 μm core diameter fiber to stimulate oocytes in water 100 μm away from the fiber. A number of pulse lengths and energies were used; a 1 ms 2.8 mJ pulse gave a temperature increase of 15.2°C and a 2 ms, 5.6 mJ pulse gave a 27.1°C increase. A simulation with the same parameters gives a 16.9°C increase for a 2.8 mJ pulse and a 33.7°C increase for the 5.6 mJ pulse. This result is again similar in magnitude, with the discrepancy likely due to thermal conduction, which is not considered in the current model. An example of modeling the change in temperature due to optical stimulation is shown in Fig. 9. It shows a 25 μJ pulse at 1850 nm, from a 200 μm core fiber (). In the nerve layer, the temperature increase is around 0.1°C, with a 0.03°C difference in temperature across the nerve layer. Once again, it should be noted that these parameters correspond to twice the stimulation threshold for a pulse of 60 μs reported in Richter et al.4 This suggests that INS can be achieved with remarkably small temperature changes under appropriate conditions. Some research5 has suggested that a temperature gradient, rather than a simple increase in temperature resulting from absorption of optical energy, is required to stimulate a nerve. Temporal gradients are achieved by use of short laser pulses, but spatial gradients will depend on fiber design and absorption coefficient of the nerve. Results from the Monte Carlo simulation can also be used to find the temperature gradient in tissue. Figure 10 shows the spatial temperature gradient along the axis (see Fig. 2 for axis definitions) in the nerve layer with a fiber placed 250, 500 and 750 μm away. Similarly to the energy absorbed, when the fiber is closer to the nerve, the gradient in temperature is higher. For 500 and 750 μm the gradient reduces when absorption increases, corresponding to wavelengths above . The spatial temperature gradient observed in the modeling is quite small in comparison to the temporal temperature gradient, which would be expected from short laser pulses. It is therefore likely that a temporal gradient is a more important factor in successful nerve stimulation. This is supported by the recent results of Shapiro et al.8 who explain the mechanism of INS through the use of a model of membrane capacitance where a redistribution of charge is driven by a time-dependant change in temperature. 6.ConclusionMonte Carlo modeling can provide useful insights into the light-tissue interactions that underpin the phenomenon of infrared nerve stimulation. The model presented in this work gives information on the expected performance of different optical fiber designs for light delivery to target tissue. Given that there is an identifiable threshold for all reported instances of INS, it is clear that the underlying mechanism must be driven by an initial absorption process. The model presented allows the actual absorbed dose to be predicted, which is therefore a more fundamental quantity than radiant exposure. Under different assumptions about the underlying absorption process, the dependence of absorbed dose can be compared with observed thresholds as a function of wavelength. The results presented suggest a temperature increase of as little as 0.1°C is involved in the stimulation of a nerve. While the results shown here are in broad agreement with a recently proposed model based on reversible changes in membrane capacitances, they do point to a need for more careful experimentation to clarify some aspects of the proposed mechanism. The validity of the Monte Carlo modeling will also be improved by availability of more accurate absorption and scattering constants for the wavelengths of interest. AcknowledgmentsThe authors thank R.K. Shepherd of the Bionics Institute of Australia for helpful advice on the structure of the guinea pig cochlea. This work was supported by the Australian Research Council under Linkage Project grant LP120100264. ReferencesC.-P. Richteret al.,
“Neural stimulation with optical radiation,”
Laser Photonics Rev., 5
(1), 68
–80
(2011). http://dx.doi.org/10.1002/lpor.v5.1 LPRAB8 1863-8880 Google Scholar
R. G. McCaugheyC. ChlebickiB. J. F. Wong,
“Novel wavelengths for laser nerve stimulation,”
Lasers Surg. Med., 42
(1), 69
–75
(2010). http://dx.doi.org/10.1002/lsm.v42:1 LSMEDI 0196-8092 Google Scholar
A. D. Izzoet al.,
“Optical parameter variability in laser nerve stimulation: a study of pulse duration, repetition rate, and wavelength,”
IEEE Trans. Biomed. Eng., 54
(6), 1108
–1114
(2007). http://dx.doi.org/10.1109/TBME.2007.892925 IEBEAX 0018-9294 Google Scholar
C.-P. Richteret al.,
“Optical stimulation of auditory neurons: effects of acute and chronic deafening,”
Hear. Res., 242
(1–2), 42
–51
(2008). http://dx.doi.org/10.1016/j.heares.2008.01.011 HERED3 0378-5955 Google Scholar
J. Wellset al.,
“Biophysical mechanisms of transient optical stimulation of peripheral nerve,”
Biophys. J., 93
(7), 2567
–2580
(2007). http://dx.doi.org/10.1529/biophysj.107.104786 BIOJAU 0006-3495 Google Scholar
A. D. Izzoet al.,
“Laser stimulation of the auditory system at 1.94 m and microsecond pulse durations,”
Proc. SPIE, 6854 68540C
(2008). http://dx.doi.org/10.1117/12.761315 PSISDG 0277-786X Google Scholar
J. Wellset al.,
“Application of infrared light for in vivo neural stimulation,”
J. Biomed. Opt., 10
(6), 064003
(2005). http://dx.doi.org/10.1117/1.2121772 JBOPFO 1083-3668 Google Scholar
M. G. Shapiroet al.,
“Infrared light excites cells by changing their electrical capacitance,”
Nat. Commun., 3 736
(2012). http://dx.doi.org/10.1038/ncomms1742 NCAOBW 2041-1723 Google Scholar
N. MetropolisS. Ulam,
“The Monte Carlo method,”
J. Am. Stat. Assoc., 44
(247), 335
–341
(1949). JSTNAL 0162-1459 Google Scholar
B. C. WilsonG. Adam,
“A Monte Carlo model for the absorption and flux distributions of light in tissue,”
Med. Phys., 10
(6), 824
–830
(1983). http://dx.doi.org/10.1118/1.595361 MPHYA6 0094-2405 Google Scholar
S. A. Prahlet al.,
“A Monte Carlo model of light propagation in tissue,”
Proc. SPIE , 5 102
–111
(1989). Google Scholar
L. WangS. L. JacquesL. Zheng,
“MCML-Monte Carlo modeling of light transport in multi-layered tissues,”
Comput. Method. Program. Biomed., 47
(2), 131
–146
(1995). http://dx.doi.org/10.1016/0169-2607(95)01640-F CMPBEK 0169-2607 Google Scholar
G. Clark, Cochlear Implants: Fundamentals and Applications, 199
–295 Springer-Verlag, New York
(2003). Google Scholar
C. P. Richteret al.,
“Spread of cochlear excitation during stimulation with pulsed infrared radiation: inferior colliculus measurements,”
J. Neural Eng., 8
(5), 056006
(2011). http://dx.doi.org/10.1088/1741-2560/8/5/056006 1741-2560 Google Scholar
L. E. Morenoet al.,
“Infrared neural stimulation: beam path in the guinea pig cochlea,”
Hear. Res., 282
(1), 289
–302
(2011). http://dx.doi.org/10.1016/j.heares.2011.06.006 HERED3 0378-5955 Google Scholar
R. K. Shepherdet al.,
“Chronic depolarization enhances the trophic effects of brain-derived neurotrophic factor in rescuing auditory neurons following a sensorineural hearing loss,”
J. Comp. Neurol., 486
(2), 145
–158
(2005). http://dx.doi.org/10.1002/(ISSN)1096-9861 0021-9967 Google Scholar
R. K. ShepherdM. P. Colreavy,
“Surface microstructure of the perilymphatic space: implications for cochlear implants and cell-or drug-based therapies,”
Arch. Otolaryngol. Head Neck Surg., 130
(5), 518
–523
(2004). http://dx.doi.org/10.1001/archotol.130.5.518 Google Scholar
T. Vo-Dinh, Biomedical Photonics Handbook, CRC Press, Boca Raton, Florida
(2003). Google Scholar
T. L. TroyS. N. Thennadil,
“Optical properties of human skin in the near infrared wavelength range of 1000 to 2200 nm,”
J. Biomed. Opt., 6
(2), 167
–176
(2001). http://dx.doi.org/10.1117/1.1344191 JBOPFO 1083-3668 Google Scholar
J. A. CurcioC. C. Petty,
“The near infrared absorption spectrum of liquid water,”
J. Opt. Soc. Am., 41
(5), 302
–302
(1951). http://dx.doi.org/10.1364/JOSA.41.000302 JOSAAH 0030-3941 Google Scholar
M. Firbanket al.,
“Measurement of the optical properties of the skull in the wavelength range 650–950 nm,”
Phys. Med. Biol., 38
(4), 503
–510
(1993). http://dx.doi.org/10.1088/0031-9155/38/4/002 PHMBA7 0031-9155 Google Scholar
A. W. SnyderJ. D. Love, Optical Waveguide Theory, 190 Chapman and Hall, New York
(1983). Google Scholar
A. Rogganet al.,
“Optical properties of circulating human blood in the wavelength range 400–2500 nm,”
J. Biomed. Opt., 4
(1), 36
–46
(1999). http://dx.doi.org/10.1117/1.429919 JBOPFO 1083-3668 Google Scholar
M. H. Niemz, Laser-Tissue Interactions: Fundamentals and Applications, Springer-Verlag, Heidelberg
(2007). Google Scholar
|