
|
|
1.IntroductionControlling cell culture patterns is highly desirable for characterizing cell behaviors under various external stimulations and investigating cell mechanics in confined areas. In the past decade, surface modification techniques that affect cell growth1–3 and motion4–6 have been well developed. Nevertheless, these surface modification techniques provide fixed shapes for cell culture and guidance. It is usually difficult to vary the culture patterns during experiments. In contrast, using laser light to pattern cell growth,7,8 to influence the directions of cell migration,9,10 or to detach and re-orientate adherent cells,11 is dynamic and accurate in both spatial and temporal domains. In addition, a number of research groups have demonstrated arbitrary patterning of floating cells by using optoelectronic tweezers.12–14 The optical patterns are generated by electro-optic light modulators and then projected onto the object plane of an optical microscope. Therefore, spatial control of a small amount of cells is feasible. However, most optoelectronic tweezers rely on the optoelectronic dielectrophoresis effect, of which the force is usually too small to move adherent cells to form micropatterns on the substrate. In this work, we performed micropatterning of adherent cells by using optical patterns of 473 nm light. This wavelength was selected for the compromise between high optical effects on perturbing the cell movements and low phototoxicity in comparison with the 405 nm light used in our previous work.10 Because the shape and size of an optical pattern remained the same within a propagation distance longer than 20 μm, the optical patterns actually formed light walls around the adherent cells. Under suitable intensity and contrast of the optical pattern, the cells continued proliferating to fill up the region enclosed by the light walls. We also demonstrated a wound-healing experiment by using the light patterns. Finally, we compared the structures of the mitochondria with and without the light illumination and found that the mitochondrial damage caused by the 473 nm light could be the major mechanism of optical patterning for adherent cells. 2.Materials and Methods2.1.Optical SetupThe light patterns were generated by a diode-pumped, solid-state 473 nm laser and a liquid-crystal spatial light modulator (HEO 6001-SC-II, Holoeye Photonics AG, Berlin-Adlershof, Germany). The pattern on the spatial light modulator was projected onto the focal plane of a , 0.3 numerical aperture objective (UIS2 UPlanFLN, Olympus Corp., Tokyo, Japan) through the Koehler illumination port of an inverted microscope (IX70, Olympus), as shown in Fig. 1. The microscope was equipped with differential interference contrast (DIC) components. We placed a plano-convex lens () nearly 80 cm in front of the Koehler illumination port to adjust the position of the projected optical patterns along the optical axis. On the focal plane of the objective, the width of the light patterns was typically set to 50 to 100 μm, and the Michelson contrast of the projected optical pattern was 93%. The cell culture patterns were observed with the DIC imaging modality. The DIC images were recorded by a 12-bit CCD camera (Pixelfly qe, PCO AG, Kelheim, Germany) with 0.3-s exposure time. The laser light was stopped by a mechanical shutter while we captured the images of the cells. The image acquisition process was fully automated by using a LabVIEW™ program. Fig. 1Experimental setup. The laser light pattern is coupled through the Koehler illumination port of an inverted optical microscope with a mirror on a flipper, such that the original epi-illumination light source can be used to conduct fluorescence imaging. The illumination time of the light pattern is controlled by a mechanical shutter with a minimum open duration of 2 ms. The spatial light modulator, camera, and mechanical shutter are all controlled by a personal computer.  Proper light intensity is crucial for successfully patterned cultures. We searched for the highest intensity which did not cause observable cell damage in the culture region. In the following experiments, the intensity of the 473 nm laser light on the bottom of the culture dish was , which could effectively confine the cells in the region enclosed by the light pattern, while the cells proliferated for at least four days. We also estimated the local temperature rise in the culture medium caused by laser illumination using the parameters reported by Stevenson et al.15 From the data in Ref. 15, we estimated that the absorption coefficient of Dulbecco’s Modified Eagle Medium (DMEM) at 1064 nm is , and at 473 nm it is . According to the law of absorption, the local temperature rise is proportional to , or for , where is the incident intensity of light, is the absorption coefficient, and is the thickness of the cell. If we assume that the cells we used had a similar thickness to those cells used in the reference, we can estimate the local temperature rise as In Ref. 15, caused by a focused laser beam () was determined to be . Hence, we calculated that the local temperature rise in our experiment was . Therefore, we could neglect the temperature effect on suppressing the cell proliferation in the illuminated region.We also tested the same setup by using a 405 nm laser as the light source because we found that the focused 405 nm light spot was effective at inducing lamellipodium retractions of moving cancer cells.10 However, owing to the lower contrast of the spatial light modulator at 405 nm, the cells cultured inside the optical pattern could not maintain good viability. Therefore, we chose the 473 nm light source for the experiments in the present work. 2.2.Cell Culture and Mitochondrion StainingThe cells used in this work were from a human lung adenocarcinoma cell line CL1-5, which has high motility and invasion ability.16 The cells were cultured in 35-mm culture dishes (BD Falcon; 353001) without any cell-adhesive proteins coated on the dish bottom. The culture medium was Leibovitz-15 medium containing 10% fetal bovine serum and 1% antibiotic pen-strep-ampho. We placed the culture dish in a homemade temperature-controlled chamber on the microscope. The temperature was maintained at during the experiments. For comparison, we also used another human lung adenocarcinoma cell line A549 under the same culture condition. For the observation of mitochondrial structures, we stained the living CL1-5 cells with the MitoTracker® probes (MitoTracker® Orange CMTMRos M-7510, Invitrogen, Grand Island, NY) according to the protocol provided by the manufacturer. The MitoTracker® probes are taken up by functional mitochondria, and they stay with the labeled targets even after the fixation with formaldehyde.17 Therefore the observed structures and distributions of mitochondria can be regarded the same as those in the living cells. In the present work, the cells were stained after light illumination and then washed twice with phosphate buffered saline. Afterwards we fixed the cells with 4% formaldehyde. The DIC and fluorescence images of mitochondria were taken with the same microscope used for the optically patterned culture experiments but using a , 0.6 numerical aperture objective (UIS2 LUCPlanFLN, Olympus). The exposure time of one fluorescence image was 10 s. 3.Results and DiscussionIn the following results, the “0” time point refers to the start of patterned illumination, which was typically about 6 h after we seeded the cells into the culture dish. Figure 2(a) shows the image of the light pattern projected on the bottom of a culture dish. In order to verify that the pattern of light remained the same through the thickness of a layer of cells, we moved the culture dish along the optical axis by using a piezo-electric transducer-driven -axis stage and took images of the light pattern at an interval of 1 μm. Figure 2(a) shows that the shape of the light pattern remained the same in a range of 20 μm, which is thicker than most adherent mammalian cells. Figure 2(b) is the DIC images of CL1-5 cells cultured for 90 h without the light pattern. The cells simply grow and move in a random pattern. Figure 2(c) and 2(d) shows the patterned cultures of CL1-5 cells after 90 h with a triangular and a rectangular light pattern, respectively. The time-lapse videos of the cell proliferation processes are presented in Video 1 and Video 2. To test if the optical micropatterning is cell-type specific, we also conducted the patterned culture of another lung adenocarcinoma cell line A549. Video 3 shows a similar micropatterned culture for the A549 cells as that demonstrated in Fig. 2(c). Fig. 2(a) Left: Image of a triangular light pattern projected on the bottom of a culture dish. Right: Axial variation of the projected light pattern. These images were captured with an interval of 1 μm while the culture dish was moved along the optical axis. The pattern is filled with a single color for a better visibility. (b) DIC images of the CL1-5 cells without light patterns at 0 and 90th h. (c) CL1-5 cells cultured within a triangular light pattern. There are nearly 65 cells confined in the triangular light pattern. (d) CL1-5 cells cultured with a rectangular light pattern. There are nearly 50 cells confined in the rectangular light pattern. Dashed lines in (c) and (d) mark the inner and outer perimeters of the light patterns. (Video 1 MOV, 1.04 MB) [URL: http://dx.doi.org/10.1117/1.JBO.17.7.075004.1]; (Video 2 MOV, 1 MB) [URL: http://dx.doi.org/10.1117/1.JBO.17.7.075004.2]; (Video 3 MOV, 713 KB) [URL: http://dx.doi.org/10.1117/1.JBO.17.7.075004.3].  In order to quantify the optical cell patterning effect, we calculated the root-mean-square (RMS) deviation between the boundary of the cell colony and that of the projected light pattern by this equation: where is the distance between the boundary of the cell colony and the inner boundary of the optical pattern at the ’th pixel on the pattern boundary, and is the total pixel number of the inner boundary of the optical pattern. Figure 3(a) and 3(b) illustrates the schemes for the calculation of the RMS deviations. The boundaries were recorded pixel by pixel with a home made LabVIEW™ program while we marked the boarder lines by using a digital handwriting pen. Then we divided the deviation by the side length of the inner boundary of the optical pattern to obtain the normalized deviation. For the triangular pattern, we used the average of three normalized deviations on the three sides to represent the fitness between the light pattern and the cells in one experiment. For the rectangular pattern, we used the average of the normalized deviations on the four sides. Figure 3(c) shows the normalized deviations for the triangular pattern in Fig. 2(c) and the rectangular pattern in Fig. 2(d). The data is the of three independent experiments with either shape of pattern. For both shapes of cell colonies, the means of average normalized deviations are smaller than 15%.Fig. 3(a) Boundary of the cell pattern and the inner boundary of the light pattern. (b) The difference between the boundary of the light pattern (black) and that of the cell pattern (gray) in the regions marked by rectangles in (a). (c) Normalized deviations between the cell patterns and light patterns after 90 h of culture. The data show the of three independent experiments. The mean of average deviations of both the triangular and rectangular shapes are smaller than 15% of the side lengths. 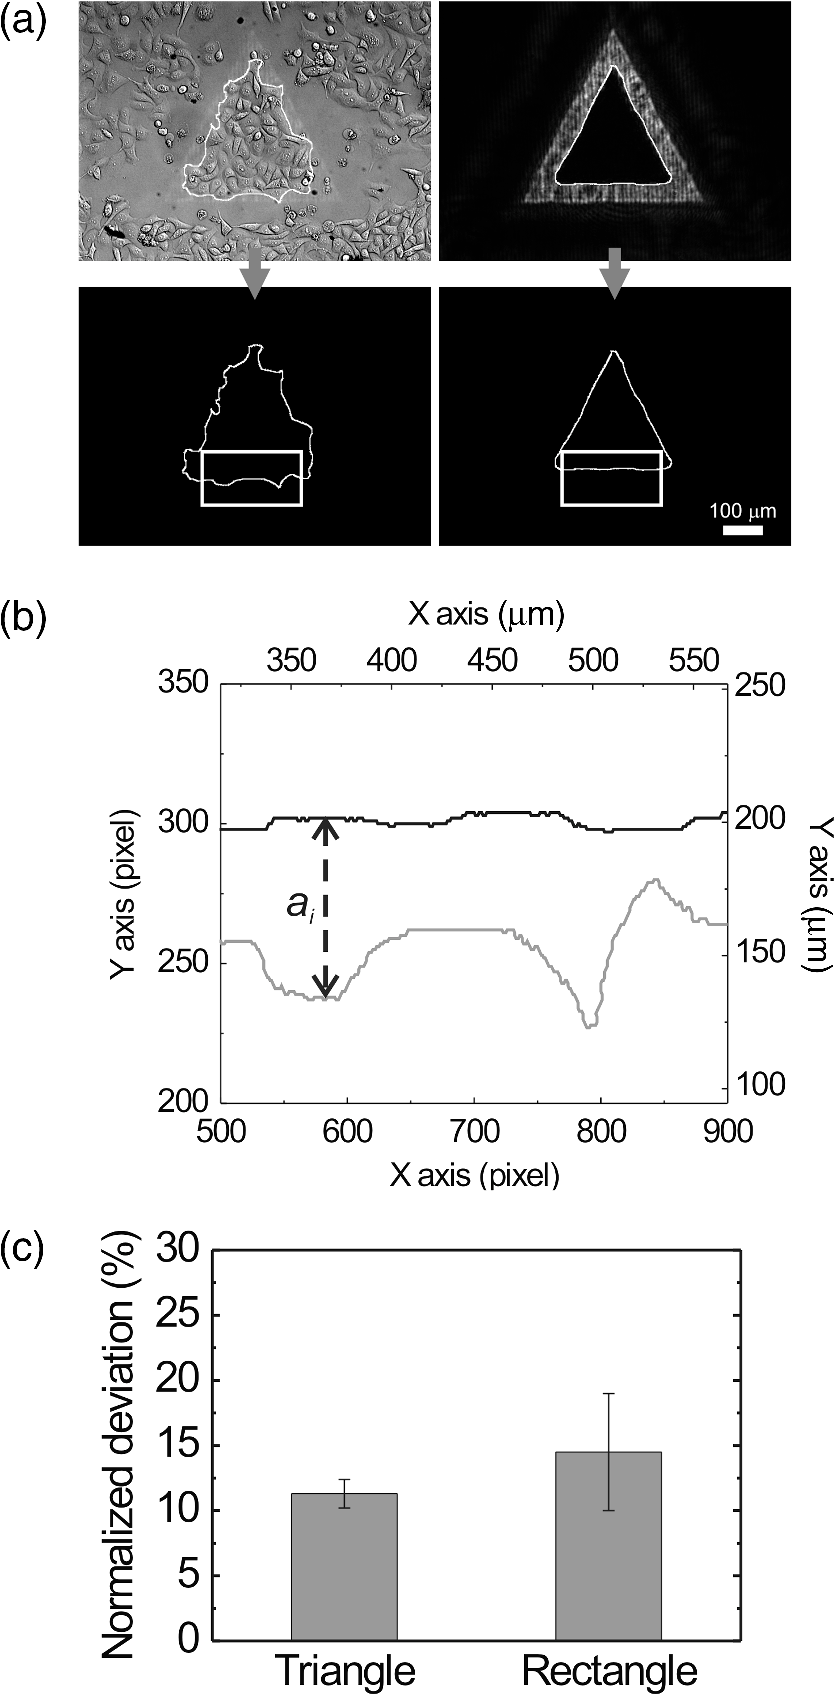 We also compared the proliferation rates of the patterned cells and the cells in normal culture conditions. The data in Fig. 4 show the proliferation rates in the patterned cultures are lower than that of the normal culture after the second day. From the images in Fig. 2 we learn that within the region enclosed by light patterns, the cell densities tend to be higher than those of normal cultures. Therefore the proliferation rates are reduced inside the region enclosed by the light patterns. Nonetheless, the difference is not significant even on the fourth day. After the fourth day, the confined cells continued proliferating, and the outer-most cells were pushed into the illuminated area. Those cells directly illuminated by the laser light tended to round and then detached from the dish bottom in 3 to 4 h. In these experiments, we found that the minimum cell numbers to form a pattern that fit the shape of the light patterns were around 10 to 15. Fewer cells proliferated slower and usually did not form a colony that filled up the pattern. Fig. 4Cell proliferation rates of normal and patterned cultures. The numbers of cells in normal culture were counted in the whole field of view. The data show the means and standard deviations of the independent experiments. 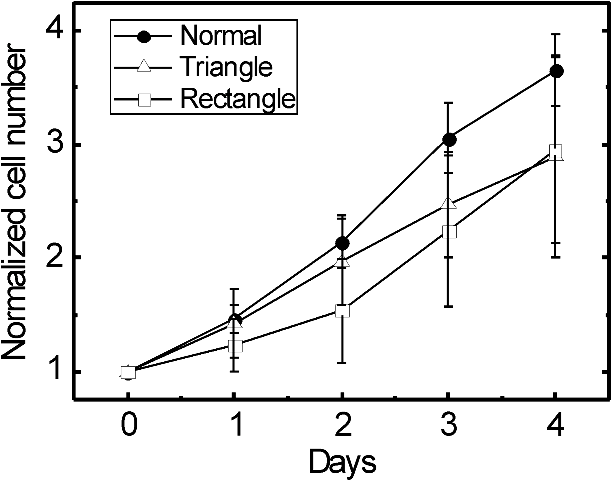 Because the light patterns provide accurate spatial and temporal controls on small-area cell cultures, this technique can find versatile applications in research related to cell motility. Figure 5 shows a wound-healing experiment conducted with the light pattern. We created two isolated colonies of CL1-5 cells in 48 h by using the light pattern shown in Fig. 5(b). In order to shorten the culture time before the wound-healing experiment, the initial cell density was higher than those used for the experiments in Fig. 2. The width of the gap between the two colonies was about 100 μm. Figure 5(c) to 5(e) shows the magnified view of the area enclosed by the solid rectangle in Fig. 5(b). The light pattern between the two colonies was turned off at the 48th hour, and the cells started to migrate into the blank region. Figure 5(f) shows the variation of the area occupied by cells in the region marked by a dash-dot rectangle in Fig. 5(c). While the light pattern was present, the cells covered an area smaller than 4% of the observed region. After the light pattern was turned off, the cells started to occupy the gap and filled up the observed region in the next 48 h. Video 4 shows the time-lapse video of this wound-healing experiment. Fig. 5Wound-healing experiment conducted with the light pattern. (a), (b) Two isolated colonies of CL1-5 cells created by the light pattern. (c)–(e) Time-lapse images of the area enclosed by the solid rectangle in (b) when the light pattern between the two colonies was turned off. (f) The variation of the cell area occupancy in the dash-dot rectangle in (c). (Video 4 MOV, 1.02 MB) [URL: http://dx.doi.org/10.1117/1.JBO.17.7.075004.4]. 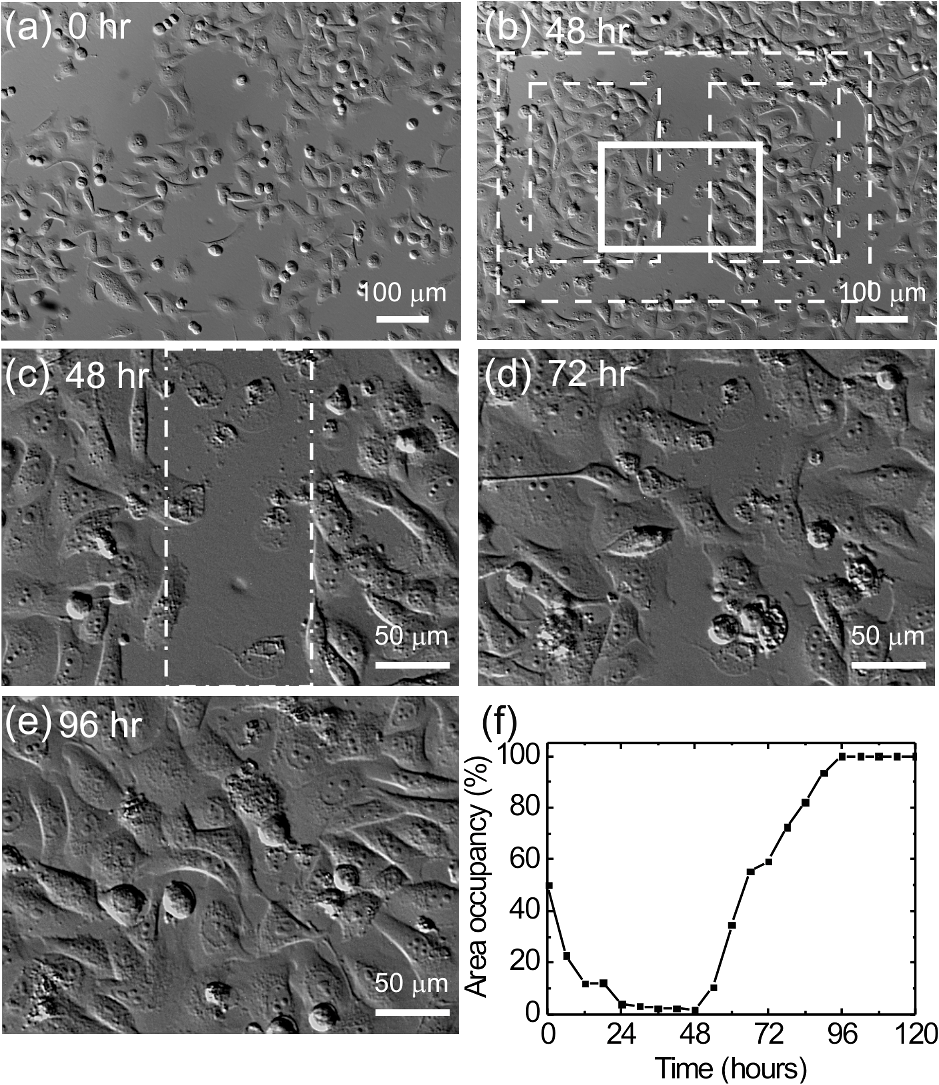 It is known that blue light induces the generation of reactive oxygen species around mitochondria.18,19 This effect is localized such that only the DNA of mitochondria, rather than the nuclear DNA, is damaged. Therefore the cell viability is not significantly reduced by blue light, but certain cell dysfunctions can be identified even with the intensity at the level. A recent study also confirmed that the blue light of 453 nm significantly reduces the anti-oxidative capacity of fibroblasts.20 We thus suspected that the 473 nm light has similar effects on mitochondria and therefore influences cell proliferation and movements. Figure 6(a) shows the DIC image of the CL1-5 cells and the fluorescence image of mitochondria after a 3-h treatment of the light pattern applied in the region enclosed by the dashed rectangle. The illumination was started from the 6th h after the cells were seeded into the culture dish. The structures of mitochondria in the cells in the illuminated region are dissolved; and the fluorescent signal disperses in the whole cells. A similar result was reported while the cells were irradiated by ultraviolet light, even for the cells that were not loaded with any photosensitizers.21 On the contrary, the mitochondria in the cells in the nonillumination region keep a clear network structure. This result indicates that the 473 nm light deteriorates the mitochondria within 3 h of illumination. Therefore the mechanism of cellular restraint by the 473-nm light patterns could be related to mitochondrial damage. We also calculated the ratio between the area with fluorescent signal and that occupied by cells in four independent experiments. In each experiment, more than 60 cells were counted in either the illuminated or the nonilluminated regions collected from 5 to 6 fields of view. Only the pixels with an intensity count larger than the average background level measured in the cytoplasms of the nonilluminated cells were recognized as those with fluorescent signal. The results in Fig. 6(b) demonstrate a clear difference between the mitochondrial structures in the illuminated cells and those in the nonilluminated ones. Fig. 6(a) DIC image of the CL1-5 cells and fluorescent image of the intracellular mitochondria stained by the MitoTracker® probe. (b) Ratios between the area with fluorescent signal and that occupied by cells in the regions without and with the blue-light illumination. Data show the of four independent experiments. In each experiment, more than 60 cells were counted in either the illuminated or the nonilluminated regions collected from 5–6 fields of view.  4.ConclusionWe demonstrated micropatterning of adherent cells by using 473 nm light patterns projected onto the focal plane of an objective. The cells formed confluence patterns defined by the light patterns, and the proliferation rates in triangular and rectangular micropatterns were close to that of normal culture. We also conducted a wound-healing experiment by using two isolated cell colonies created by the light pattern. The fluorescence image of intracellular mitochondria showed that the mitochondrial structures were degraded by the 473 nm light. Therefore, we suspected that the mechanism of optical confinement was related to mitochondrial damage caused by the blue light. Owing to the simplicity and the spatial-temporal control capability, this optically patterned culture technique will find broad applications in the studies of cell migration or cell–cell interactions. Meanwhile, since the heights of the light patterns are tens of micrometers, this technique might also be applicable for controlling the cell distributions in three-dimensional cell cultures. AcknowledgmentsThe authors would like to thank Prof. Pan-Chyr Yang, Department of Internal Medicine, National Taiwan University Hospital, and National Taiwan University College of Medicine, for providing the CL1-5 cells. This work is financially supported by the National Science Council of Taiwan (contract NSC 100-2112-M-001-022-MY3). ReferencesR. S. Kaneet al.,
“Patterning proteins and cells using soft lithography,”
Biomaterials, 20
(23–24), 2363
–2376
(1999). http://dx.doi.org/10.1016/S0142-9612(99)00165-9 BIMADU 0142-9612 Google Scholar
G. Kumaret al.,
“Spatially controlled cell engineering on biomaterials using polyelectrolytes,”
Langmuir, 19
(25), 10550
–10556
(2003). http://dx.doi.org/10.1021/la035309l LANGD5 0743-7463 Google Scholar
I. H. YangC. C. CoC.-C. Ho,
“Alteration of human neuroblastoma cell morphology and neurite extension with micropatterns,”
Biomaterials, 26
(33), 6599
–6609
(2005). http://dx.doi.org/10.1016/j.biomaterials.2005.04.024 BIMADU 0142-9612 Google Scholar
X. Y. Jianget al.,
“Directing cell migration with asymmetric micropatterns,”
Proc. Natl. Acad. Sci. U.S.A., 102
(4), 975
–978
(2005). http://dx.doi.org/10.1073/pnas.0408954102 PNASA6 0027-8424 Google Scholar
G. KumarC.-C. HoC. C. Co,
“Guiding cell migration using one-way micropattern arrays,”
Adv. Mater., 19
(8), 1084
–1090
(2007). http://dx.doi.org/10.1002/(ISSN)1521-4095 ADVMEW 0935-9648 Google Scholar
G. Mahmudet al.,
“Directing cell motions on micropatterned ratchets,”
Nat. Phys., 5
(8), 606
–612
(2009). http://dx.doi.org/10.1038/nphys1306 NPAHAX 1745-2473 Google Scholar
T. Kajiet al.,
“Nondestructive micropatterning of living animal cells using focused femtosecond laser-induced impulsive force,”
Appl. Phys. Lett., 91
(2), 023904
(2007). http://dx.doi.org/10.1063/1.2753103 APPLAB 0003-6951 Google Scholar
H. Yamamotoet al.,
“In-situ guidance of individual neuronal processes by wet femtosecond-laser processing of self-assembled monolayers,”
Appl. Phys. Lett., 99
(16), 163701
(2011). http://dx.doi.org/10.1063/1.3651291 APPLAB 0003-6951 Google Scholar
G. Bieneret al.,
“Optical torques guiding cell motility,”
Opt. Express, 17
(12), 9724
–9732
(2009). http://dx.doi.org/10.1364/OE.17.009724 OPEXFF 1094-4087 Google Scholar
J.-L. Xiaoet al.,
“Motion of cancer-cell lamellipodia perturbed by laser light of two wavelengths,”
Appl. Phys. Lett., 97
(20), 203702
(2010). http://dx.doi.org/10.1063/1.3517448 APPLAB 0003-6951 Google Scholar
L. GuN. IngleS. K. Mohanty,
“Detachment and reorientation of cells using near-infrared laser microbeam,”
J. Biomed. Opt., 16
(11), 115002
(2011). http://dx.doi.org/10.1117/1.3646207 JBOPFO 1083-3668 Google Scholar
P. Y. ChiouA. T. OhtaM. C. Wu,
“Massively parallel manipulation of single cells and microparticles using optical images,”
Nature, 436
(7049), 370
–372
(2005). http://dx.doi.org/10.1038/nature03831 NATUAS 0028-0836 Google Scholar
H.-y. Hsuet al.,
“Phototransistor-based optoelectronic tweezers for dynamic cell manipulation in cell culture media,”
Lab Chip, 10
(2), 165
–172
(2009). http://dx.doi.org/10.1039/b906593h LCAHAM 1473-0197 Google Scholar
S.-M. Yanget al.,
“Dynamic manipulation and patterning of microparticles and cells by using TiOPc-based optoelectronic dielectrophoresis,”
Opt. Lett., 35
(12), 1959
–1961
(2010). http://dx.doi.org/10.1364/OL.35.001959 OPLEDP 0146-9592 Google Scholar
D. J. Stevensonet al.,
“Optically guided neuronal growth at near infrared wavelengths,”
Opt. Express, 14
(21), 9786
–9793
(2006). http://dx.doi.org/10.1364/OE.14.009786 OPEXFF 1094-4087 Google Scholar
Y.-W. Chuet al.,
“Selection of invasive and metastatic subpopulations from a human lung adenocarcinoma cell line,”
Am. J. Respir. Cell Mol. Biol., 17
(3), 353
–360
(1997). AJRBEL 1044-1549 Google Scholar
M. Pootet al.,
“Analysis of mitochondrial morphology and function with novel fixable fluorescent stains,”
J. Histochem. Cytochem., 44
(12), 1363
–1372
(1996). http://dx.doi.org/10.1177/44.12.8985128 JHCYAS 0022-1554 Google Scholar
A. Kinget al.,
“Mitochondria-derived reactive oxygen species mediate blue light-induced death of retinal pigment epithelial cells,”
Photochem. Photobiol., 79
(5), 470
–475
(2004). http://dx.doi.org/10.1562/LE-03-17.1 PHCBAP 0031-8655 Google Scholar
B. F. Godleyet al.,
“Blue light induces mitochondrial DNA damage and free radical production in epithelial cells,”
J. Biol. Chem., 280
(22), 21061
–21066
(2005). http://dx.doi.org/10.1074/jbc.M502194200 JBCHA3 0021-9258 Google Scholar
C. Opländeret al.,
“Effects of blue light irradiation on human dermal fibroblasts,”
J. Photochem. Photobiol. B, 103
(2), 118
–125
(2011). http://dx.doi.org/10.1016/j.jphotobiol.2011.02.018 JPPBEG 1011-1344 Google Scholar
G. Ouedraogoet al.,
“Damage to mitochondria of cultured human skin fibroblasts photosensitized by fluoroquinolones,”
J. Photochem. Photobiol. B, 58
(1), 20
–25
(2000). http://dx.doi.org/10.1016/S1011-1344(00)00101-9 JPPBEG 1011-1344 Google Scholar
|


