|
|
1.IntroductionRoot canal treatment is a common dental procedure that includes the removal of the pulp tissue and the surrounding infected dentin. This is usually performed by mechanical debridement in the presence of irrigation solutions in combination with chelating and auxiliary agents used with instrumentation.1 A recent systematic review showed no consistency among irrigation regimes, concentrations of irrigation solutions, and contact times with regard to endodontic treatment outcomes.2 In clinical procedures, irrigation is an important process in eliminating microorganisms and debris from root canal system. Intra-canal cleaning and disinfection procedures are highly dependent on the mechanical instrumentation and chemical effects of the irrigants used. The desirable qualities of an irrigant include the ability to dissolve pulp tissue, to remove the smear layer, and low toxicity while providing a bactericidal-bacteriostatic effect.3 There is no general agreement regarding the optimal concentration of NaOCl or irrigation time necessary to eliminate bacteria from the canal system.4 However, these authors conclude that high concentration and long exposure to NaOCl are needed for elimination of Enterococcus faecalis contaminated dentin.4 It has been reported that some chemicals used for endodontic irrigation are capable of causing alterations in the chemical composition of dentin.5,6 These alterations are clinically relevant for the long-term success of root canal treatment because they may affect the root-sealing ability and coronal-bonding strength of dental materials.7 Dentin is a dynamic substrate with a complex organic structure. This substrate is composed of an organic matrix with 22% hydrated wt., most of which consists of collagen and an inorganic phase of carbonated apatite that contributes considerably to mechanical properties of dentin.8 Dentin microstructure and its properties are the primary determinants of almost all procedures in restorative dentistry and endodontic treatment.9 Several studies have described the microstructure of healthy dentin.10–12 However, only the study of Borges et al.6 evaluated the molecular changes of dentin when sodium hypochlorite was used on pulp chambers of primary and permanent teeth. Detailed data about these microstructures are essential to understand changes in the pulp chamber dentin and the efficacy of endodontic agents. Any method of microstructure analysis should demonstrate high resolution and sensitivity. Raman spectroscopy is a nondestructive technique that meets these analysis requirements and has been used to study dentin composition, differences between substrates13 and the structure of sample bonding.14 The relative intensities of Raman bands also allow for semi-quantitative estimations of the organic and inorganic composition of teeth.15 In addition, the energy-dispersive x-ray fluorescence spectrometry (EDXRF) technique complements the dentin microstructural information obtained by Raman spectroscopy. Although, several investigations have evaluated the effects of endodontic agents and irrigation solutions on the mechanical properties of root dentin,16–18 studies of morphological and chemical changes in the pulp chamber are necessary to determine clinical and adhesive procedures after the endodontic therapy. The purposes of this in vitro study were to evaluate the morphological and chemical changes in the inorganic and organic content of pulp chamber dentin after using endodontic agents through the use of scanning electron microscopy (SEM), Fourier-transform Raman spectroscopy (FT-Raman) and micro energy-dispersive x-ray fluorescence spectrometry (), and to identify the most useful endodontic agent considering the chemical and morphological approaches. We hypothesize that the use of endodontic agents changes the inorganic and organic content of pulp chamber dentin. 2.Materials and Methods2.1.Specimen PreparationThis study was conducted after approval of the Ethical Committee of Piracicaba Dental School, University of Campinas. Thirty sound human anterior permanent teeth, extracted for clinical and periodontal reasons, were selected. Teeth selection was based on relative dimensions, morphological similarity and the degree of tooth wear. Debris and soft tissue remnants were removed, and all teeth were stored in a 0.5% chloramine T solution for up to two months after extraction.19 Their roots were sectioned at the cementum-enamel junction using a double-face diamond saw (KG Sorensen, São Paulo, SP, Brazil) and discarded. The crowns were sectioned longitudinally in the mesio-distal direction to expose the pulp chamber. One side of the crown was randomly selected and embedded in polystyrene resin (Piraglass, Piracicaba, SP, Brazil) to facilitate sample manipulation, leaving the pulp chamber dentin exposed. The teeth were randomly distributed into six groups according to the agents used in the endodontic treatment (): NT-no treatment; CHX-2% chlorhexidine gel (Endosupport, São Paulo, SP, Brazil, #510572); CHXE- (Endosupport, São Paulo, SP, Brazil, #510572/Proderma, Laboratory of Manipulation, Piracicaba, São Paulo, SP, Brazil); E-17% EDTA (Proderma, Laboratory of Manipulation, Piracicaba, São Paulo, SP, Brazil); SH5-5.25% NaOCl (Proderma, Laboratory of Manipulation, Piracicaba, São Paulo, SP, Brazil); SH5E- (Proderma, Laboratory of Manipulation, Piracicaba, São Paulo, SP, Brazil). The experimental irrigation model was validated in a previous study.6 The specimens were individually immersed in 2 ml of their respective agents in polypropylene containers that were agitated in a shaking water bath at 37°C. The total immersion time was 30 min, except for the group (5 min). The solutions were changed every 5 min throughout the experimental period to simulate clinical conditions and to prevent saturation by the reaction products. For SH5E, a final flush (5 min) of EDTA was used after the irrigation. 2.2.FT-Raman Spectroscopy AnalysisThe treated dentin of pulp chamber dentin was analyzed by FT-Raman. The specimens were placed on a precision stage to obtain three spectra per area in each group, totaling 300 spectra. A FT-Raman spectrometer (RFS 100/S®; Bruker Inc., Karlsruhe, Germany) with a germanium diode detector cooled by liquid nitrogen was used to collect the data. To excite the spectra, an air-cooled Nd: YAG laser () source was used. The power of the Nd: YAG laser incident was 100 mW at a spectral resolution of , and for each measurement, three spectra per area in each group were accumulated with 100 scans.20 Based on the measurements, one average spectrum for each area was obtained, which was then analyzed by selecting a range from 586 to . OPUS® software (version 4.2, Bruker Optics GmHb 1997–2002, Billerica, MA) was used for data acquisition. Post-processing analysis for the qualitative and semi-quantitative spectral analyses of the changes in mineral and organic content was performed. Based on these measurements, one average spectrum for each area was obtained. The spectra in the region of interest, between 300 and , were analyzed by analytical software (Microcal Origin® 5.0 Software, Inc., Northampton, MA). The luminescence background was removed by a baseline correction for each collected spectrum before the relative comparisons of the inorganic and organic content were performed. All spectra were processed by fitting the Raman vibrational stretching mode at 586, 960, 1071, 1096, 1270, 1665, and . The band fitting of characteristic peaks was performed using a combined Gaussian/Lorentzian function to determine the exact position, peak intensities and integrated areas.21 In addition, all spectra were normalized using an intensity value of the band at (Refs. 21 and 22). 2.3.μEDXRF Spectrometry AnalysisThe semi-quantitative elemental analyses of calcium (Ca) (Ca wt.%), phosphorus (P) (P wt.%) and the ratio (wt ratio %) were conducted by an energy-dispersive micro x-ray fluorescence spectrometer, model 1300 (Shimadzu, Kyoto, Japan), equipped with a rhodium x-ray tube and an Si(Li) detector cooled by liquid nitrogen () and coupled to a computer system for data processing. The voltage in the tube was set at 50 kV, with an automatic adjustment of the current and a beam diameter of 50 μm. Three spectra from each group were collected. The measurements were performed with a count rate of 100 s per point (live time) and a dead time of 25%. The energy range of the scans was 0.0 to 40.0 eV. The equipment was adjusted using a certified commercial reagent of stoichiometric hydroxyapatite [Aldrich, synthetic , grade 99.999%, lot 10818HA] as a reference. The measurements were collected under fundamental parameters of characteristic x-ray emissions of Ca and P, and the elements O and H were used as a chemical balance. The energy calibration was performed using the internal standards of the equipment as previously reported.23,24 2.4.SEM AnalysisFor the SEM evaluation, impressions of the specimens were taken with a low-viscosity polyvinyl siloxane material (Aquasil, Dentsply DeTrey, Konstanz, Germany). The impressions were poured with epoxy resin (Buehler, Lake, Buff, IL), gold-sputter coated (Balzers-SCD 050 Sputter Coater, Liechtenstein) and observed by SEM (JEOL, JSM 5600LV, Tokyo, Japan) at an accelerating voltage of 15 kV, a working distance of 20 mm and with a magnification of . 2.5.Statistical AnalysisThe FT-Raman (changes in the integrated area under the peaks) and (Ca, P and the ratio) data were both analyzed. A Kruskal-Wallis test was performed to verify the differences between the treatment groups and the comparison of means was conducted using a post hoc Dunn comparison test (). These tests were used because the measured values did not have a normal distribution. SAS® system software (version 9.2-SP2, SAS Institute Inc., Cary: NC, 2002) was used, and the significance limit was set at 5%. 3.Results3.1.FT-Raman AnalysisThe selected range of Raman spectra from the inorganic and organic content of the dentin is shown in Figs. 1 and 2, respectively. The Raman spectrum was vertically shifted for clarity. The peak at was attributed to phosphate vibrations and the peak was related to vibration. The peak at was attributed to type B carbonate, and the band was related to A type vibrations22,25 (Fig. 1). The peak at was assigned to Amide III, the peak at was related to Amide I, and the peaks at were assigned to C-H stretching. Both were attributed to the organic content of the dentin (Fig. 2). The Raman spectra of the inorganic and organic content did not show an obvious reduction in intensity after treatment compared with the control group (Figs. 1 and 2). Fig. 1Permanent dentin Raman spectra in the 500 to range, with inorganic peaks as follows: : vibrations; : vibrations; : type B carbonate vibrations; : A type vibrations in the no treatment group (NT); 2% Chlorhexidine (CHX); 2% Chlorhexidine with 17% EDTA (CHXE); 5.25% sodium hypochlorite (SH5); 5.25% sodium hypochlorite with 17% EDTA (SH5E); and 17% EDTA (E). 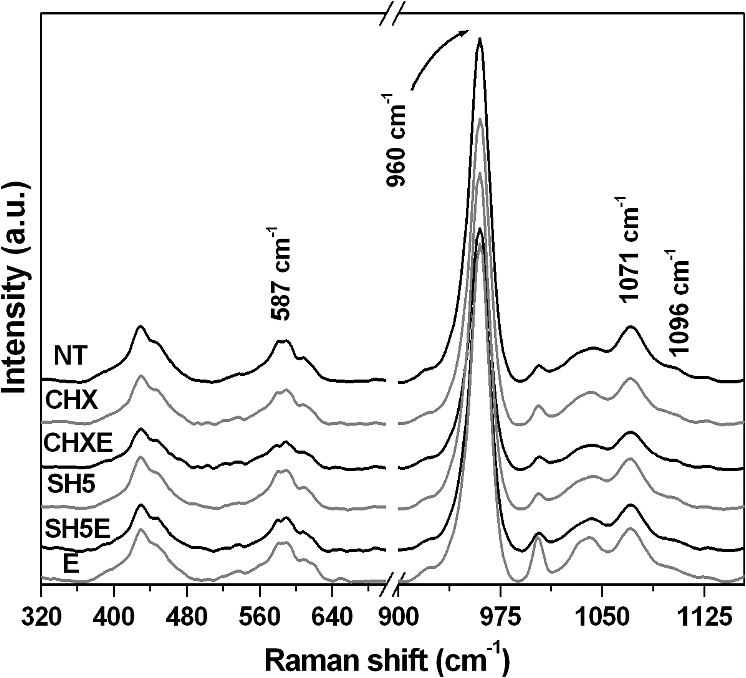 Fig. 2Permanent dentin Raman spectra in the 1200 to range, with organic peaks as follows: : amide III, : amide I and C-H bonds of organic content in the no treatment group (NT); 2% chlorhexidine (CHX); 2% chlorhexidine with 17% EDTA (CHXE) 5.25% sodium hypochlorite (SH5); 5.25% sodium hypochlorite with 17% EDTA (SH5E); and 17% EDTA (E). 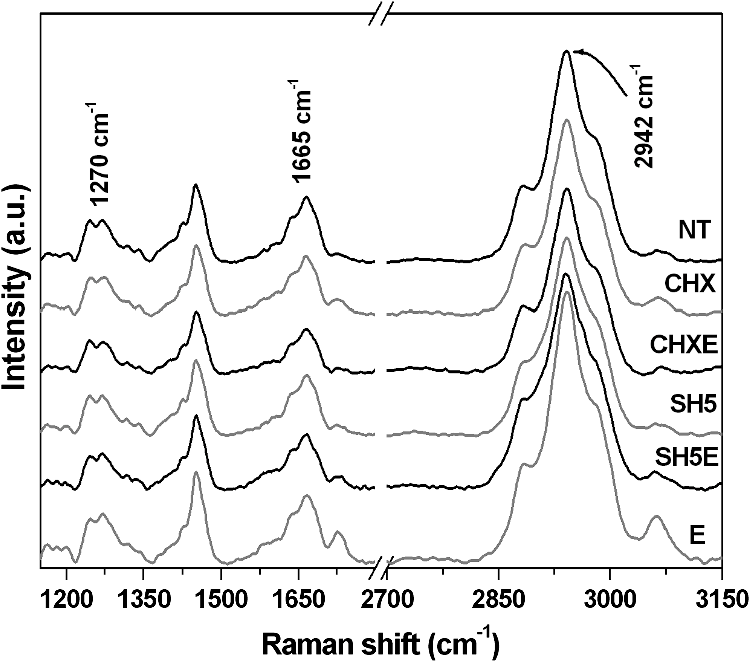 Table 1 presents the means and standard deviations (SD) of the integrated area of the Raman peaks for the permanent teeth treatments. Statistical analysis showed no differences in the integrated areas among the experimental groups for all inorganic and organic peaks (), except for the inorganic peak at () (Table 1). Control group (NT) was statistically different from SH5 and SH5E (). Table 1Means and standard deviations (mean±SD) of integrated area of the Raman peaks regarding treatments.
Similar capital letters in column mean no significant statistical difference among treatments, according to Kruskall-Wallis and Dunn tests (p>0.05). 3.2.μEDXRF AnalysisTable 2 shows the means and SD values of the Ca and P content and the ratios in the dentin. Regarding the Ca and P content, the values were statistically different (). For the ratios, CHXE and E presented the highest ratio values compared with the other groups (). Table 2Element content in wt% (mean±SD) in dentin pulp chamber.
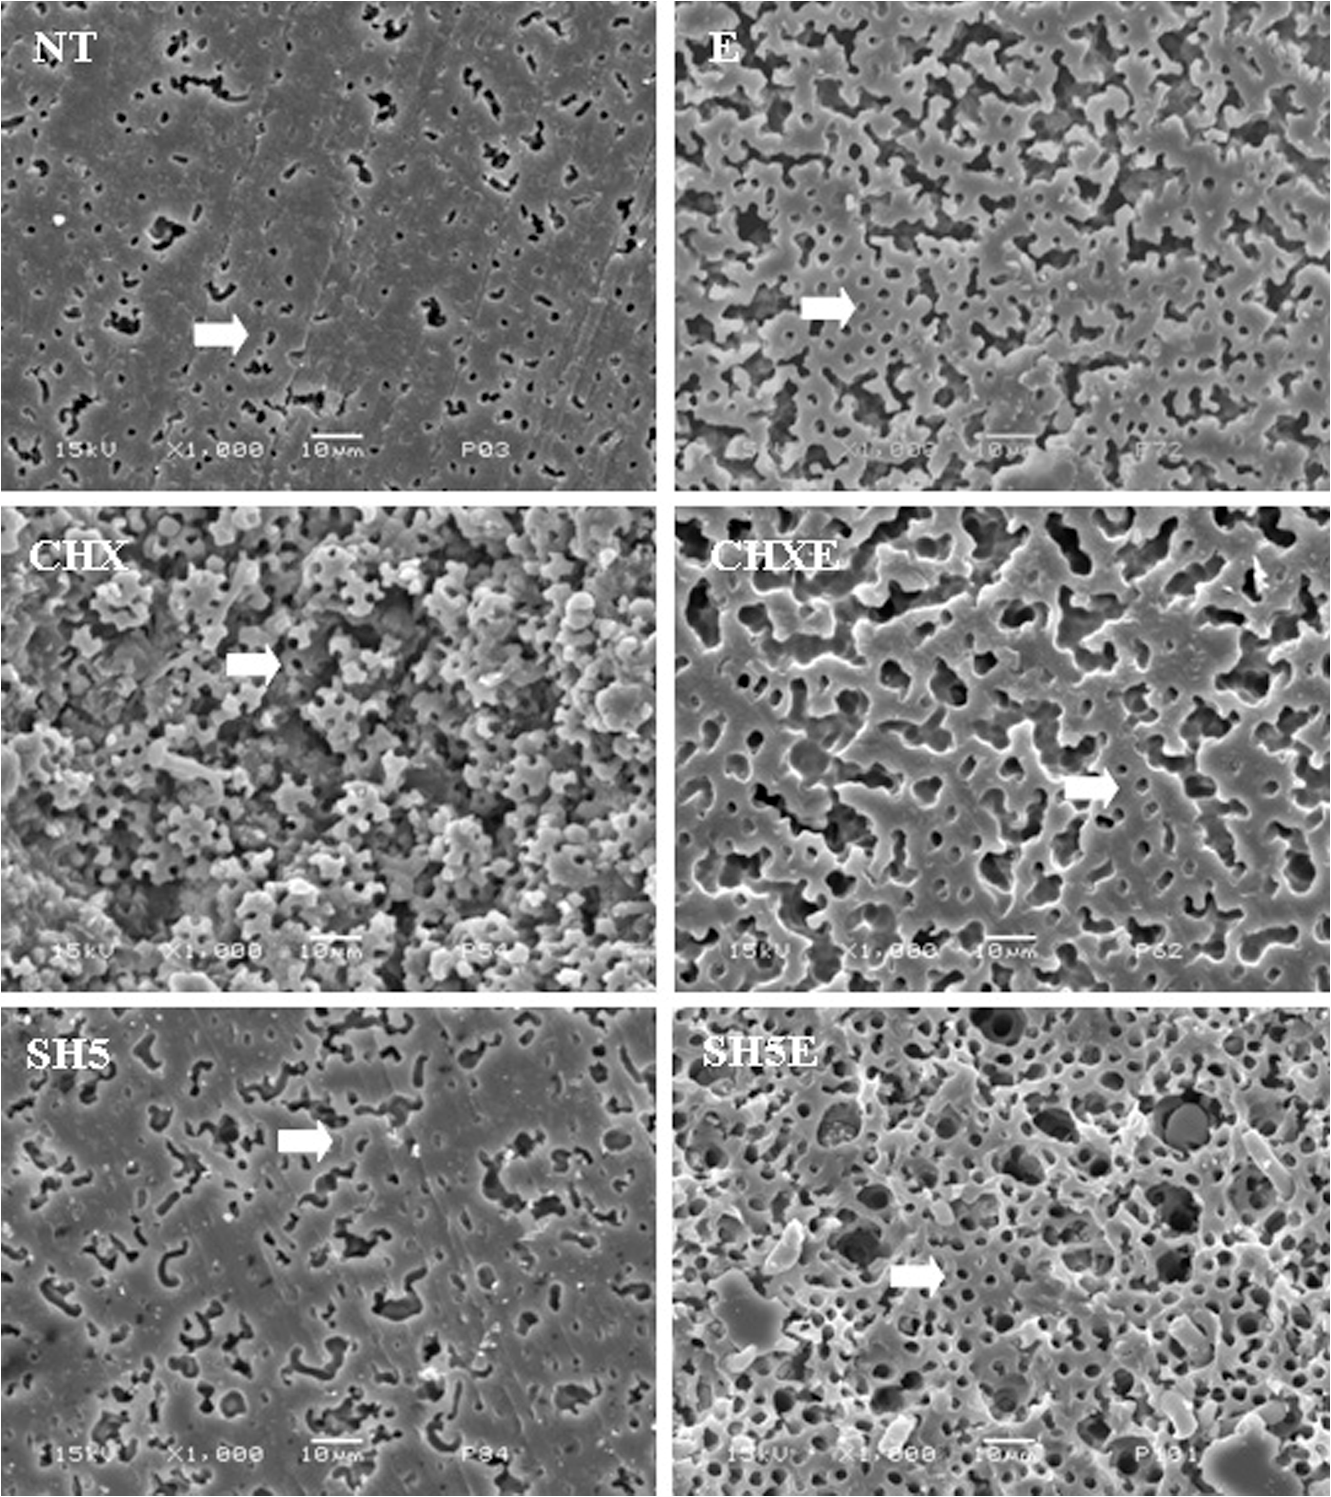
Similar capital letters in column mean no significant statistical difference among treatments, according to Kruskall-Wallis test (p>0.05). 3.3.SEM Descriptive AnalysisRepresentative SEM images of the pulp chamber dentin surfaces are shown in Fig. 3. The SEM observations revealed different morphological features for the experimental groups. Groups treated with EDTA showed the highest number of open tubules. However, all SEM images showed some exposition of tubules. For the groups treated with CHX and SH5E, this exposition could be observed in dentinal tubule erosion. 4.DiscussionThe hypothesis that endodontic irrigation would change the inorganic and organic content of pulp chamber dentin was confirmed. The Raman spectra of phosphate peaks (), carbonate peaks ( band, assigned to B type carbonate; band related to A type ) and organic peaks (, assigned to Amide III; , assigned to Amide I; and , assigned to C-H stretching) did not show differences in the molecular features of the pulp chamber dentin when the commonly used endodontic agents were tested. However, alterations in band at , in the Ca and P content and the ratio were observed in the FT-Raman and data. Combining FT-Raman spectroscopy (semi-quantitative analysis) with the technique (quantitative analysis) and SEM (descriptive analysis) would help provide valuable information on the chemical composition and morphology of dentin after endodontic treatment. In the present study, the utility of the analysis was evaluated as a method complementary to FT-Raman spectroscopy, to obtain chemical information on the effects of endodontic treatment in the pulp chamber dentin after endodontic irrigation. We found that all irrigation solutions changed the Ca and P content. The changes induced by the agents could likely be determined by the action of the chemical agents evaluated. However, chlorhexidine induced higher changes in these inorganic components with and without EDTA. Different concentrations of EDTA are capable of extracting calcium from root canal dentin. In contrast to EDTA, NaOCl is not a chelating agent but is capable of removing magnesium and carbonate ions from dentin.26 In addition, Borges et al.6 demonstrated that 1% NaOCl was sufficient to modify the molecular arrangement of inorganic dentin content. Conversely, an indirect explanation for the effects of CHX can be made. CHX is a cationic compound that has the ability to bind anionic molecules, such as the phosphate present in the hydroxyapatite structure. Phosphate exists in the calcium carbonate complex of dentin; therefore, CHX can bind phosphate, which in turn can lead to the release of small amounts of calcium from dentin.27,28 However, Moreira et al.29 found that a 2% CHX gel, whether associated or not associated with 17% EDTA, did not promote morphological structure alterations of the organic dentin matrix of bovine root dentin. Their results indicate that a 2% CHX gel is an auxiliary chemical substance that does not interfere with the collagen present in the organic matrix of root dentin.29 In contrast, in this study, CHXE induced morphological alterations and greater changes of the ratio of pulp chamber dentin in permanent teeth. Ca and P present in hydroxyapatite crystals are the major inorganic components of hard dental tissue. The ratio of hydroxyapatite in dentin determines the basic composition of dental hard tissue surfaces. This ratio depends on the crystal type, the availability of Ca, the anatomical location and the technique of determination.30,31 Dogan & Çalt5 showed that 17% EDTA combined with a 2.5% NaOCl irrigation as a final flush and 2.5% NaOCl alone significantly changed the ratio of root dentin. In an Ari & Erdemir study,32 Ca and P levels decreased after treatment with a solution containing 0.2% chlorhexidine gluconate, 3% , 17% EDTA and 2.5% NaOCl, but not a 5.25% NaOCl solution, compared with the control group (distilled water). However, these studies were conducted in root dentin, complicating the comparison of results. The alterations detected in the band at , could be explained by chemical reaction of some calcium phosphate and calcium carbonate molecules with NaOCl.6 If some hydroxyapatite molecules could react with sodium hypochlorite, the result would be calcium hypochlorite, sodium phosphate, and water, which also could contribute to molecular changes detected by FT-Raman.6 In addition, this change could produce unbound hydroxyapatite crystals and reveal a mineral surface rich in hydroxyl, carbonate, and phosphate groups.33,34 The concentration of NaOCl in solutions is commonly between 0.5% and 6%. NaOCl is a potent antimicrobial agent, killing most bacteria. It also effectively dissolves pulp remnants and collagen, the main organic components of dentin.35 However, in the present study, 5.25% NaOCl was not able to alter the organic content of permanent dentin in the pulp chamber and was the better irrigation solution with respect to calcium and phosphorous content analyzed by EDXRF. This characteristic also was observed for the combination of NaOCl and EDTA, similar to the control group (no treatment). EDXRF and FT-Raman showed different results. This difference is explained by the operation principles of techniques. Raman spectra provide the analysis from bulk material, since the laser penetration depth is more than 1.0 mm. Micro-EDX analysis was done with points of 50 μm of diameter and penetration depth of few units of μm. The most important difference in resolution between both techniques resides in the incident or excitation beam, relating to the wavelength and energy. X-rays are shorter and more energetic than infrared laser used in Raman technique. From a clinical standpoint, the results of the present study suggest that sodium hypochlorite combined with EDTA is the best choice for the endodontic irrigation of permanent teeth due to less change in the inorganic and organic content of the pulp chamber. Haapasalo et al.36 stated in a recent review that optimal irrigation is based on the combined use of two or several irrigating solutions in a specific sequence to predictably obtain the goals of safe and effective irrigation. In addition, according to Violich and Chandler,37 the purpose of root canal irrigation is twofold: to remove the organic component and debris from pulp tissue and microorganisms and to remove the mostly inorganic component that comprises the smear layer. Therefore, if this layer is to be removed, the method of choice appears to be the alternate use of EDTA and sodium hypochlorite solutions.35 5.ConclusionsConsidering chemical and morphological approaches utilized in this study we concluded that the use of endodontic agents changes the inorganic and organic content of pulp chamber dentin. Sodium hypochlorite used alone, or in association with EDTA, was the most effective irrigation solution of all the other agents used on pulp chamber dentin. AcknowledgmentsThe authors are grateful to Department of Pediatric Dentistry (University of Campinas) and Laboratory of Biomedical Vibrational Spectroscopy (Vale do Paraíba University). This study was supported by FAPESP, São Paulo Research Support Foundation (Grant Nos. 05/58561-1, 01/14384-8, 05/50811-9). ReferencesD. McCombD. C. Smith,
“A preliminary scanning electron microscopic study of root canals after endodontic procedures,”
J. Endod., 1
(7), 238
–242
(1975). http://dx.doi.org/10.1016/S0099-2399(75)80226-3 0099-2399 Google Scholar
F. M. Pasconet al.,
“Effect of sodium hypochlorite on dentine mechanical properties. A review,”
J. Dent., 37
(12), 903
–908
(2009). http://dx.doi.org/10.1016/j.jdent.2009.07.004 0300-5712 Google Scholar
M. M. Menezeset al.,
“In vitro evaluation of the effectiveness of irrigants and intracanal medicaments on microorganisms within root canals,”
Int. Endod. J., 37
(5), 311
–319
(2004). http://dx.doi.org/10.1111/iej.2004.37.issue-5 IENJEA 1365-2591 Google Scholar
B. Retamozoet al.,
“Minimum contact time and concentration of sodium hypochlorite required to eliminate Enterococcus faecalis,”
J. Endod., 36
(3), 520
–523
(2010). http://dx.doi.org/10.1016/j.joen.2009.12.005 0099-2399 Google Scholar
H. DoğanS. Çalt,
“Effects of chelating agents and sodium hypochlorite on mineral content of root dentin,”
J. Endod., 27
(9), 578
–580
(2001). http://dx.doi.org/10.1097/00004770-200109000-00006 0099-2399 Google Scholar
A. F. Borgeset al.,
“NaOCl effects on primary and permanent pulp chamber dentin,”
J. Dent., 36
(9), 745
–753
(2008). http://dx.doi.org/10.1016/j.jdent.2008.05.013 0300-5712 Google Scholar
J. Perdigãoet al.,
“Effect of calcium removal on dentin bond strengths,”
Quintessence Int.Quintessence Int., 3232
(27), 142524
–146
(2001). DEDIAY 0033-6572 Google Scholar
D. H. Pashley,
“Dentin: a dynamic substrate—a review,”
Scanning Microsc., 3
(1), 161174
–174176
(1989). SCMIEU 0891-7035 Google Scholar
G. W. Marshallet al.,
“The dentin substrate: structure and properties related to bonding,”
J. Dent., 25
(6), 441
–458
(1997). http://dx.doi.org/10.1016/S0300-5712(96)00065-6 0099-2399 Google Scholar
J. H. Kinneyet al.,
“A micromechanics model of the elastic properties of human dentine,”
Arch. Oral Biol., 44
(10), 813
–822
(1999). http://dx.doi.org/10.1016/S0003-9969(99)00080-1 AOBIAR 0003-9969 Google Scholar
L. AngkerM. V. SwainN. Kilpatrick,
“Micro-mechanical characterization of the properties of primary tooth dentine,”
J. Dent., 31
(4), 261
–267
(2003). http://dx.doi.org/10.1016/S0300-5712(03)00045-9 0099-2399 Google Scholar
J. H. KinneyS. J. MarshallG. W. Marshall,
“The mechanical properties of human dentin: a critical review and re-evaluation of the dental literature,”
Crit. Rev. Oral Biol. Med., 14
(1), 13
–29
(2003). http://dx.doi.org/10.1177/154411130301400103 CROMEF 1045-4411 Google Scholar
A. F. S. Borgeset al.,
“New perspectives about molecular arrangement of primary and permanent dentin,”
Appl. Surf. Sci., 254
(5), 1498
–1505
(2007). http://dx.doi.org/10.1016/j.apsusc.2007.07.018 ASUSEE 0169-4332 Google Scholar
E. Wentrup-Byrneet al.,
“Fourier transform Raman microscopic mapping of the molecular components in a human tooth,”
J. Raman Spectrosc., 28
(2–3), 151
–158
(1997). http://dx.doi.org/10.1002/(ISSN)1097-4555 JRSPAF 0377-0486 Google Scholar
L. E. S. Soareset al.,
“Effects of Er:YAG laser irradiation and manipulation treatments on dentin components, part 1: Fourier transform-Raman study,”
J. Biomed. Opt., 14
(2), 024001
(2009). http://dx.doi.org/10.1117/1.3103285 JBOPFO 1083-3668 Google Scholar
A. A. SalehW. M. Ettman,
“Effect of endodontic irrigation solutions on microhardness of root canal dentine,”
J. Dent., 27
(1), 43
–46
(1999). http://dx.doi.org/10.1016/S0300-5712(98)00018-9 0099-2399 Google Scholar
T. P. Simet al.,
“Effect of sodium hypochlorite on mechanical properties of dentine and tooth surface strain,”
Int. Endod. J., 34
(2), 120
–132
(2001). http://dx.doi.org/10.1046/j.1365-2591.2001.00357.x IENJEA 1365-2591 Google Scholar
M. Marendinget al.,
“Effect of sodium hypochlorite on human root dentine—mechanical, chemical and structural evaluation,”
Int. Endod. J., 40
(10), 786
–793
(2007). http://dx.doi.org/10.1111/iej.2007.40.issue-10 IENJEA 1365-2591 Google Scholar
K. C. Titleyet al.,
“The effect of various storage methods and media on shear-bond strengths of dental composite resin to bovine dentine,”
Arch. Oral Biol., 43
(4), 305
–311
(1998). http://dx.doi.org/10.1016/S0003-9969(97)00112-X AOBIAR 0003-9969 Google Scholar
C. Steiner-Oliveiraet al.,
“Chemical, morphological and thermal effects of 10.6-microm CO2 laser on the inhibition of enamel demineralization,”
Dent. Mater. J., 25
(3), 455
–462
(2006). DMJOD5 Google Scholar
Y. LiuC. Y. Hsu,
“Laser-induced compositional changes on enamel: a FT-Raman study,”
J. Dent., 35
(3), 226
–230
(2007). http://dx.doi.org/10.1016/j.jdent.2006.08.006 0099-2399 Google Scholar
G. Penelet al.,
“MicroRaman spectral study of the and vibrational modes in synthetic and biological apatites,”
Calcif. Tissue Int., 63
(6), 475
–481
(1998). http://dx.doi.org/10.1007/s002239900561 CTINDZ 0171-967X Google Scholar
F. G. de Carvalhoet al.,
“Mineral distribution and CLSM analysis of secondary caries inhibition by fluoride/MDPB-containing adhesive system after cariogenic challenges,”
J. Dent., 37
(4), 307
–314
(2009). http://dx.doi.org/10.1016/j.jdent.2008.12.006 0099-2399 Google Scholar
L. E. S. Soareset al.,
“Effects of Er:YAG laser irradiation and manipulation treatments on dentin components, part 2: energy-dispersive x-ray fluorescence spectrometry study,”
J. Biomed. Opt., 14
(2), 024002
(2009). http://dx.doi.org/10.1117/1.3103287 JBOPFO 1083-3668 Google Scholar
H. TsudaJ. RubenJ. Arends,
“Raman spectra of human dentin mineral,”
Eur. J. Oral Sci., 104
(2), 123
–131
(1996). http://dx.doi.org/10.1111/eos.1996.104.issue-2 EJOSFY 0909-8836 Google Scholar
T. SakaeH. MishimaY. Kozawa,
“Changes in bovine dentin mineral with sodium hypochlorite treatment,”
J. Dent. Res., 67
(9), 1229
–1234
(1988). http://dx.doi.org/10.1177/00220345880670091601 JDREAF 0022-0345 Google Scholar
J. CookR. NandakumarA. F. Fouad,
“Molecular-and culture-based comparison of the effects of antimicrobial agents on bacterial survival in infected dentinal tubules,”
J. Endod., 33
(6), 690
–692
(2007). http://dx.doi.org/10.1016/j.joen.2007.01.022 0099-2399 Google Scholar
T. C. Sayinet al.,
“Time-dependent decalcifying effects of endodontic irrigants with antibacterial properties,”
J. Endod., 35
(2), 280
–283
(2009). http://dx.doi.org/10.1016/j.joen.2008.11.016 0099-2399 Google Scholar
D. M. Moreiraet al.,
“Structural analysis of bovine root dentin after use of different endodontics auxiliary chemical substances,”
J. Endod., 35
(7), 1023
–1027
(2009). http://dx.doi.org/10.1016/j.joen.2009.04.002 0099-2399 Google Scholar
M. Cohenet al.,
“Calcium and phosphorus content of root exposed to the oral environment,”
J. Clin. Periodontol., 19
(4), 268
–273
(1992). http://dx.doi.org/10.1111/cpe.1992.19.issue-4 JCPEDZ 0303-6979 Google Scholar
G. W. Marshall Jr.,
“Dentin: microstructure and characterization,”
Quintessence Int., 24
(9), 606
–617
(1993). DEDIAY 0033-6572 Google Scholar
H. AriA. Erdemir,
“Effects of endodontic irrigation solutions on mineral content of root canal dentin using ICP-AES technique,”
J. Endod., 31
(3), 187
–189
(2005). http://dx.doi.org/10.1097/01.don.0000137643.54109.81 0099-2399 Google Scholar
M. Di Renzoet al.,
“A photoacoustic FTIRS study of the chemical modifications of human dentin surfaces: II. Deproteination,”
Biomaterials, 22
(8), 793
–797
(2001). http://dx.doi.org/10.1016/S0142-9612(00)00239-8 BIMADU 0142-9612 Google Scholar
P. Fattibeneet al.,
“A comparative EPR, infrared and Raman study of natural and deproteinated tooth enamel and dentin,”
Phys. Med. Biol., 50
(6), 1095
–1108
(2005). http://dx.doi.org/10.1088/0031-9155/50/6/004 PHMBA7 0031-9155 Google Scholar
M. Zehnderet al.,
“Tissue-dissolving capacity and antibacterial effect of buffered and unbuffered hypochlorite solutions,”
Oral Surg. Oral Med. Oral Pathol. Oral Radiol. Endod., 94
(6), 756
–762
(2002). http://dx.doi.org/10.1067/moe.2002.128961 1079-2104 Google Scholar
M. Haapasaloet al.,
“Irrigation in endodontics,”
Dent. Clin. North Am., 54
(2), 291
–312
(2010). http://dx.doi.org/10.1016/j.cden.2009.12.001 DCNAAC 0011-8532 Google Scholar
D. R. ViolichN. P. Chandler,
“The smear layer in endodontics—a review,”
Int. Endod. J., 43
(1), 2
–15
(2010). http://dx.doi.org/10.1111/iej.2009.43.issue-1 IENJEA 1365-2591 Google Scholar
|
|||||||||||||||||||||||||||||||||||||||||||||||||||||||||||||||||||||||||||||||||||||||||||||||||||||